| ASX Release 5 May 2025 Westpac 2025 Interim Financial Results Announcement (incorporating the requirements of Appendix 4D) Westpac Banking Corporation (“Westpac”) today provides the attached Westpac 2025 Interim Financial Results Announcement (incorporating the requirements of Appendix 4D). For further information: Hayden Cooper Justin McCarthy Group Head of Media Relations General Manager, Investor Relations 0402 393 619 0422 800 321 This document has been authorised for release by Tim Hartin, Company Secretary. Level 18, 275 Kent Street Sydney, NSW, 2000 |
| INTERIM FINANCIAL RESULTS FOR THE SIX MONTHS ENDED 31 MARCH 2025 Incorporating the requirements of Appendix 4D Westpac Banking Corporation ABN 33 007 457 141 |

| WESTPAC GROUP 2025 INTERIM FINANCIAL RESULTS Acknowledgement of Indigenous Peoples Westpac acknowledges the First Peoples of Australia. We recognise their ongoing role as Traditional Owners of the land and waters of this country and pay our respects to Elders, past and present. We extend our respect to Westpac’s Aboriginal and Torres Strait Islander employees, partners and stakeholders and to the Indigenous Peoples in the other locations where we operate. In Aotearoa (New Zealand) we also acknowledge tāngata whenua and the unique relationship that Indigenous Peoples share with all New Zealanders under Te Tiriti o Waitangi. Westpac’s 2025 Interim Financial Results The information in this report relates to our First Half 2025 reporting period unless stated otherwise. Additional information on our First Half 2025 financial, non-financial, risk and sustainability performance is included in our: • First Half 2025 Financial Results Presentation and Investor Discussion Pack; and • March 2025 Pillar 3 Report. These documents are available online at westpac.com.au/about-westpac/investor-centre/events-and-presentations/. In this 2025 Interim Financial Results Announcement a reference to ‘Westpac’, 'WBC', ‘Westpac Group’, ‘the Group’, ‘we’, ‘us’ and ‘our’ are to Westpac Banking Corporation ABN 33 007 457 141 and its subsidiaries unless it clearly means just Westpac Banking Corporation. For certain information about the basis of preparing the financial and non-financial information see Introduction (page iv). In addition, this Results Announcement contains statements that constitute ‘forward-looking statements’ within the meaning of Section 21E of the US Securities Exchange Act of 1934. For an explanation of forward-looking statements and the risks, uncertainties and assumptions to which they are subject, see Introduction (page iv). Please consider those important disclaimers when reading the forward-looking statements in this Results Announcement. Information contained in or accessible through the websites mentioned in this Results Announcement does not form part of this Results Announcement unless we specifically state that it is incorporated by reference and forms part of this Results Announcement. Information on those websites owned by Westpac is current as at the date of this Results Announcement. Except as required by law, we assume no obligation to revise or update those websites after the date of this Results Announcement. We are not in a position to verify information on websites owned and/or operated by third parties. Westpac Banking Corporation ABN 33 007 457 141 |
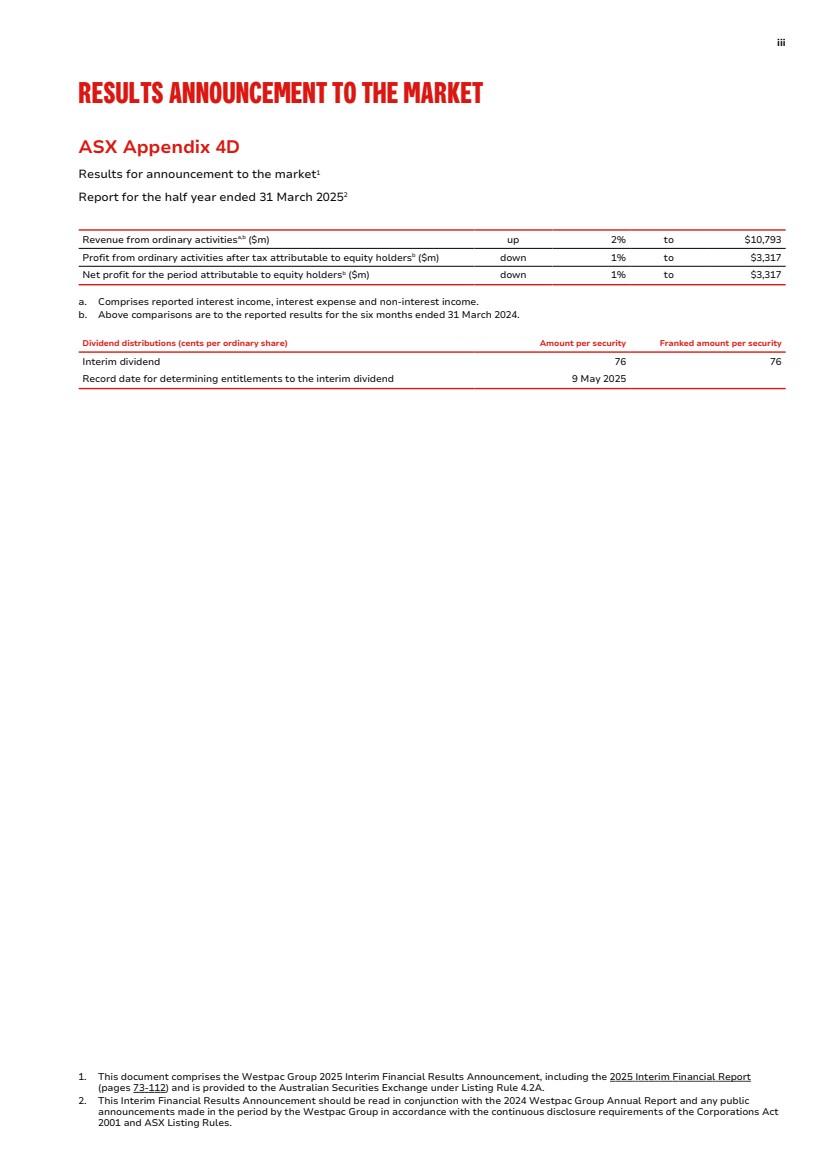
| iii RESULTS ANNOUNCEMENT TO THE MARKET ASX Appendix 4D Results for announcement to the market1 Report for the half year ended 31 March 20252 Revenue from ordinary activitiesa,b ($m) up 2% to $10,793 Profit from ordinary activities after tax attributable to equity holdersb ($m) down 1% to $3,317 Net profit for the period attributable to equity holdersb ($m) down 1% to $3,317 a. Comprises reported interest income, interest expense and non-interest income. b. Above comparisons are to the reported results for the six months ended 31 March 2024. Dividend distributions (cents per ordinary share) Amount per security Franked amount per security Interim dividend 76 76 Record date for determining entitlements to the interim dividend 9 May 2025 1. This document comprises the Westpac Group 2025 Interim Financial Results Announcement, including the 2025 Interim Financial Report (pages 73-112) and is provided to the Australian Securities Exchange under Listing Rule 4.2A. 2. This Interim Financial Results Announcement should be read in conjunction with the 2024 Westpac Group Annual Report and any public announcements made in the period by the Westpac Group in accordance with the continuous disclosure requirements of the Corporations Act 2001 and ASX Listing Rules. |
| iv WESTPAC GROUP 2025 INTERIM FINANCIAL RESULTS RESULTS ANNOUNCEMENT TO THE MARKET Introduction Our interim period refers to the six months ended 31 March 2025 (First Half 2025 or 1H25). Throughout this Interim Financial Results Announcement (Results Announcement), we also refer to the six months ended 31 March 2024 (First Half 2024, 1H24, or prior corresponding period), and the six months ended 30 September 2024 (Second Half 2024, 2H24, or prior period). The selected financial information for First Half 2025, Second Half 2024 and First Half 2024 contained in this Results Announcement is based on the financial statements contained in the unaudited consolidated Interim Financial Report for Westpac Banking Corporation (Westpac) and its controlled entities (collectively referred to as ‘the Group’) for the six months ended 31 March 2025. The Interim Financial Report has been prepared and presented in accordance with Australian Accounting Standards (AAS) as they relate to interim financial reports. The Interim Financial Report also complies with International Financial Reporting Accounting Standards (IFRS) as issued by the International Accounting Standards Board (IASB) as they relate to interim financial reports. This Results Announcement contains certain statements that constitute ‘forward-looking statements’. For an explanation of forward-looking statements and the risks, uncertainties and assumptions to which they are subject, see Disclosure regarding forward-looking statements (page 114-115). Please consider those important disclaimers when reading the forward-looking statements in this Results Announcement. In this Results Announcement references to ‘Westpac’, ‘WBC’, ‘Westpac Group’, ‘the Group’, ‘we’, ‘us’ and ‘our’ are to Westpac Banking Corporation and its controlled entities, unless it clearly means just Westpac Banking Corporation. Percentage (%) movements are shown as % unless otherwise stated. This applies to all the tables in this Results Announcement. Unless otherwise stated, average balances represents a daily average over the relevant half year. All dollar values in this Results Announcement are in Australian dollars unless otherwise noted. References to ‘dollars’, ‘dollar amounts’, ‘$’, ‘AUD’ or ‘A$’ are to Australian dollars, references to ‘US$’, ‘USD’ or ‘US dollars’ are to United States dollars, references to ‘NZ$’, ‘NZD’ or ‘NZ dollars’ are to New Zealand dollars and references to 'GBP' are to British Pound Sterling. Refer to Exchange Rates (page 121) for information regarding the rates of exchange between the Australian dollar and the US dollar applied by the Group as part of its operating activities for First Half 2025, Second Half 2024 and First Half 2024. Information on terms, acronyms and calculations used in this Results Announcement are provided in the Glossary (pages 124-127) of the document. Non-AAS financial measures Westpac’s statutory results are prepared in accordance with AAS and are also compliant with IFRS. In assessing Westpac’s performance and that of our operating segments, we use a number of financial measures, including amounts, measures and ratios that are presented on a non-AAS basis, as described below. Non-AAS financial measures and ratios do not have standardised meanings under AAS. As such they are unlikely to be directly comparable to similar measures presented by other companies and should not be viewed in isolation from, or as a substitute for, the AAS results. |

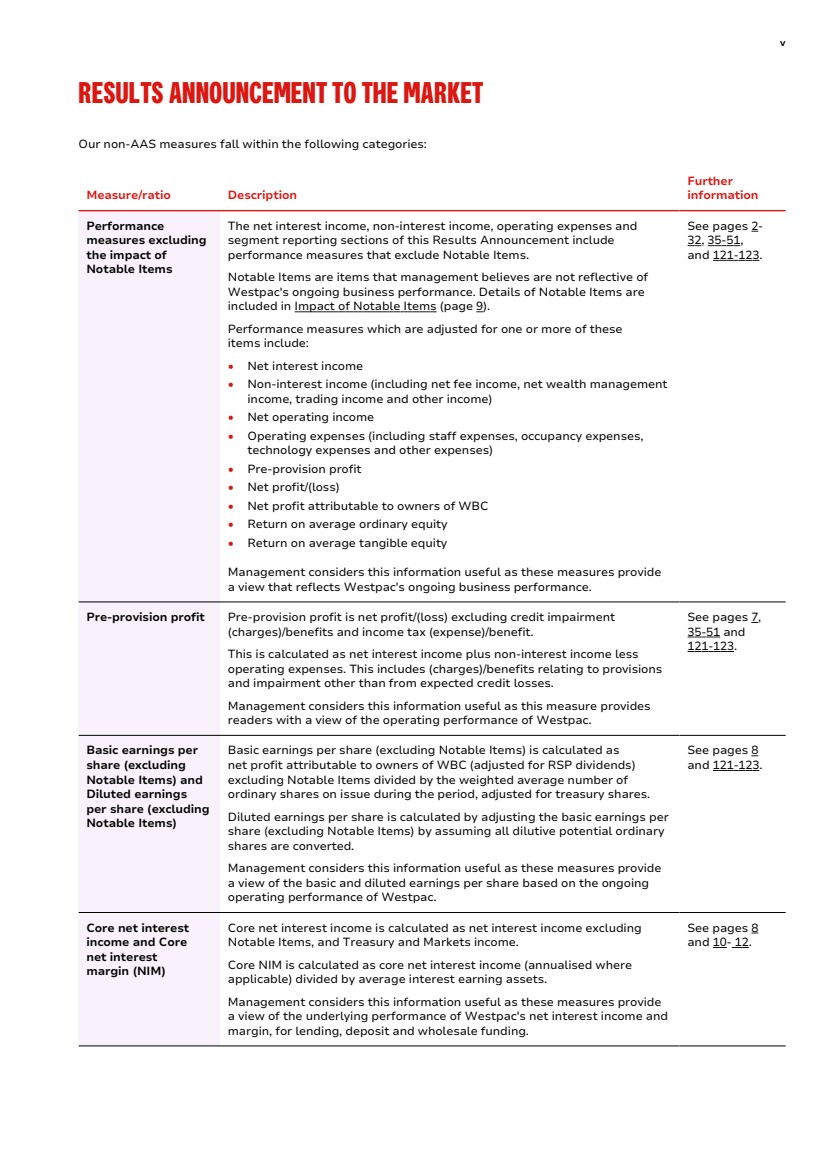
| v RESULTS ANNOUNCEMENT TO THE MARKET Our non-AAS measures fall within the following categories: Measure/ratio Description Further information Performance measures excluding the impact of Notable Items The net interest income, non-interest income, operating expenses and segment reporting sections of this Results Announcement include performance measures that exclude Notable Items. Notable Items are items that management believes are not reflective of Westpac's ongoing business performance. Details of Notable Items are included in Impact of Notable Items (page 9). Performance measures which are adjusted for one or more of these items include: • Net interest income • Non-interest income (including net fee income, net wealth management income, trading income and other income) • Net operating income • Operating expenses (including staff expenses, occupancy expenses, technology expenses and other expenses) • Pre-provision profit • Net profit/(loss) • Net profit attributable to owners of WBC • Return on average ordinary equity • Return on average tangible equity Management considers this information useful as these measures provide a view that reflects Westpac's ongoing business performance. See pages 2- 32, 35-51, and 121-123. Pre-provision profit Pre-provision profit is net profit/(loss) excluding credit impairment (charges)/benefits and income tax (expense)/benefit. This is calculated as net interest income plus non-interest income less operating expenses. This includes (charges)/benefits relating to provisions and impairment other than from expected credit losses. Management considers this information useful as this measure provides readers with a view of the operating performance of Westpac. See pages 7, 35-51 and 121-123. Basic earnings per share (excluding Notable Items) and Diluted earnings per share (excluding Notable Items) Basic earnings per share (excluding Notable Items) is calculated as net profit attributable to owners of WBC (adjusted for RSP dividends) excluding Notable Items divided by the weighted average number of ordinary shares on issue during the period, adjusted for treasury shares. Diluted earnings per share is calculated by adjusting the basic earnings per share (excluding Notable Items) by assuming all dilutive potential ordinary shares are converted. Management considers this information useful as these measures provide a view of the basic and diluted earnings per share based on the ongoing operating performance of Westpac. See pages 8 and 121-123. Core net interest income and Core net interest margin (NIM) Core net interest income is calculated as net interest income excluding Notable Items, and Treasury and Markets income. Core NIM is calculated as core net interest income (annualised where applicable) divided by average interest earning assets. Management considers this information useful as these measures provide a view of the underlying performance of Westpac's net interest income and margin, for lending, deposit and wholesale funding. See pages 8 and 10- 12. |
| vi WESTPAC GROUP 2025 INTERIM FINANCIAL RESULTS RESULTS ANNOUNCEMENT TO THE MARKET Measure/ratio Description Further information Dividend payout ratio (excluding Notable Items) Calculated as ordinary dividend paid/declared on issued shares (net of Treasury shares) divided by the net profit attributable to owners of WBC (adjusted for RSP dividends) excluding Notable Items. Management considers this information useful as it provides a view of the dividend payout ratio based on the ongoing operating performance of Westpac. See pages 8, 32 and 121- 123. Expense to income ratio (excluding Notable Items) Calculated as operating expenses excluding Notable Items divided by net operating income excluding Notable Items. Management considers this information useful as this measure provides a view of the efficiency of the ongoing operating performance of Westpac. See pages 8, 18-20 and 121-123. Average tangible ordinary equity and Return on average tangible ordinary equity (ROTE) Average tangible ordinary equity is calculated as average ordinary equity less average goodwill and other intangible assets (excluding capitalised software). Return on average tangible ordinary equity is calculated as net profit attributable to owners of WBC adjusted for RSP dividends (annualised where applicable) divided by average tangible ordinary equity. Management considers this information useful as these measures are commonly used as a performance measure by WBC, investors, analysts and others in assessing Westpac's application of equity. See pages 8 and 121-123. Presentation changes Certain comparative information has also been revised where appropriate to conform to changes in presentation in the current period to enhance comparability. This Results Announcement is unaudited KPMG has reviewed the financial statements and accompanying notes contained within the 2025 Interim Financial Report (pages 73-112) in this Results Announcement and has issued an unmodified review report. All other sections in this Results Announcement including the Directors’ Report (pages 53-72), have not been subject to review by KPMG. The financial information contained in this Results Announcement includes information extracted from the reviewed financial statements together with information that has not been reviewed. |
| PERFORMANCE REVIEW DIRECTORS’ REPORT 2025 INTERIM FINANCIAL REPORT OTHER INFORMATION 1 Contents PERFORMANCE REVIEW 2 Group performance 3 Segment reporting 35 DIRECTORS’ REPORT 52 Directors’ Report 53 2025 INTERIM FINANCIAL REPORT 73 Notes to the consolidated financial statements 79 Statutory statements 110 OTHER INFORMATION 113 Other information 114 Glossary 124 |
| 2 WESTPAC GROUP 2025 INTERIM FINANCIAL RESULTS PERFORMANCE REVIEW GROUP PERFORMANCE Performance overview Performance summary Key financial information Impact of Notable Items Review of earnings Credit quality Balance sheet and funding Capital and dividends Sustainability performance SEGMENT REPORTING Consumer Business & Wealth Westpac Institutional Bank (WIB) Westpac New Zealand Group Businesses |

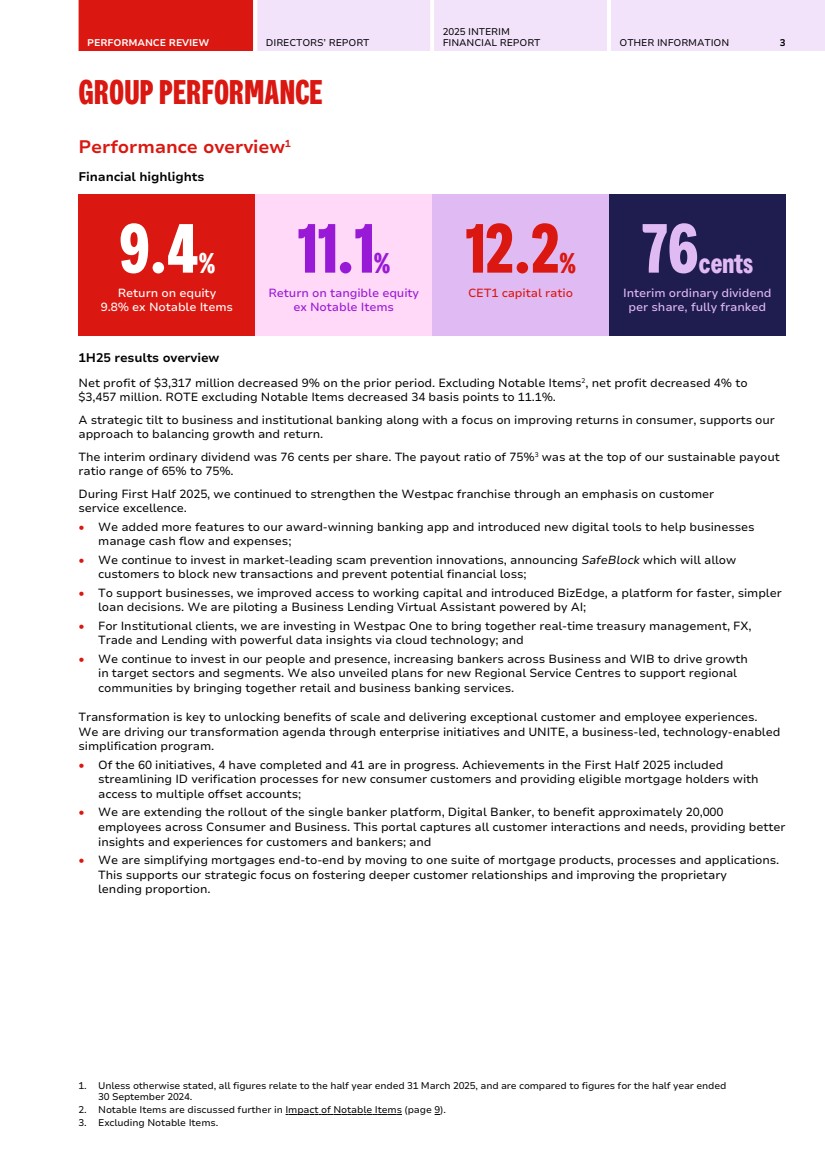
| PERFORMANCE REVIEW DIRECTORS’ REPORT 2025 INTERIM FINANCIAL REPORT OTHER INFORMATION 3 GROUP PERFORMANCE Performance overview1 Financial highlights 9.4% Return on equity 9.8% ex Notable Items 11.1% Return on tangible equity ex Notable Items 12.2% CET1 capital ratio 76cents Interim ordinary dividend per share, fully franked 1H25 results overview Net profit of $3,317 million decreased 9% on the prior period. Excluding Notable Items2 , net profit decreased 4% to $3,457 million. ROTE excluding Notable Items decreased 34 basis points to 11.1%. A strategic tilt to business and institutional banking along with a focus on improving returns in consumer, supports our approach to balancing growth and return. The interim ordinary dividend was 76 cents per share. The payout ratio of 75%3 was at the top of our sustainable payout ratio range of 65% to 75%. During First Half 2025, we continued to strengthen the Westpac franchise through an emphasis on customer service excellence. • We added more features to our award-winning banking app and introduced new digital tools to help businesses manage cash flow and expenses; • We continue to invest in market-leading scam prevention innovations, announcing SafeBlock which will allow customers to block new transactions and prevent potential financial loss; • To support businesses, we improved access to working capital and introduced BizEdge, a platform for faster, simpler loan decisions. We are piloting a Business Lending Virtual Assistant powered by AI; • For Institutional clients, we are investing in Westpac One to bring together real-time treasury management, FX, Trade and Lending with powerful data insights via cloud technology; and • We continue to invest in our people and presence, increasing bankers across Business and WIB to drive growth in target sectors and segments. We also unveiled plans for new Regional Service Centres to support regional communities by bringing together retail and business banking services. Transformation is key to unlocking benefits of scale and delivering exceptional customer and employee experiences. We are driving our transformation agenda through enterprise initiatives and UNITE, a business-led, technology-enabled simplification program. • Of the 60 initiatives, 4 have completed and 41 are in progress. Achievements in the First Half 2025 included streamlining ID verification processes for new consumer customers and providing eligible mortgage holders with access to multiple offset accounts; • We are extending the rollout of the single banker platform, Digital Banker, to benefit approximately 20,000 employees across Consumer and Business. This portal captures all customer interactions and needs, providing better insights and experiences for customers and bankers; and • We are simplifying mortgages end-to-end by moving to one suite of mortgage products, processes and applications. This supports our strategic focus on fostering deeper customer relationships and improving the proprietary lending proportion. 1. Unless otherwise stated, all figures relate to the half year ended 31 March 2025, and are compared to figures for the half year ended 30 September 2024. 2. Notable Items are discussed further in Impact of Notable Items (page 9). 3. Excluding Notable Items. |
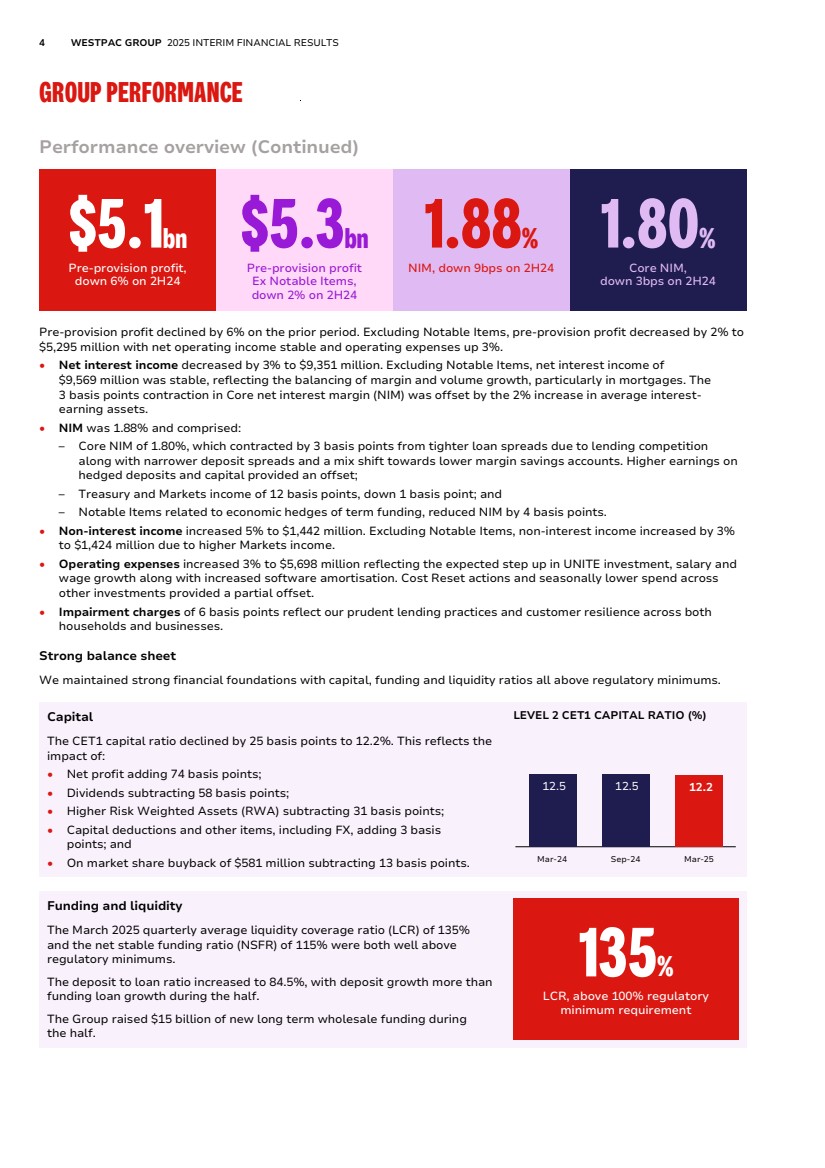
| 4 WESTPAC GROUP 2025 INTERIM FINANCIAL RESULTS GROUP PERFORMANCE Performance overview (Continued) $5.1bn Pre-provision profit, down 6% on 2H24 $5.3bn Pre-provision profit Ex Notable Items, down 2% on 2H24 1.88% NIM, down 9bps on 2H24 1.80% Core NIM, down 3bps on 2H24 Pre-provision profit declined by 6% on the prior period. Excluding Notable Items, pre-provision profit decreased by 2% to $5,295 million with net operating income stable and operating expenses up 3%. • Net interest income decreased by 3% to $9,351 million. Excluding Notable Items, net interest income of $9,569 million was stable, reflecting the balancing of margin and volume growth, particularly in mortgages. The 3 basis points contraction in Core net interest margin (NIM) was offset by the 2% increase in average interest-earning assets. • NIM was 1.88% and comprised: – Core NIM of 1.80%, which contracted by 3 basis points from tighter loan spreads due to lending competition along with narrower deposit spreads and a mix shift towards lower margin savings accounts. Higher earnings on hedged deposits and capital provided an offset; – Treasury and Markets income of 12 basis points, down 1 basis point; and – Notable Items related to economic hedges of term funding, reduced NIM by 4 basis points. • Non-interest income increased 5% to $1,442 million. Excluding Notable Items, non-interest income increased by 3% to $1,424 million due to higher Markets income. • Operating expenses increased 3% to $5,698 million reflecting the expected step up in UNITE investment, salary and wage growth along with increased software amortisation. Cost Reset actions and seasonally lower spend across other investments provided a partial offset. • Impairment charges of 6 basis points reflect our prudent lending practices and customer resilience across both households and businesses. Strong balance sheet We maintained strong financial foundations with capital, funding and liquidity ratios all above regulatory minimums. Capital The CET1 capital ratio declined by 25 basis points to 12.2%. This reflects the impact of: • Net profit adding 74 basis points; • Dividends subtracting 58 basis points; • Higher Risk Weighted Assets (RWA) subtracting 31 basis points; • Capital deductions and other items, including FX, adding 3 basis points; and • On market share buyback of $581 million subtracting 13 basis points. LEVEL 2 CET1 CAPITAL RATIO (%) 12.5 12.5 12.2 Mar-24 Sep-24 Mar-25 Funding and liquidity The March 2025 quarterly average liquidity coverage ratio (LCR) of 135% and the net stable funding ratio (NSFR) of 115% were both well above regulatory minimums. The deposit to loan ratio increased to 84.5%, with deposit growth more than funding loan growth during the half. The Group raised $15 billion of new long term wholesale funding during the half. 135% LCR, above 100% regulatory minimum requirement |
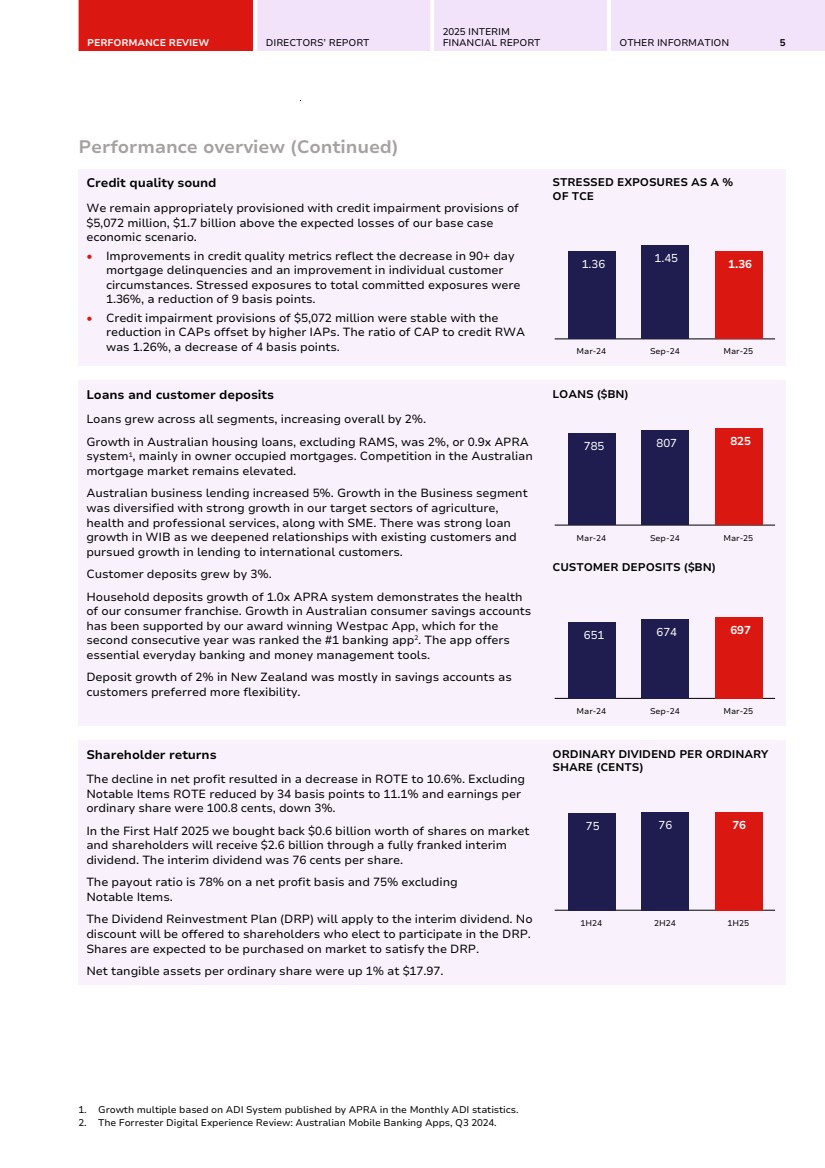
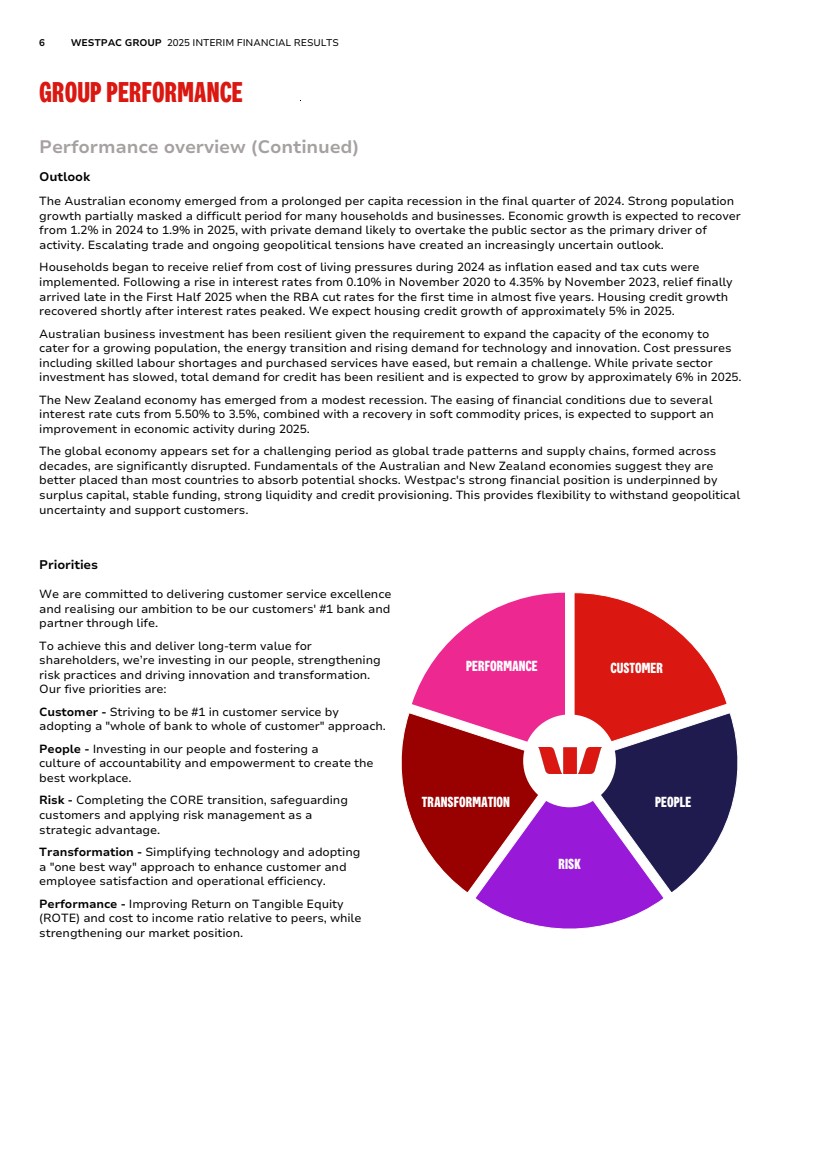
| PERFORMANCE REVIEW DIRECTORS’ REPORT 2025 INTERIM FINANCIAL REPORT OTHER INFORMATION 5 Performance overview (Continued) Credit quality sound We remain appropriately provisioned with credit impairment provisions of $5,072 million, $1.7 billion above the expected losses of our base case economic scenario. • Improvements in credit quality metrics reflect the decrease in 90+ day mortgage delinquencies and an improvement in individual customer circumstances. Stressed exposures to total committed exposures were 1.36%, a reduction of 9 basis points. • Credit impairment provisions of $5,072 million were stable with the reduction in CAPs offset by higher IAPs. The ratio of CAP to credit RWA was 1.26%, a decrease of 4 basis points. STRESSED EXPOSURES AS A % OF TCE 1.36 1.45 1.36 Mar-24 Sep-24 Mar-25 Loans and customer deposits Loans grew across all segments, increasing overall by 2%. Growth in Australian housing loans, excluding RAMS, was 2%, or 0.9x APRA system1 , mainly in owner occupied mortgages. Competition in the Australian mortgage market remains elevated. Australian business lending increased 5%. Growth in the Business segment was diversified with strong growth in our target sectors of agriculture, health and professional services, along with SME. There was strong loan growth in WIB as we deepened relationships with existing customers and pursued growth in lending to international customers. Customer deposits grew by 3%. Household deposits growth of 1.0x APRA system demonstrates the health of our consumer franchise. Growth in Australian consumer savings accounts has been supported by our award winning Westpac App, which for the second consecutive year was ranked the #1 banking app2 . The app offers essential everyday banking and money management tools. Deposit growth of 2% in New Zealand was mostly in savings accounts as customers preferred more flexibility. LOANS ($BN) 785 807 825 Mar-24 Sep-24 Mar-25 CUSTOMER DEPOSITS ($BN) 651 674 697 Mar-24 Sep-24 Mar-25 Shareholder returns The decline in net profit resulted in a decrease in ROTE to 10.6%. Excluding Notable Items ROTE reduced by 34 basis points to 11.1% and earnings per ordinary share were 100.8 cents, down 3%. In the First Half 2025 we bought back $0.6 billion worth of shares on market and shareholders will receive $2.6 billion through a fully franked interim dividend. The interim dividend was 76 cents per share. The payout ratio is 78% on a net profit basis and 75% excluding Notable Items. The Dividend Reinvestment Plan (DRP) will apply to the interim dividend. No discount will be offered to shareholders who elect to participate in the DRP. Shares are expected to be purchased on market to satisfy the DRP. Net tangible assets per ordinary share were up 1% at $17.97. ORDINARY DIVIDEND PER ORDINARY SHARE (CENTS) 75 76 76 1H24 2H24 1H25 1. Growth multiple based on ADI System published by APRA in the Monthly ADI statistics. 2. The Forrester Digital Experience Review: Australian Mobile Banking Apps, Q3 2024. |
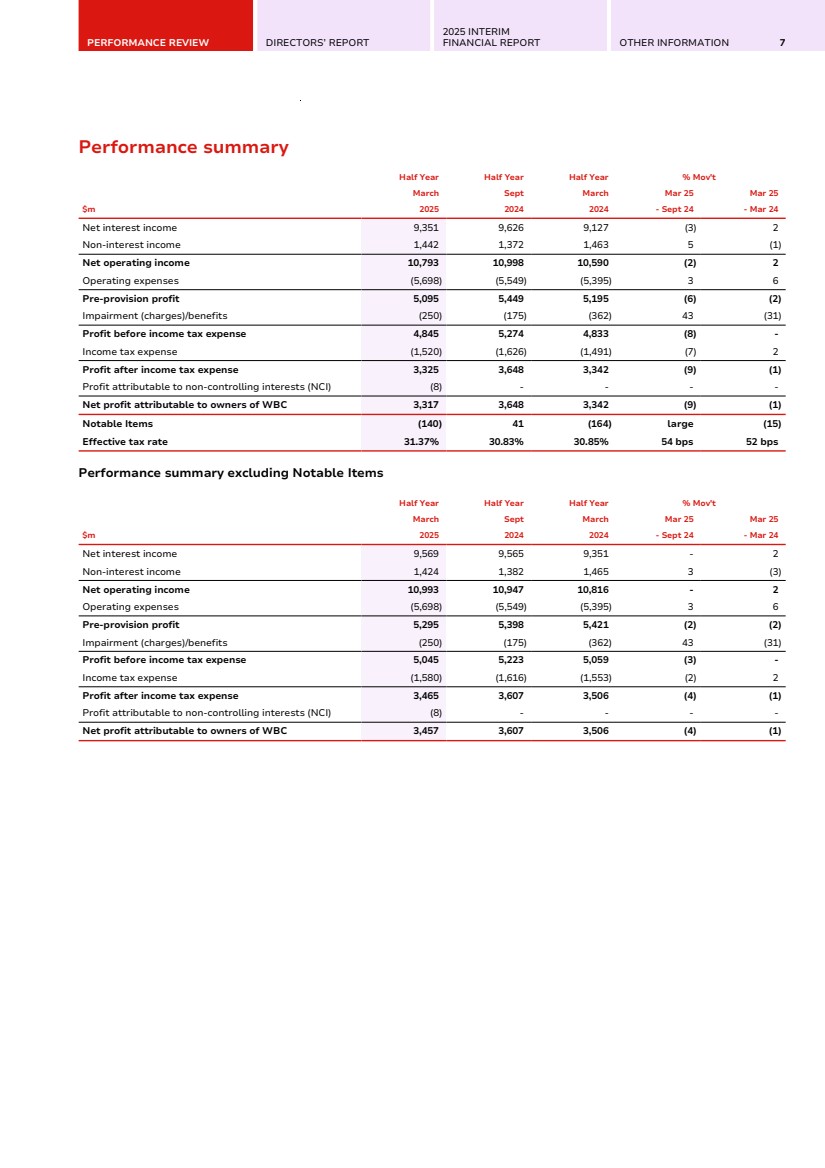
| 6 WESTPAC GROUP 2025 INTERIM FINANCIAL RESULTS GROUP PERFORMANCE Performance overview (Continued) Outlook The Australian economy emerged from a prolonged per capita recession in the final quarter of 2024. Strong population growth partially masked a difficult period for many households and businesses. Economic growth is expected to recover from 1.2% in 2024 to 1.9% in 2025, with private demand likely to overtake the public sector as the primary driver of activity. Escalating trade and ongoing geopolitical tensions have created an increasingly uncertain outlook. Households began to receive relief from cost of living pressures during 2024 as inflation eased and tax cuts were implemented. Following a rise in interest rates from 0.10% in November 2020 to 4.35% by November 2023, relief finally arrived late in the First Half 2025 when the RBA cut rates for the first time in almost five years. Housing credit growth recovered shortly after interest rates peaked. We expect housing credit growth of approximately 5% in 2025. Australian business investment has been resilient given the requirement to expand the capacity of the economy to cater for a growing population, the energy transition and rising demand for technology and innovation. Cost pressures including skilled labour shortages and purchased services have eased, but remain a challenge. While private sector investment has slowed, total demand for credit has been resilient and is expected to grow by approximately 6% in 2025. The New Zealand economy has emerged from a modest recession. The easing of financial conditions due to several interest rate cuts from 5.50% to 3.5%, combined with a recovery in soft commodity prices, is expected to support an improvement in economic activity during 2025. The global economy appears set for a challenging period as global trade patterns and supply chains, formed across decades, are significantly disrupted. Fundamentals of the Australian and New Zealand economies suggest they are better placed than most countries to absorb potential shocks. Westpac's strong financial position is underpinned by surplus capital, stable funding, strong liquidity and credit provisioning. This provides flexibility to withstand geopolitical uncertainty and support customers. Priorities We are committed to delivering customer service excellence and realising our ambition to be our customers' #1 bank and partner through life. To achieve this and deliver long-term value for shareholders, we’re investing in our people, strengthening risk practices and driving innovation and transformation. Our five priorities are: Customer - Striving to be #1 in customer service by adopting a "whole of bank to whole of customer" approach. People - Investing in our people and fostering a culture of accountability and empowerment to create the best workplace. Risk - Completing the CORE transition, safeguarding customers and applying risk management as a strategic advantage. Transformation - Simplifying technology and adopting a "one best way" approach to enhance customer and employee satisfaction and operational efficiency. Performance - Improving Return on Tangible Equity (ROTE) and cost to income ratio relative to peers, while strengthening our market position. PERFORMANCE CUSTOMER TRANSFORMATION PEOPLE RISK |
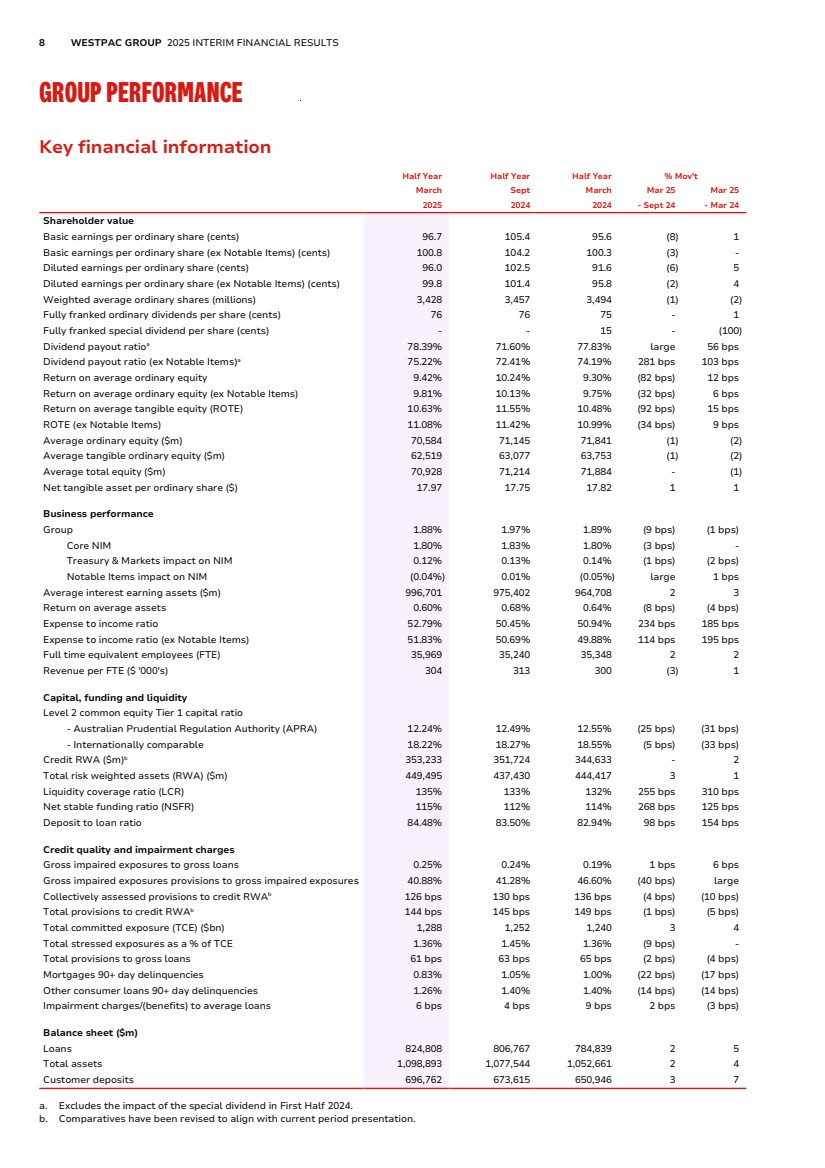
| PERFORMANCE REVIEW DIRECTORS’ REPORT 2025 INTERIM FINANCIAL REPORT OTHER INFORMATION 7 Performance summary Half Year Half Year Half Year % Mov't March Sept March Mar 25 Mar 25 $m 2025 2024 2024 - Sept 24 - Mar 24 Net interest income 9,351 9,626 9,127 (3) 2 Non-interest income 1,442 1,372 1,463 5 (1) Net operating income 10,793 10,998 10,590 (2) 2 Operating expenses (5,698) (5,549) (5,395) 3 6 Pre-provision profit 5,095 5,449 5,195 (6) (2) Impairment (charges)/benefits (250) (175) (362) 43 (31) Profit before income tax expense 4,845 5,274 4,833 (8) - Income tax expense (1,520) (1,626) (1,491) (7) 2 Profit after income tax expense 3,325 3,648 3,342 (9) (1) Profit attributable to non-controlling interests (NCI) (8) - - - - Net profit attributable to owners of WBC 3,317 3,648 3,342 (9) (1) Notable Items (140) 41 (164) large (15) Effective tax rate 31.37% 30.83% 30.85% 54 bps 52 bps Performance summary excluding Notable Items Half Year Half Year Half Year % Mov't March Sept March Mar 25 Mar 25 $m 2025 2024 2024 - Sept 24 - Mar 24 Net interest income 9,569 9,565 9,351 - 2 Non-interest income 1,424 1,382 1,465 3 (3) Net operating income 10,993 10,947 10,816 - 2 Operating expenses (5,698) (5,549) (5,395) 3 6 Pre-provision profit 5,295 5,398 5,421 (2) (2) Impairment (charges)/benefits (250) (175) (362) 43 (31) Profit before income tax expense 5,045 5,223 5,059 (3) - Income tax expense (1,580) (1,616) (1,553) (2) 2 Profit after income tax expense 3,465 3,607 3,506 (4) (1) Profit attributable to non-controlling interests (NCI) (8) - - - - Net profit attributable to owners of WBC 3,457 3,607 3,506 (4) (1) |
| 8 WESTPAC GROUP 2025 INTERIM FINANCIAL RESULTS GROUP PERFORMANCE Key financial information Half Year Half Year Half Year % Mov't March Sept March Mar 25 Mar 25 2025 2024 2024 - Sept 24 - Mar 24 Shareholder value Basic earnings per ordinary share (cents) 96.7 105.4 95.6 (8) 1 Basic earnings per ordinary share (ex Notable Items) (cents) 100.8 104.2 100.3 (3) - Diluted earnings per ordinary share (cents) 96.0 102.5 91.6 (6) 5 Diluted earnings per ordinary share (ex Notable Items) (cents) 99.8 101.4 95.8 (2) 4 Weighted average ordinary shares (millions) 3,428 3,457 3,494 (1) (2) Fully franked ordinary dividends per share (cents) 76 76 75 - 1 Fully franked special dividend per share (cents) - - 15 - (100) Dividend payout ratioa 78.39% 71.60% 77.83% large 56 bps Dividend payout ratio (ex Notable Items)a 75.22% 72.41% 74.19% 281 bps 103 bps Return on average ordinary equity 9.42% 10.24% 9.30% (82 bps) 12 bps Return on average ordinary equity (ex Notable Items) 9.81% 10.13% 9.75% (32 bps) 6 bps Return on average tangible equity (ROTE) 10.63% 11.55% 10.48% (92 bps) 15 bps ROTE (ex Notable Items) 11.08% 11.42% 10.99% (34 bps) 9 bps Average ordinary equity ($m) 70,584 71,145 71,841 (1) (2) Average tangible ordinary equity ($m) 62,519 63,077 63,753 (1) (2) Average total equity ($m) 70,928 71,214 71,884 - (1) Net tangible asset per ordinary share ($) 17.97 17.75 17.82 1 1 Business performance Group 1.88% 1.97% 1.89% (9 bps) (1 bps) Core NIM 1.80% 1.83% 1.80% (3 bps) - Treasury & Markets impact on NIM 0.12% 0.13% 0.14% (1 bps) (2 bps) Notable Items impact on NIM (0.04%) 0.01% (0.05%) large 1 bps Average interest earning assets ($m) 996,701 975,402 964,708 2 3 Return on average assets 0.60% 0.68% 0.64% (8 bps) (4 bps) Expense to income ratio 52.79% 50.45% 50.94% 234 bps 185 bps Expense to income ratio (ex Notable Items) 51.83% 50.69% 49.88% 114 bps 195 bps Full time equivalent employees (FTE) 35,969 35,240 35,348 2 2 Revenue per FTE ($ '000's) 304 313 300 (3) 1 Capital, funding and liquidity Level 2 common equity Tier 1 capital ratio - Australian Prudential Regulation Authority (APRA) 12.24% 12.49% 12.55% (25 bps) (31 bps) - Internationally comparable 18.22% 18.27% 18.55% (5 bps) (33 bps) Credit RWA ($m)b 353,233 351,724 344,633 - 2 Total risk weighted assets (RWA) ($m) 449,495 437,430 444,417 3 1 Liquidity coverage ratio (LCR) 135% 133% 132% 255 bps 310 bps Net stable funding ratio (NSFR) 115% 112% 114% 268 bps 125 bps Deposit to loan ratio 84.48% 83.50% 82.94% 98 bps 154 bps Credit quality and impairment charges Gross impaired exposures to gross loans 0.25% 0.24% 0.19% 1 bps 6 bps Gross impaired exposures provisions to gross impaired exposures 40.88% 41.28% 46.60% (40 bps) large Collectively assessed provisions to credit RWAb 126 bps 130 bps 136 bps (4 bps) (10 bps) Total provisions to credit RWAb 144 bps 145 bps 149 bps (1 bps) (5 bps) Total committed exposure (TCE) ($bn) 1,288 1,252 1,240 3 4 Total stressed exposures as a % of TCE 1.36% 1.45% 1.36% (9 bps) - Total provisions to gross loans 61 bps 63 bps 65 bps (2 bps) (4 bps) Mortgages 90+ day delinquencies 0.83% 1.05% 1.00% (22 bps) (17 bps) Other consumer loans 90+ day delinquencies 1.26% 1.40% 1.40% (14 bps) (14 bps) Impairment charges/(benefits) to average loans 6 bps 4 bps 9 bps 2 bps (3 bps) Balance sheet ($m) Loans 824,808 806,767 784,839 2 5 Total assets 1,098,893 1,077,544 1,052,661 2 4 Customer deposits 696,762 673,615 650,946 3 7 a. Excludes the impact of the special dividend in First Half 2024. b. Comparatives have been revised to align with current period presentation. |
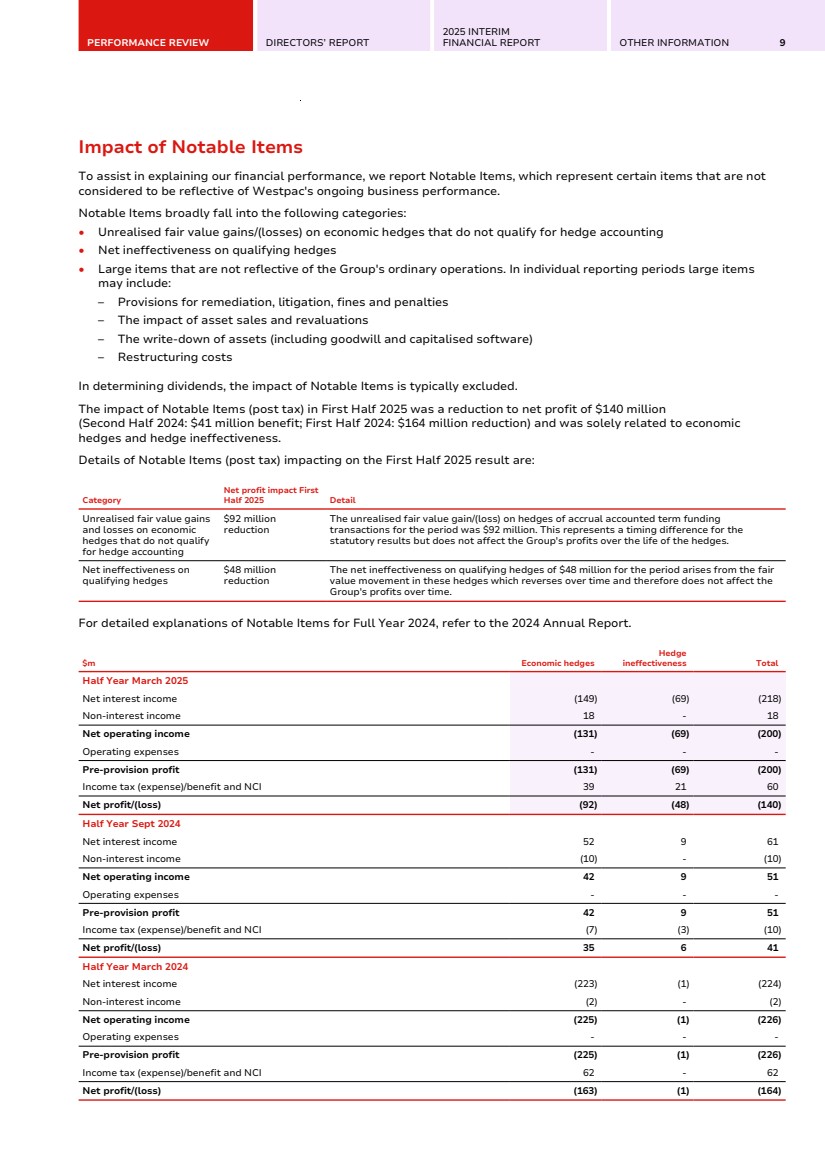
| PERFORMANCE REVIEW DIRECTORS’ REPORT 2025 INTERIM FINANCIAL REPORT OTHER INFORMATION 9 Impact of Notable Items To assist in explaining our financial performance, we report Notable Items, which represent certain items that are not considered to be reflective of Westpac's ongoing business performance. Notable Items broadly fall into the following categories: • Unrealised fair value gains/(losses) on economic hedges that do not qualify for hedge accounting • Net ineffectiveness on qualifying hedges • Large items that are not reflective of the Group's ordinary operations. In individual reporting periods large items may include: – Provisions for remediation, litigation, fines and penalties – The impact of asset sales and revaluations – The write-down of assets (including goodwill and capitalised software) – Restructuring costs In determining dividends, the impact of Notable Items is typically excluded. The impact of Notable Items (post tax) in First Half 2025 was a reduction to net profit of $140 million (Second Half 2024: $41 million benefit; First Half 2024: $164 million reduction) and was solely related to economic hedges and hedge ineffectiveness. Details of Notable Items (post tax) impacting on the First Half 2025 result are: Category Net profit impact First Half 2025 Detail Unrealised fair value gains and losses on economic hedges that do not qualify for hedge accounting $92 million reduction The unrealised fair value gain/(loss) on hedges of accrual accounted term funding transactions for the period was $92 million. This represents a timing difference for the statutory results but does not affect the Group's profits over the life of the hedges. Net ineffectiveness on qualifying hedges $48 million reduction The net ineffectiveness on qualifying hedges of $48 million for the period arises from the fair value movement in these hedges which reverses over time and therefore does not affect the Group's profits over time. For detailed explanations of Notable Items for Full Year 2024, refer to the 2024 Annual Report. $m Economic hedges Hedge ineffectiveness Total Half Year March 2025 Net interest income (149) (69) (218) Non-interest income 18 - 18 Net operating income (131) (69) (200) Operating expenses - - - Pre-provision profit (131) (69) (200) Income tax (expense)/benefit and NCI 39 21 60 Net profit/(loss) (92) (48) (140) Half Year Sept 2024 Net interest income 52 9 61 Non-interest income (10) - (10) Net operating income 42 9 51 Operating expenses - - - Pre-provision profit 42 9 51 Income tax (expense)/benefit and NCI (7) (3) (10) Net profit/(loss) 35 6 41 Half Year March 2024 Net interest income (223) (1) (224) Non-interest income (2) - (2) Net operating income (225) (1) (226) Operating expenses - - - Pre-provision profit (225) (1) (226) Income tax (expense)/benefit and NCI 62 - 62 Net profit/(loss) (163) (1) (164) |
| 10 WESTPAC GROUP 2025 INTERIM FINANCIAL RESULTS GROUP PERFORMANCE Review of earnings Net interest income Half Year Half Year Half Year % Mov't March Sept March Mar 25 Mar 25 2025 2024 2024 - Sept 24 - Mar 24 Net interest Income ($m) Net interest income 9,351 9,626 9,127 (3) 2 Core net interest income 8,960 8,940 8,668 - 3 Notable Items (218) 61 (224) large (3) Treasurya 495 496 560 - (12) Markets 114 129 123 (12) (7) Average interest earning assets ($m) Loans 755,530 739,728 725,592 2 4 Housingb 505,748 504,205 496,471 - 2 Personal 10,900 11,423 12,085 (5) (10) Business 238,882 224,100 217,036 7 10 Liquid assets 209,408 204,192 208,340 3 1 Other interest-earning assets 31,763 31,482 30,776 1 3 Average interest earning assets 996,701 975,402 964,708 2 3 NIM (%) NIM 1.88% 1.97% 1.89% (9 bps) (1 bps) Core NIM 1.80% 1.83% 1.80% (3 bps) - Treasury & Markets impact on NIM 0.12% 0.13% 0.14% (1 bps) (2 bps) Notable Items impact on NIM (0.04%) 0.01% (0.05%) large 1 bps a. Treasury net interest income excludes capital benefit. b. Net of average mortgage offset balances. First Half 2025 – Second Half 2024 Net interest income decreased 3% to $9,351 million. Key drivers included: • Stable core net interest income of $8,960 million, with balance sheet growth largely offset by a lower net interest margin; • Treasury and Markets income, down 3% to $609 million due to stable Treasury income and a 12% reduction in Markets income; and • Notable Items reduced income by $218 million compared to an increase of $61 million in the prior period. Average interest-earning assets increased by 2% to $996.7 billion, including growth of 7% in business loans and a 3% increase in liquid assets. This was partially offset by the reduction in personal loans, the runoff of RAMS housing loans and the runoff and subsequent sale of the auto finance portfolio. Average housing loans were stable. Excluding RAMS, average housing loans were up 1%. First Half 2025 – First Half 2024 Net interest income increased 2% to $9,351 million. Key drivers included: • Higher core net interest income, up 3% to $8,960 million due to balance sheet growth as net interest margin was flat; • Treasury and Markets income, down 11% to $609 million due to stronger Treasury performance in the prior corresponding period from interest rate positioning; and • Notable Items reduced income by $218 million compared to a reduction of $224 million in the prior corresponding period. Average interest-earning assets increased by 3% to $996.7 billion. Growth in average loans of 4% reflects 10% growth in business loans and 2% growth in housing. This was partially offset by the reduction in personal loans, the runoff of RAMS housing loans and the runoff and subsequent sale of the auto finance portfolio. Average liquid assets increased by 1% while other interest-earning assets grew by 3% due to increased holdings of trading securities, to facilitate client activity. |

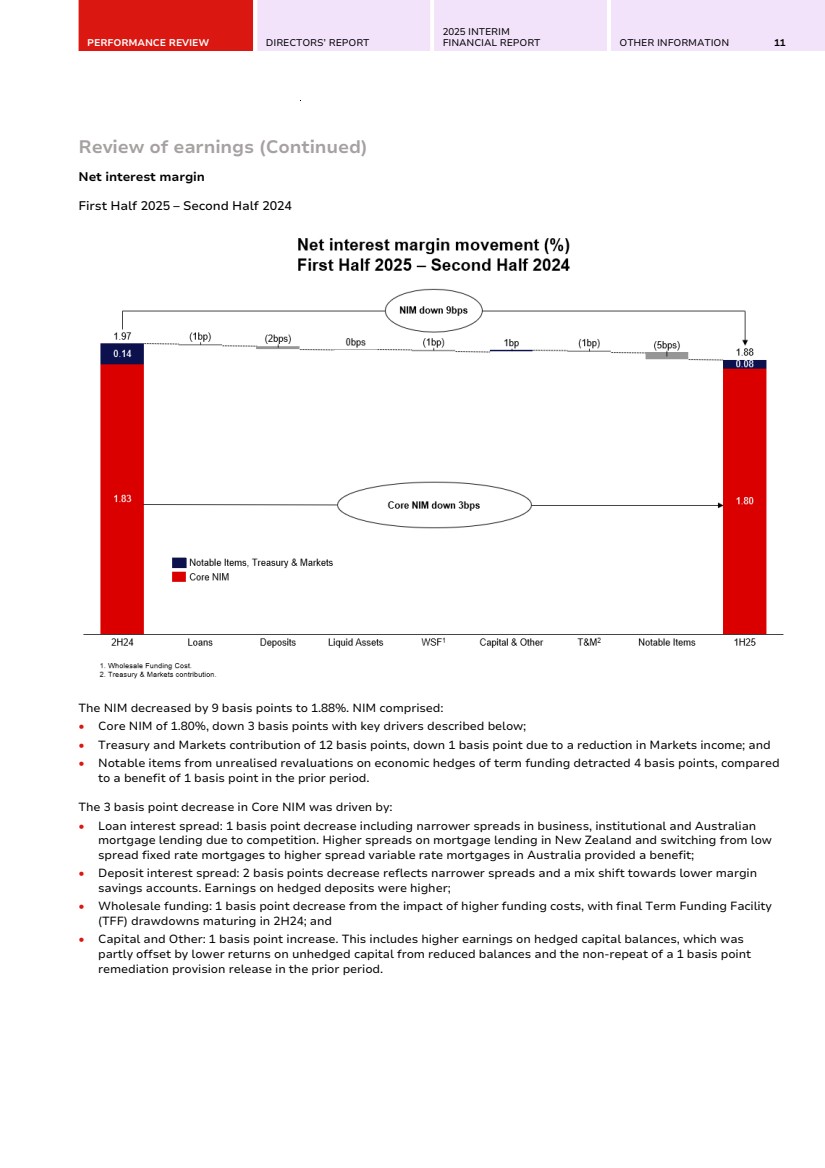
| PERFORMANCE REVIEW DIRECTORS’ REPORT 2025 INTERIM FINANCIAL REPORT OTHER INFORMATION 11 Review of earnings (Continued) Net interest margin First Half 2025 – Second Half 2024 The NIM decreased by 9 basis points to 1.88%. NIM comprised: • Core NIM of 1.80%, down 3 basis points with key drivers described below; • Treasury and Markets contribution of 12 basis points, down 1 basis point due to a reduction in Markets income; and • Notable items from unrealised revaluations on economic hedges of term funding detracted 4 basis points, compared to a benefit of 1 basis point in the prior period. The 3 basis point decrease in Core NIM was driven by: • Loan interest spread: 1 basis point decrease including narrower spreads in business, institutional and Australian mortgage lending due to competition. Higher spreads on mortgage lending in New Zealand and switching from low spread fixed rate mortgages to higher spread variable rate mortgages in Australia provided a benefit; • Deposit interest spread: 2 basis points decrease reflects narrower spreads and a mix shift towards lower margin savings accounts. Earnings on hedged deposits were higher; • Wholesale funding: 1 basis point decrease from the impact of higher funding costs, with final Term Funding Facility (TFF) drawdowns maturing in 2H24; and • Capital and Other: 1 basis point increase. This includes higher earnings on hedged capital balances, which was partly offset by lower returns on unhedged capital from reduced balances and the non-repeat of a 1 basis point remediation provision release in the prior period. |
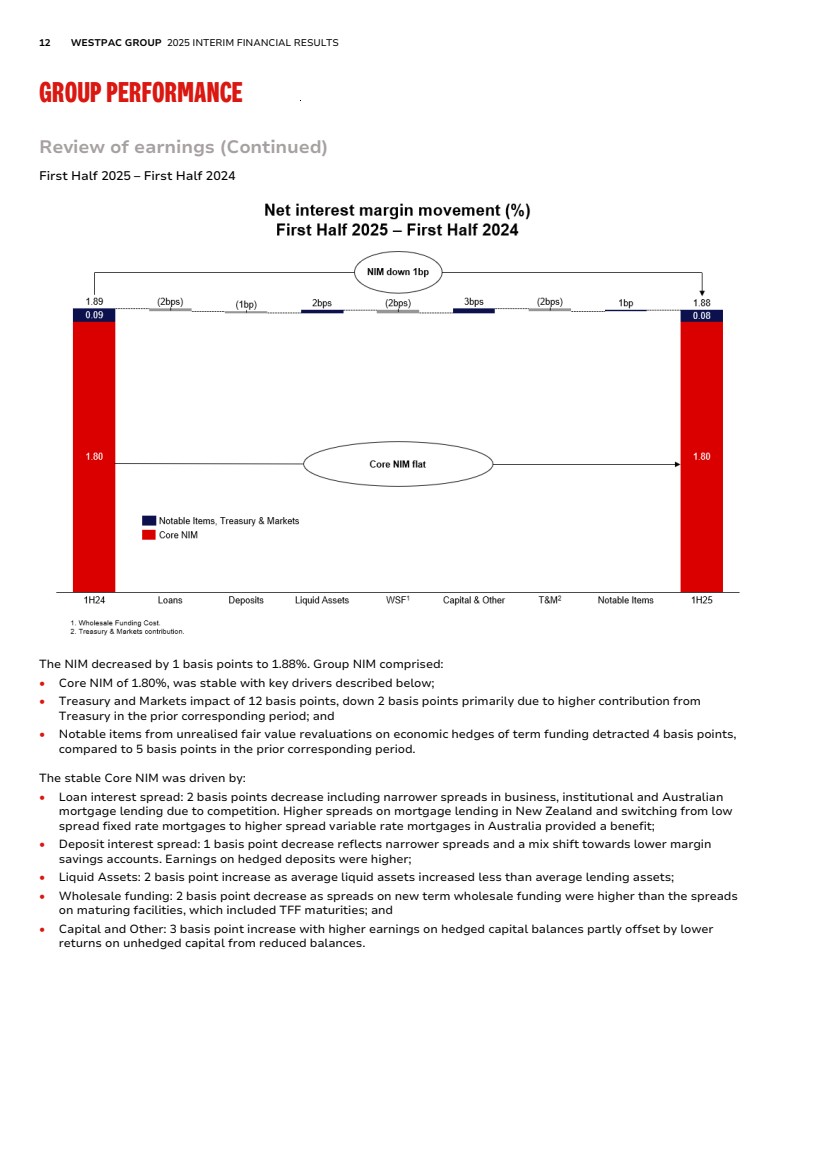
| 12 WESTPAC GROUP 2025 INTERIM FINANCIAL RESULTS GROUP PERFORMANCE Review of earnings (Continued) First Half 2025 – First Half 2024 The NIM decreased by 1 basis points to 1.88%. Group NIM comprised: • Core NIM of 1.80%, was stable with key drivers described below; • Treasury and Markets impact of 12 basis points, down 2 basis points primarily due to higher contribution from Treasury in the prior corresponding period; and • Notable items from unrealised fair value revaluations on economic hedges of term funding detracted 4 basis points, compared to 5 basis points in the prior corresponding period. The stable Core NIM was driven by: • Loan interest spread: 2 basis points decrease including narrower spreads in business, institutional and Australian mortgage lending due to competition. Higher spreads on mortgage lending in New Zealand and switching from low spread fixed rate mortgages to higher spread variable rate mortgages in Australia provided a benefit; • Deposit interest spread: 1 basis point decrease reflects narrower spreads and a mix shift towards lower margin savings accounts. Earnings on hedged deposits were higher; • Liquid Assets: 2 basis point increase as average liquid assets increased less than average lending assets; • Wholesale funding: 2 basis point decrease as spreads on new term wholesale funding were higher than the spreads on maturing facilities, which included TFF maturities; and • Capital and Other: 3 basis point increase with higher earnings on hedged capital balances partly offset by lower returns on unhedged capital from reduced balances. |
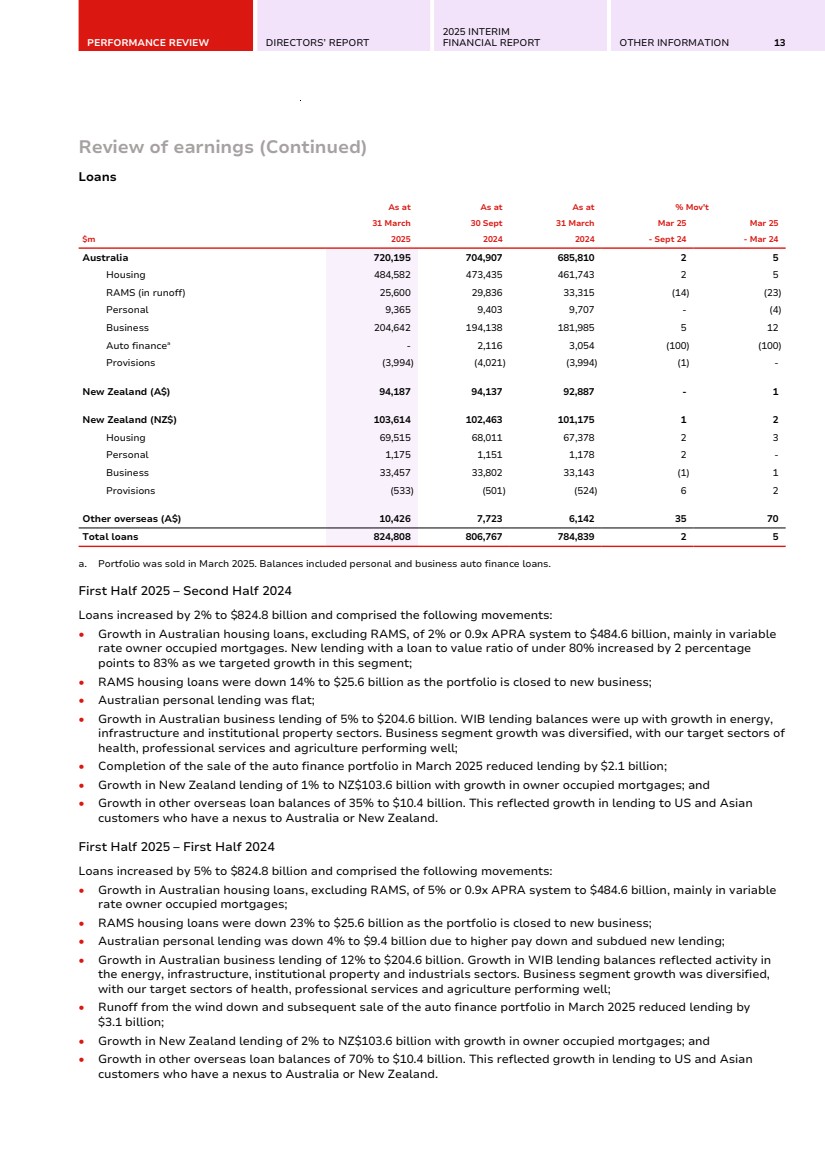
| PERFORMANCE REVIEW DIRECTORS’ REPORT 2025 INTERIM FINANCIAL REPORT OTHER INFORMATION 13 Review of earnings (Continued) Loans As at As at As at % Mov't 31 March 30 Sept 31 March Mar 25 Mar 25 $m 2025 2024 2024 - Sept 24 - Mar 24 Australia 720,195 704,907 685,810 2 5 Housing 484,582 473,435 461,743 2 5 RAMS (in runoff) 25,600 29,836 33,315 (14) (23) Personal 9,365 9,403 9,707 - (4) Business 204,642 194,138 181,985 5 12 Auto financea - 2,116 3,054 (100) (100) Provisions (3,994) (4,021) (3,994) (1) - New Zealand (A$) 94,187 94,137 92,887 - 1 New Zealand (NZ$) 103,614 102,463 101,175 1 2 Housing 69,515 68,011 67,378 2 3 Personal 1,175 1,151 1,178 2 - Business 33,457 33,802 33,143 (1) 1 Provisions (533) (501) (524) 6 2 Other overseas (A$) 10,426 7,723 6,142 35 70 Total loans 824,808 806,767 784,839 2 5 a. Portfolio was sold in March 2025. Balances included personal and business auto finance loans. First Half 2025 – Second Half 2024 Loans increased by 2% to $824.8 billion and comprised the following movements: • Growth in Australian housing loans, excluding RAMS, of 2% or 0.9x APRA system to $484.6 billion, mainly in variable rate owner occupied mortgages. New lending with a loan to value ratio of under 80% increased by 2 percentage points to 83% as we targeted growth in this segment; • RAMS housing loans were down 14% to $25.6 billion as the portfolio is closed to new business; • Australian personal lending was flat; • Growth in Australian business lending of 5% to $204.6 billion. WIB lending balances were up with growth in energy, infrastructure and institutional property sectors. Business segment growth was diversified, with our target sectors of health, professional services and agriculture performing well; • Completion of the sale of the auto finance portfolio in March 2025 reduced lending by $2.1 billion; • Growth in New Zealand lending of 1% to NZ$103.6 billion with growth in owner occupied mortgages; and • Growth in other overseas loan balances of 35% to $10.4 billion. This reflected growth in lending to US and Asian customers who have a nexus to Australia or New Zealand. First Half 2025 – First Half 2024 Loans increased by 5% to $824.8 billion and comprised the following movements: • Growth in Australian housing loans, excluding RAMS, of 5% or 0.9x APRA system to $484.6 billion, mainly in variable rate owner occupied mortgages; • RAMS housing loans were down 23% to $25.6 billion as the portfolio is closed to new business; • Australian personal lending was down 4% to $9.4 billion due to higher pay down and subdued new lending; • Growth in Australian business lending of 12% to $204.6 billion. Growth in WIB lending balances reflected activity in the energy, infrastructure, institutional property and industrials sectors. Business segment growth was diversified, with our target sectors of health, professional services and agriculture performing well; • Runoff from the wind down and subsequent sale of the auto finance portfolio in March 2025 reduced lending by $3.1 billion; • Growth in New Zealand lending of 2% to NZ$103.6 billion with growth in owner occupied mortgages; and • Growth in other overseas loan balances of 70% to $10.4 billion. This reflected growth in lending to US and Asian customers who have a nexus to Australia or New Zealand. |
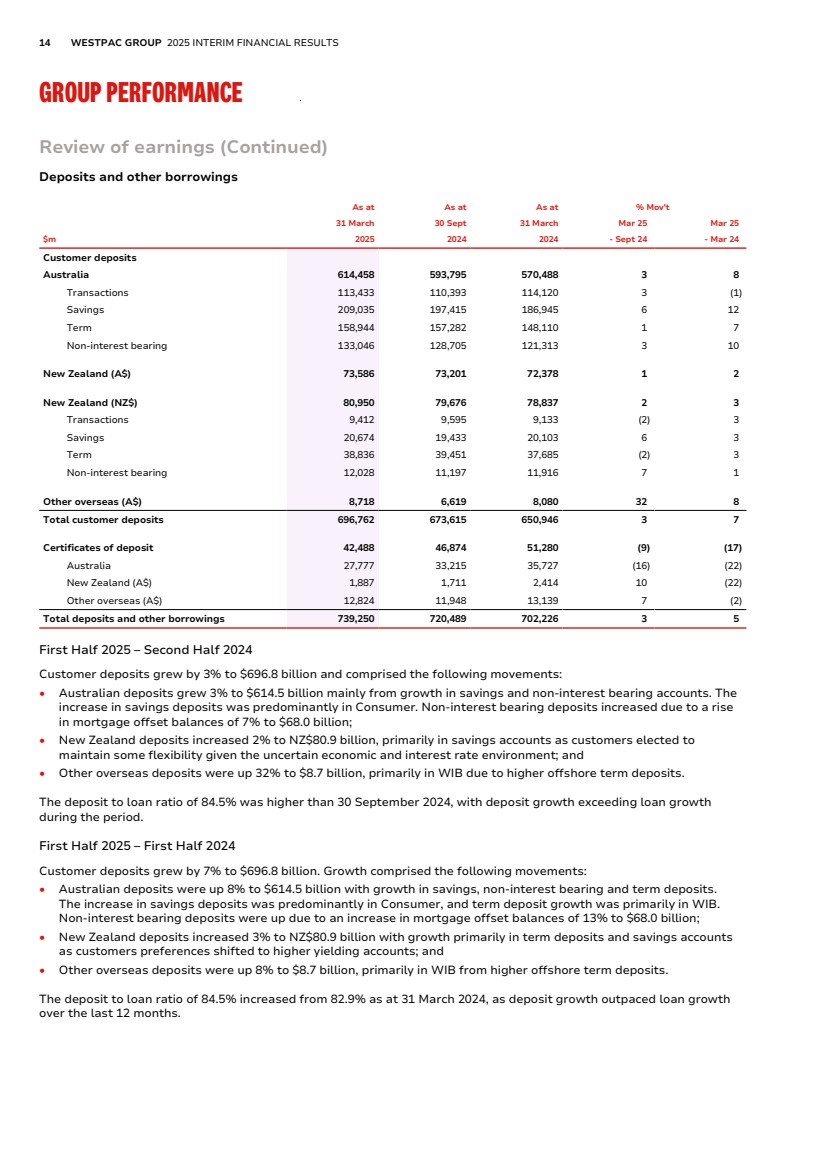
| 14 WESTPAC GROUP 2025 INTERIM FINANCIAL RESULTS GROUP PERFORMANCE Review of earnings (Continued) Deposits and other borrowings As at As at As at % Mov't 31 March 30 Sept 31 March Mar 25 Mar 25 $m 2025 2024 2024 - Sept 24 - Mar 24 Customer deposits Australia 614,458 593,795 570,488 3 8 Transactions 113,433 110,393 114,120 3 (1) Savings 209,035 197,415 186,945 6 12 Term 158,944 157,282 148,110 1 7 Non-interest bearing 133,046 128,705 121,313 3 10 New Zealand (A$) 73,586 73,201 72,378 1 2 New Zealand (NZ$) 80,950 79,676 78,837 2 3 Transactions 9,412 9,595 9,133 (2) 3 Savings 20,674 19,433 20,103 6 3 Term 38,836 39,451 37,685 (2) 3 Non-interest bearing 12,028 11,197 11,916 7 1 Other overseas (A$) 8,718 6,619 8,080 32 8 Total customer deposits 696,762 673,615 650,946 3 7 Certificates of deposit 42,488 46,874 51,280 (9) (17) Australia 27,777 33,215 35,727 (16) (22) New Zealand (A$) 1,887 1,711 2,414 10 (22) Other overseas (A$) 12,824 11,948 13,139 7 (2) Total deposits and other borrowings 739,250 720,489 702,226 3 5 First Half 2025 – Second Half 2024 Customer deposits grew by 3% to $696.8 billion and comprised the following movements: • Australian deposits grew 3% to $614.5 billion mainly from growth in savings and non-interest bearing accounts. The increase in savings deposits was predominantly in Consumer. Non-interest bearing deposits increased due to a rise in mortgage offset balances of 7% to $68.0 billion; • New Zealand deposits increased 2% to NZ$80.9 billion, primarily in savings accounts as customers elected to maintain some flexibility given the uncertain economic and interest rate environment; and • Other overseas deposits were up 32% to $8.7 billion, primarily in WIB due to higher offshore term deposits. The deposit to loan ratio of 84.5% was higher than 30 September 2024, with deposit growth exceeding loan growth during the period. First Half 2025 – First Half 2024 Customer deposits grew by 7% to $696.8 billion. Growth comprised the following movements: • Australian deposits were up 8% to $614.5 billion with growth in savings, non-interest bearing and term deposits. The increase in savings deposits was predominantly in Consumer, and term deposit growth was primarily in WIB. Non-interest bearing deposits were up due to an increase in mortgage offset balances of 13% to $68.0 billion; • New Zealand deposits increased 3% to NZ$80.9 billion with growth primarily in term deposits and savings accounts as customers preferences shifted to higher yielding accounts; and • Other overseas deposits were up 8% to $8.7 billion, primarily in WIB from higher offshore term deposits. The deposit to loan ratio of 84.5% increased from 82.9% as at 31 March 2024, as deposit growth outpaced loan growth over the last 12 months. |
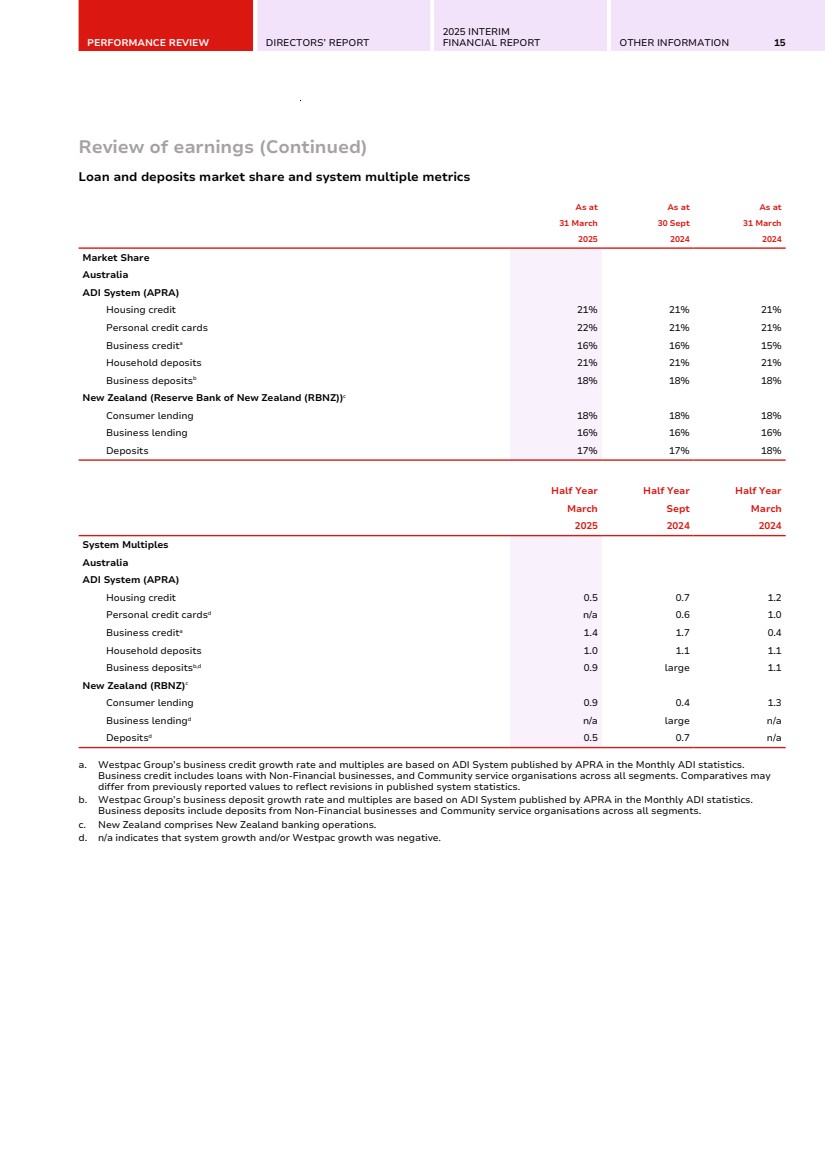
| PERFORMANCE REVIEW DIRECTORS’ REPORT 2025 INTERIM FINANCIAL REPORT OTHER INFORMATION 15 Review of earnings (Continued) Loan and deposits market share and system multiple metrics As at As at As at 31 March 30 Sept 31 March 2025 2024 2024 Market Share Australia ADI System (APRA) Housing credit 21% 21% 21% Personal credit cards 22% 21% 21% Business credita 16% 16% 15% Household deposits 21% 21% 21% Business depositsb 18% 18% 18% New Zealand (Reserve Bank of New Zealand (RBNZ))c Consumer lending 18% 18% 18% Business lending 16% 16% 16% Deposits 17% 17% 18% Half Year Half Year Half Year March Sept March 2025 2024 2024 System Multiples Australia ADI System (APRA) Housing credit 0.5 0.7 1.2 Personal credit cardsd n/a 0.6 1.0 Business credita 1.4 1.7 0.4 Household deposits 1.0 1.1 1.1 Business depositsb,d 0.9 large 1.1 New Zealand (RBNZ)c Consumer lending 0.9 0.4 1.3 Business lendingd n/a large n/a Depositsd 0.5 0.7 n/a a. Westpac Group’s business credit growth rate and multiples are based on ADI System published by APRA in the Monthly ADI statistics. Business credit includes loans with Non-Financial businesses, and Community service organisations across all segments. Comparatives may differ from previously reported values to reflect revisions in published system statistics. b. Westpac Group’s business deposit growth rate and multiples are based on ADI System published by APRA in the Monthly ADI statistics. Business deposits include deposits from Non-Financial businesses and Community service organisations across all segments. c. New Zealand comprises New Zealand banking operations. d. n/a indicates that system growth and/or Westpac growth was negative. |
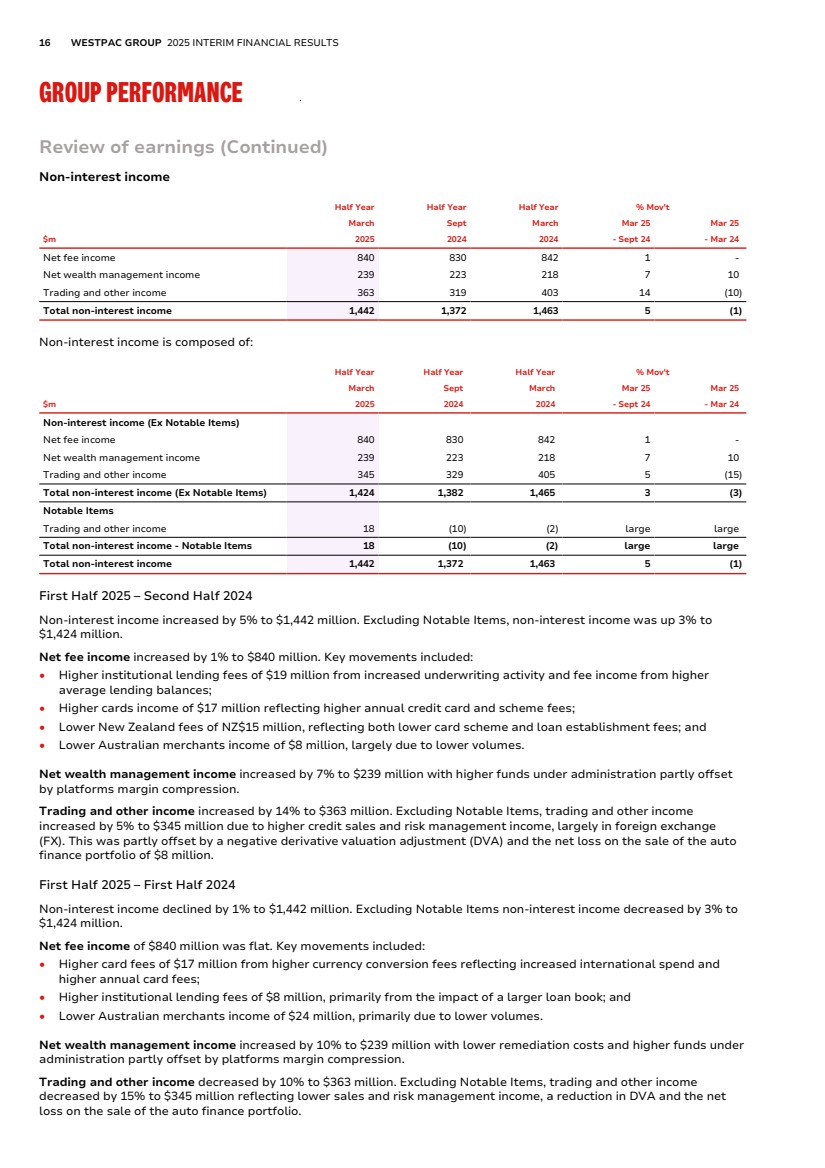
| 16 WESTPAC GROUP 2025 INTERIM FINANCIAL RESULTS GROUP PERFORMANCE Review of earnings (Continued) Non-interest income Half Year Half Year Half Year % Mov't March Sept March Mar 25 Mar 25 $m 2025 2024 2024 - Sept 24 - Mar 24 Net fee income 840 830 842 1 - Net wealth management income 239 223 218 7 10 Trading and other income 363 319 403 14 (10) Total non-interest income 1,442 1,372 1,463 5 (1) Non-interest income is composed of: Half Year Half Year Half Year % Mov't March Sept March Mar 25 Mar 25 $m 2025 2024 2024 - Sept 24 - Mar 24 Non-interest income (Ex Notable Items) Net fee income 840 830 842 1 - Net wealth management income 239 223 218 7 10 Trading and other income 345 329 405 5 (15) Total non-interest income (Ex Notable Items) 1,424 1,382 1,465 3 (3) Notable Items Trading and other income 18 (10) (2) large large Total non-interest income - Notable Items 18 (10) (2) large large Total non-interest income 1,442 1,372 1,463 5 (1) First Half 2025 – Second Half 2024 Non-interest income increased by 5% to $1,442 million. Excluding Notable Items, non-interest income was up 3% to $1,424 million. Net fee income increased by 1% to $840 million. Key movements included: • Higher institutional lending fees of $19 million from increased underwriting activity and fee income from higher average lending balances; • Higher cards income of $17 million reflecting higher annual credit card and scheme fees; • Lower New Zealand fees of NZ$15 million, reflecting both lower card scheme and loan establishment fees; and • Lower Australian merchants income of $8 million, largely due to lower volumes. Net wealth management income increased by 7% to $239 million with higher funds under administration partly offset by platforms margin compression. Trading and other income increased by 14% to $363 million. Excluding Notable Items, trading and other income increased by 5% to $345 million due to higher credit sales and risk management income, largely in foreign exchange (FX). This was partly offset by a negative derivative valuation adjustment (DVA) and the net loss on the sale of the auto finance portfolio of $8 million. First Half 2025 – First Half 2024 Non-interest income declined by 1% to $1,442 million. Excluding Notable Items non-interest income decreased by 3% to $1,424 million. Net fee income of $840 million was flat. Key movements included: • Higher card fees of $17 million from higher currency conversion fees reflecting increased international spend and higher annual card fees; • Higher institutional lending fees of $8 million, primarily from the impact of a larger loan book; and • Lower Australian merchants income of $24 million, primarily due to lower volumes. Net wealth management income increased by 10% to $239 million with lower remediation costs and higher funds under administration partly offset by platforms margin compression. Trading and other income decreased by 10% to $363 million. Excluding Notable Items, trading and other income decreased by 15% to $345 million reflecting lower sales and risk management income, a reduction in DVA and the net loss on the sale of the auto finance portfolio. |
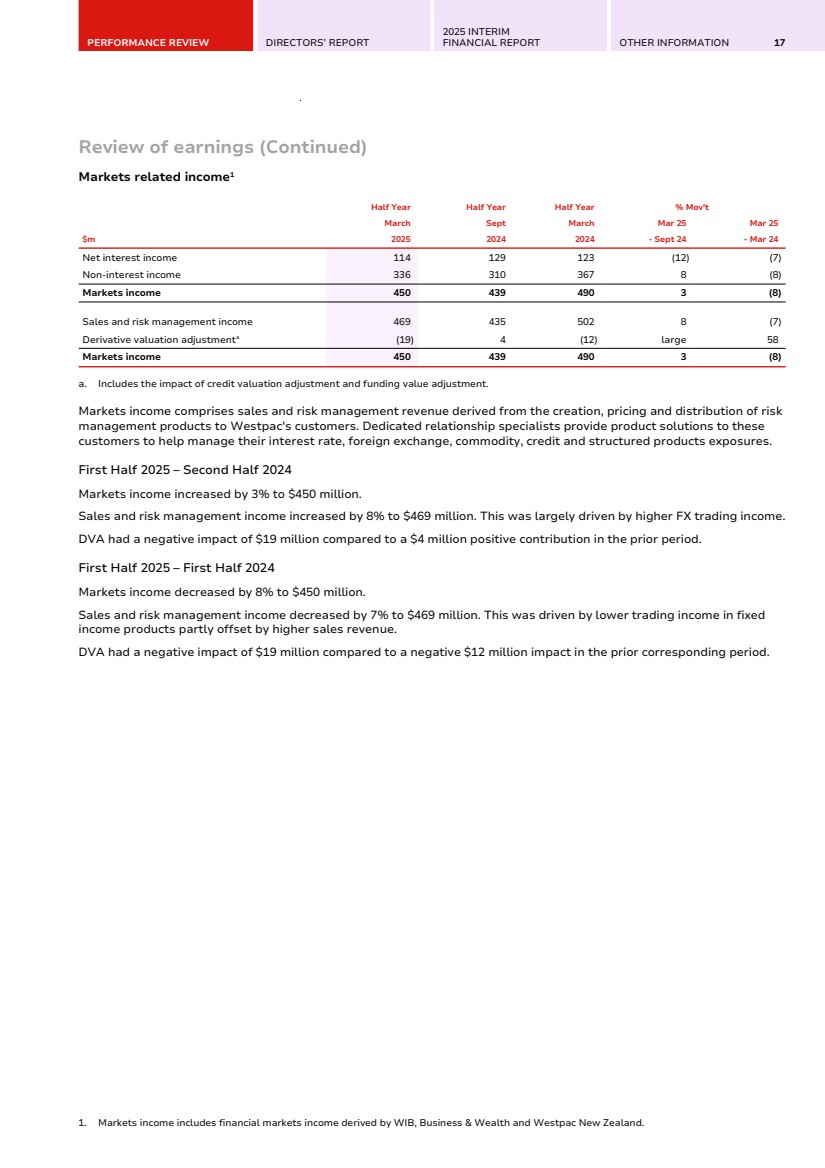
| PERFORMANCE REVIEW DIRECTORS’ REPORT 2025 INTERIM FINANCIAL REPORT OTHER INFORMATION 17 Review of earnings (Continued) Markets related income1 Half Year Half Year Half Year % Mov't March Sept March Mar 25 Mar 25 $m 2025 2024 2024 - Sept 24 - Mar 24 Net interest income 114 129 123 (12) (7) Non-interest income 336 310 367 8 (8) Markets income 450 439 490 3 (8) Sales and risk management income 469 435 502 8 (7) Derivative valuation adjustmenta (19) 4 (12) large 58 Markets income 450 439 490 3 (8) a. Includes the impact of credit valuation adjustment and funding value adjustment. Markets income comprises sales and risk management revenue derived from the creation, pricing and distribution of risk management products to Westpac's customers. Dedicated relationship specialists provide product solutions to these customers to help manage their interest rate, foreign exchange, commodity, credit and structured products exposures. First Half 2025 – Second Half 2024 Markets income increased by 3% to $450 million. Sales and risk management income increased by 8% to $469 million. This was largely driven by higher FX trading income. DVA had a negative impact of $19 million compared to a $4 million positive contribution in the prior period. First Half 2025 – First Half 2024 Markets income decreased by 8% to $450 million. Sales and risk management income decreased by 7% to $469 million. This was driven by lower trading income in fixed income products partly offset by higher sales revenue. DVA had a negative impact of $19 million compared to a negative $12 million impact in the prior corresponding period. 1. Markets income includes financial markets income derived by WIB, Business & Wealth and Westpac New Zealand. |
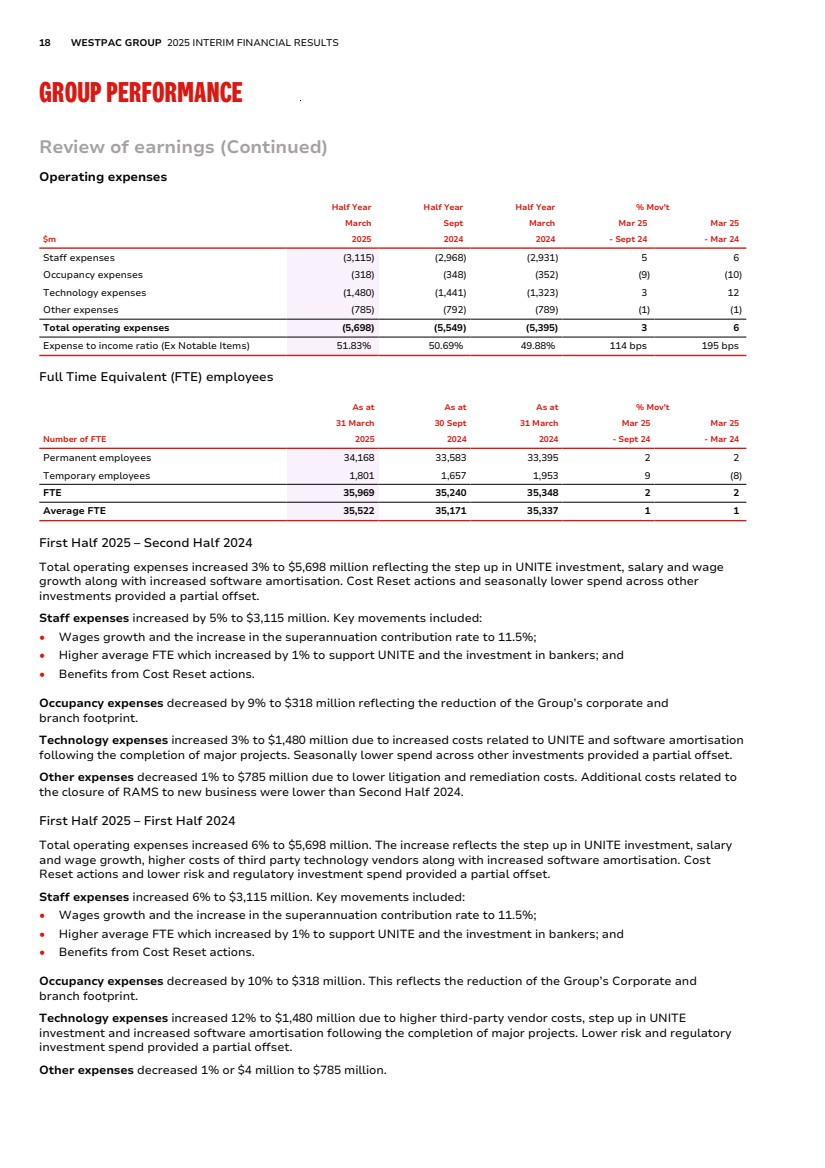
| 18 WESTPAC GROUP 2025 INTERIM FINANCIAL RESULTS GROUP PERFORMANCE Review of earnings (Continued) Operating expenses Half Year Half Year Half Year % Mov't March Sept March Mar 25 Mar 25 $m 2025 2024 2024 - Sept 24 - Mar 24 Staff expenses (3,115) (2,968) (2,931) 5 6 Occupancy expenses (318) (348) (352) (9) (10) Technology expenses (1,480) (1,441) (1,323) 3 12 Other expenses (785) (792) (789) (1) (1) Total operating expenses (5,698) (5,549) (5,395) 3 6 Expense to income ratio (Ex Notable Items) 51.83% 50.69% 49.88% 114 bps 195 bps Full Time Equivalent (FTE) employees As at As at As at % Mov't 31 March 30 Sept 31 March Mar 25 Mar 25 Number of FTE 2025 2024 2024 - Sept 24 - Mar 24 Permanent employees 34,168 33,583 33,395 2 2 Temporary employees 1,801 1,657 1,953 9 (8) FTE 35,969 35,240 35,348 2 2 Average FTE 35,522 35,171 35,337 1 1 First Half 2025 – Second Half 2024 Total operating expenses increased 3% to $5,698 million reflecting the step up in UNITE investment, salary and wage growth along with increased software amortisation. Cost Reset actions and seasonally lower spend across other investments provided a partial offset. Staff expenses increased by 5% to $3,115 million. Key movements included: • Wages growth and the increase in the superannuation contribution rate to 11.5%; • Higher average FTE which increased by 1% to support UNITE and the investment in bankers; and • Benefits from Cost Reset actions. Occupancy expenses decreased by 9% to $318 million reflecting the reduction of the Group’s corporate and branch footprint. Technology expenses increased 3% to $1,480 million due to increased costs related to UNITE and software amortisation following the completion of major projects. Seasonally lower spend across other investments provided a partial offset. Other expenses decreased 1% to $785 million due to lower litigation and remediation costs. Additional costs related to the closure of RAMS to new business were lower than Second Half 2024. First Half 2025 – First Half 2024 Total operating expenses increased 6% to $5,698 million. The increase reflects the step up in UNITE investment, salary and wage growth, higher costs of third party technology vendors along with increased software amortisation. Cost Reset actions and lower risk and regulatory investment spend provided a partial offset. Staff expenses increased 6% to $3,115 million. Key movements included: • Wages growth and the increase in the superannuation contribution rate to 11.5%; • Higher average FTE which increased by 1% to support UNITE and the investment in bankers; and • Benefits from Cost Reset actions. Occupancy expenses decreased by 10% to $318 million. This reflects the reduction of the Group’s Corporate and branch footprint. Technology expenses increased 12% to $1,480 million due to higher third-party vendor costs, step up in UNITE investment and increased software amortisation following the completion of major projects. Lower risk and regulatory investment spend provided a partial offset. Other expenses decreased 1% or $4 million to $785 million. |
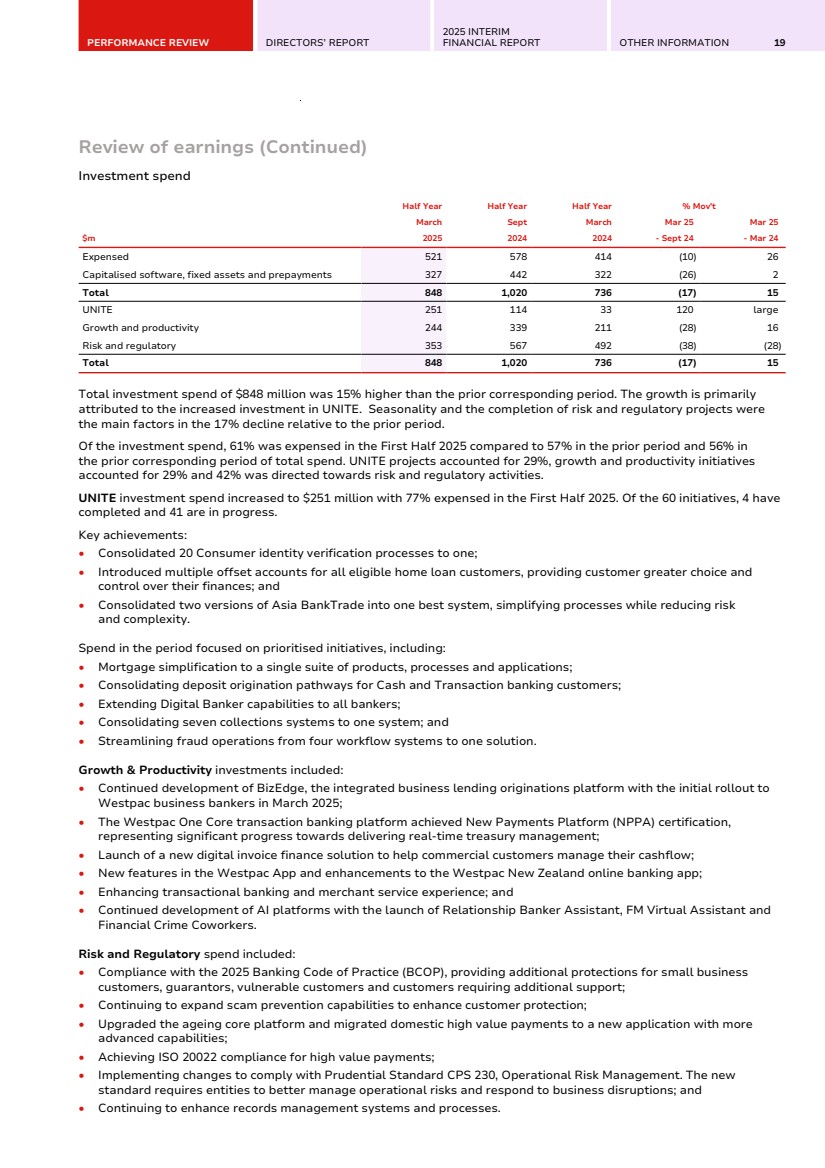
| PERFORMANCE REVIEW DIRECTORS’ REPORT 2025 INTERIM FINANCIAL REPORT OTHER INFORMATION 19 Review of earnings (Continued) Investment spend Half Year Half Year Half Year % Mov't March Sept March Mar 25 Mar 25 $m 2025 2024 2024 - Sept 24 - Mar 24 Expensed 521 578 414 (10) 26 Capitalised software, fixed assets and prepayments 327 442 322 (26) 2 Total 848 1,020 736 (17) 15 UNITE 251 114 33 120 large Growth and productivity 244 339 211 (28) 16 Risk and regulatory 353 567 492 (38) (28) Total 848 1,020 736 (17) 15 Total investment spend of $848 million was 15% higher than the prior corresponding period. The growth is primarily attributed to the increased investment in UNITE. Seasonality and the completion of risk and regulatory projects were the main factors in the 17% decline relative to the prior period. Of the investment spend, 61% was expensed in the First Half 2025 compared to 57% in the prior period and 56% in the prior corresponding period of total spend. UNITE projects accounted for 29%, growth and productivity initiatives accounted for 29% and 42% was directed towards risk and regulatory activities. UNITE investment spend increased to $251 million with 77% expensed in the First Half 2025. Of the 60 initiatives, 4 have completed and 41 are in progress. Key achievements: • Consolidated 20 Consumer identity verification processes to one; • Introduced multiple offset accounts for all eligible home loan customers, providing customer greater choice and control over their finances; and • Consolidated two versions of Asia BankTrade into one best system, simplifying processes while reducing risk and complexity. Spend in the period focused on prioritised initiatives, including: • Mortgage simplification to a single suite of products, processes and applications; • Consolidating deposit origination pathways for Cash and Transaction banking customers; • Extending Digital Banker capabilities to all bankers; • Consolidating seven collections systems to one system; and • Streamlining fraud operations from four workflow systems to one solution. Growth & Productivity investments included: • Continued development of BizEdge, the integrated business lending originations platform with the initial rollout to Westpac business bankers in March 2025; • The Westpac One Core transaction banking platform achieved New Payments Platform (NPPA) certification, representing significant progress towards delivering real-time treasury management; • Launch of a new digital invoice finance solution to help commercial customers manage their cashflow; • New features in the Westpac App and enhancements to the Westpac New Zealand online banking app; • Enhancing transactional banking and merchant service experience; and • Continued development of AI platforms with the launch of Relationship Banker Assistant, FM Virtual Assistant and Financial Crime Coworkers. Risk and Regulatory spend included: • Compliance with the 2025 Banking Code of Practice (BCOP), providing additional protections for small business customers, guarantors, vulnerable customers and customers requiring additional support; • Continuing to expand scam prevention capabilities to enhance customer protection; • Upgraded the ageing core platform and migrated domestic high value payments to a new application with more advanced capabilities; • Achieving ISO 20022 compliance for high value payments; • Implementing changes to comply with Prudential Standard CPS 230, Operational Risk Management. The new standard requires entities to better manage operational risks and respond to business disruptions; and • Continuing to enhance records management systems and processes. |
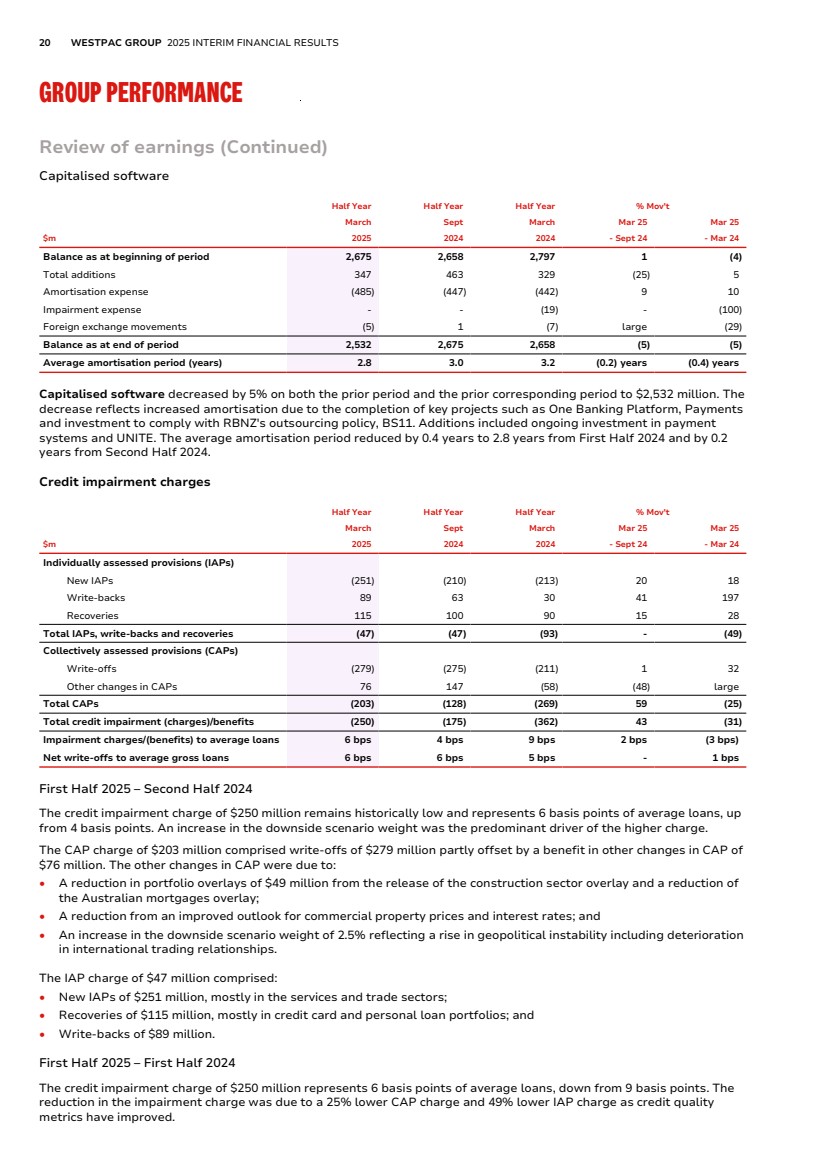
| 20 WESTPAC GROUP 2025 INTERIM FINANCIAL RESULTS GROUP PERFORMANCE Review of earnings (Continued) Capitalised software Half Year Half Year Half Year % Mov't March Sept March Mar 25 Mar 25 $m 2025 2024 2024 - Sept 24 - Mar 24 Balance as at beginning of period 2,675 2,658 2,797 1 (4) Total additions 347 463 329 (25) 5 Amortisation expense (485) (447) (442) 9 10 Impairment expense - - (19) - (100) Foreign exchange movements (5) 1 (7) large (29) Balance as at end of period 2,532 2,675 2,658 (5) (5) Average amortisation period (years) 2.8 3.0 3.2 (0.2) years (0.4) years Capitalised software decreased by 5% on both the prior period and the prior corresponding period to $2,532 million. The decrease reflects increased amortisation due to the completion of key projects such as One Banking Platform, Payments and investment to comply with RBNZ's outsourcing policy, BS11. Additions included ongoing investment in payment systems and UNITE. The average amortisation period reduced by 0.4 years to 2.8 years from First Half 2024 and by 0.2 years from Second Half 2024. Credit impairment charges Half Year Half Year Half Year % Mov't March Sept March Mar 25 Mar 25 $m 2025 2024 2024 - Sept 24 - Mar 24 Individually assessed provisions (IAPs) New IAPs (251) (210) (213) 20 18 Write-backs 89 63 30 41 197 Recoveries 115 100 90 15 28 Total IAPs, write-backs and recoveries (47) (47) (93) - (49) Collectively assessed provisions (CAPs) Write-offs (279) (275) (211) 1 32 Other changes in CAPs 76 147 (58) (48) large Total CAPs (203) (128) (269) 59 (25) Total credit impairment (charges)/benefits (250) (175) (362) 43 (31) Impairment charges/(benefits) to average loans 6 bps 4 bps 9 bps 2 bps (3 bps) Net write-offs to average gross loans 6 bps 6 bps 5 bps - 1 bps First Half 2025 – Second Half 2024 The credit impairment charge of $250 million remains historically low and represents 6 basis points of average loans, up from 4 basis points. An increase in the downside scenario weight was the predominant driver of the higher charge. The CAP charge of $203 million comprised write-offs of $279 million partly offset by a benefit in other changes in CAP of $76 million. The other changes in CAP were due to: • A reduction in portfolio overlays of $49 million from the release of the construction sector overlay and a reduction of the Australian mortgages overlay; • A reduction from an improved outlook for commercial property prices and interest rates; and • An increase in the downside scenario weight of 2.5% reflecting a rise in geopolitical instability including deterioration in international trading relationships. The IAP charge of $47 million comprised: • New IAPs of $251 million, mostly in the services and trade sectors; • Recoveries of $115 million, mostly in credit card and personal loan portfolios; and • Write-backs of $89 million. First Half 2025 – First Half 2024 The credit impairment charge of $250 million represents 6 basis points of average loans, down from 9 basis points. The reduction in the impairment charge was due to a 25% lower CAP charge and 49% lower IAP charge as credit quality metrics have improved. |
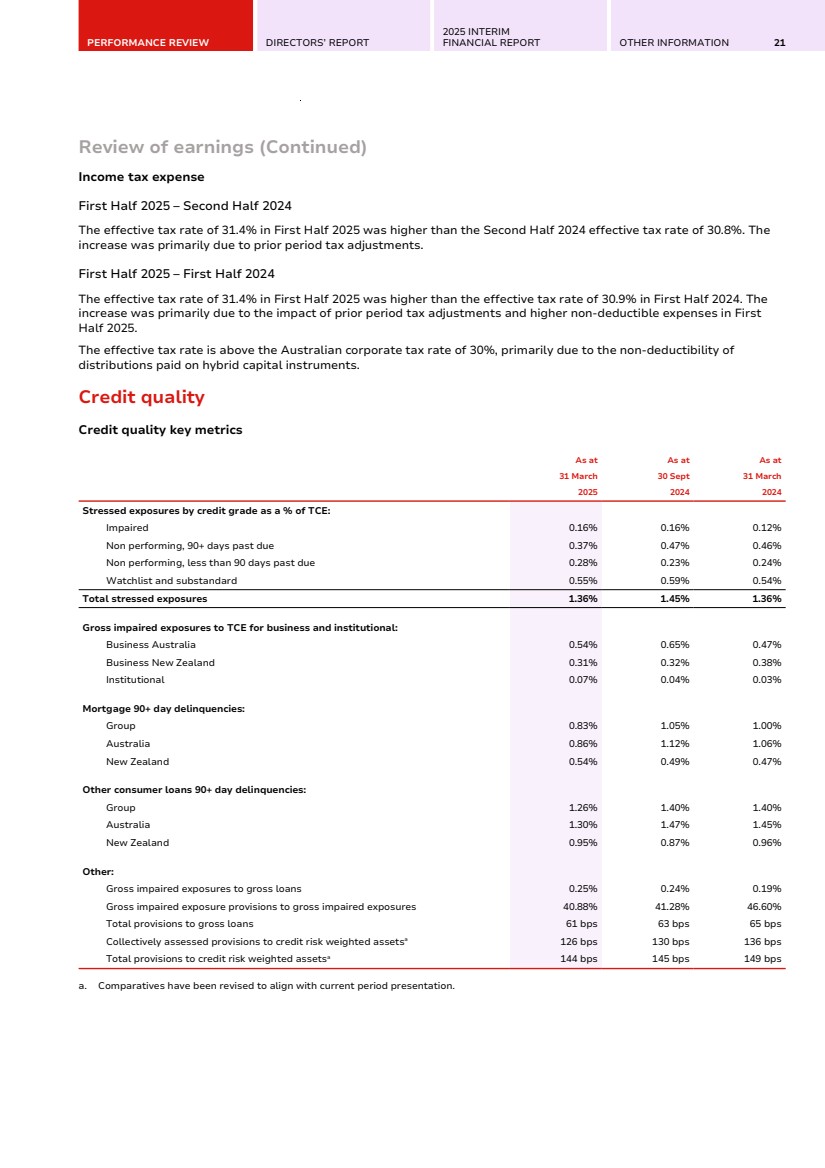
| PERFORMANCE REVIEW DIRECTORS’ REPORT 2025 INTERIM FINANCIAL REPORT OTHER INFORMATION 21 Review of earnings (Continued) Income tax expense First Half 2025 – Second Half 2024 The effective tax rate of 31.4% in First Half 2025 was higher than the Second Half 2024 effective tax rate of 30.8%. The increase was primarily due to prior period tax adjustments. First Half 2025 – First Half 2024 The effective tax rate of 31.4% in First Half 2025 was higher than the effective tax rate of 30.9% in First Half 2024. The increase was primarily due to the impact of prior period tax adjustments and higher non-deductible expenses in First Half 2025. The effective tax rate is above the Australian corporate tax rate of 30%, primarily due to the non-deductibility of distributions paid on hybrid capital instruments. Credit quality Credit quality key metrics As at As at As at 31 March 30 Sept 31 March 2025 2024 2024 Stressed exposures by credit grade as a % of TCE: Impaired 0.16% 0.16% 0.12% Non performing, 90+ days past due 0.37% 0.47% 0.46% Non performing, less than 90 days past due 0.28% 0.23% 0.24% Watchlist and substandard 0.55% 0.59% 0.54% Total stressed exposures 1.36% 1.45% 1.36% Gross impaired exposures to TCE for business and institutional: Business Australia 0.54% 0.65% 0.47% Business New Zealand 0.31% 0.32% 0.38% Institutional 0.07% 0.04% 0.03% Mortgage 90+ day delinquencies: Group 0.83% 1.05% 1.00% Australia 0.86% 1.12% 1.06% New Zealand 0.54% 0.49% 0.47% Other consumer loans 90+ day delinquencies: Group 1.26% 1.40% 1.40% Australia 1.30% 1.47% 1.45% New Zealand 0.95% 0.87% 0.96% Other: Gross impaired exposures to gross loans 0.25% 0.24% 0.19% Gross impaired exposure provisions to gross impaired exposures 40.88% 41.28% 46.60% Total provisions to gross loans 61 bps 63 bps 65 bps Collectively assessed provisions to credit risk weighted assetsa 126 bps 130 bps 136 bps Total provisions to credit risk weighted assetsa 144 bps 145 bps 149 bps a. Comparatives have been revised to align with current period presentation. |
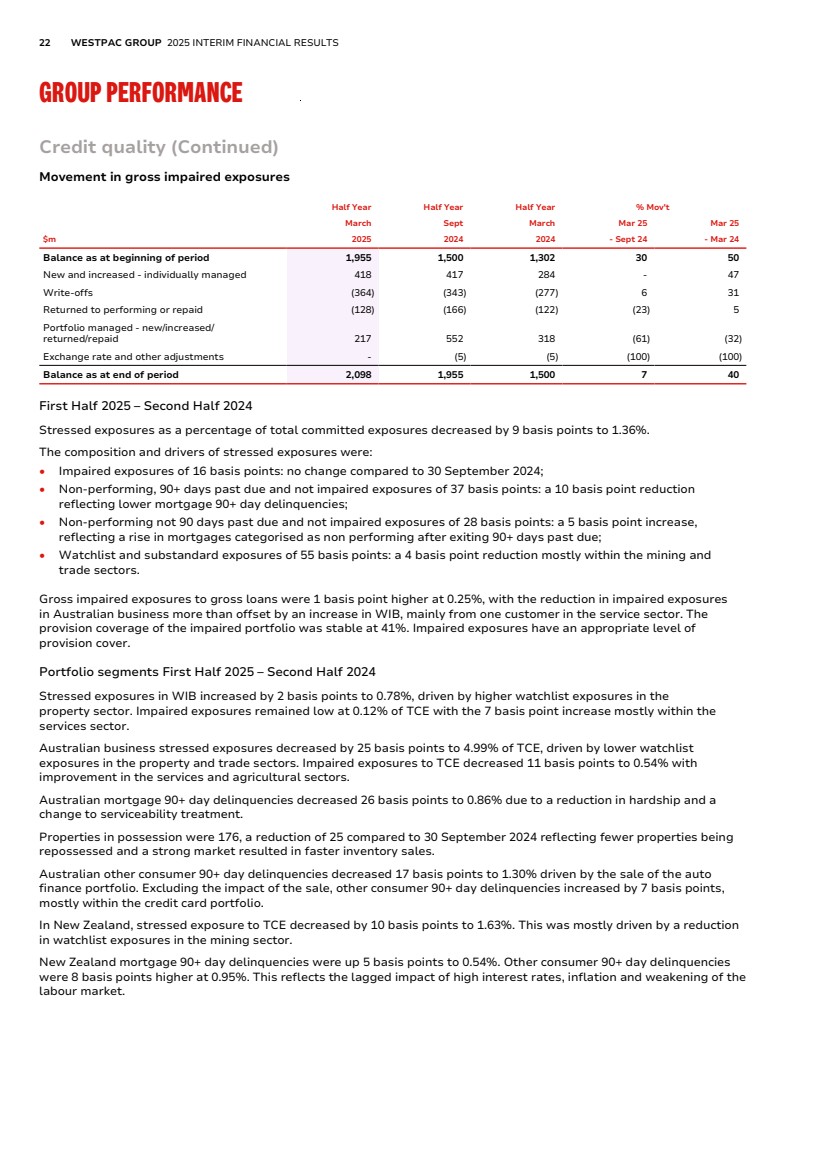
| 22 WESTPAC GROUP 2025 INTERIM FINANCIAL RESULTS GROUP PERFORMANCE Credit quality (Continued) Movement in gross impaired exposures Half Year Half Year Half Year % Mov't March Sept March Mar 25 Mar 25 $m 2025 2024 2024 - Sept 24 - Mar 24 Balance as at beginning of period 1,955 1,500 1,302 30 50 New and increased - individually managed 418 417 284 - 47 Write-offs (364) (343) (277) 6 31 Returned to performing or repaid (128) (166) (122) (23) 5 Portfolio managed - new/increased/ returned/repaid 217 552 318 (61) (32) Exchange rate and other adjustments - (5) (5) (100) (100) Balance as at end of period 2,098 1,955 1,500 7 40 First Half 2025 – Second Half 2024 Stressed exposures as a percentage of total committed exposures decreased by 9 basis points to 1.36%. The composition and drivers of stressed exposures were: • Impaired exposures of 16 basis points: no change compared to 30 September 2024; • Non-performing, 90+ days past due and not impaired exposures of 37 basis points: a 10 basis point reduction reflecting lower mortgage 90+ day delinquencies; • Non-performing not 90 days past due and not impaired exposures of 28 basis points: a 5 basis point increase, reflecting a rise in mortgages categorised as non performing after exiting 90+ days past due; • Watchlist and substandard exposures of 55 basis points: a 4 basis point reduction mostly within the mining and trade sectors. Gross impaired exposures to gross loans were 1 basis point higher at 0.25%, with the reduction in impaired exposures in Australian business more than offset by an increase in WIB, mainly from one customer in the service sector. The provision coverage of the impaired portfolio was stable at 41%. Impaired exposures have an appropriate level of provision cover. Portfolio segments First Half 2025 – Second Half 2024 Stressed exposures in WIB increased by 2 basis points to 0.78%, driven by higher watchlist exposures in the property sector. Impaired exposures remained low at 0.12% of TCE with the 7 basis point increase mostly within the services sector. Australian business stressed exposures decreased by 25 basis points to 4.99% of TCE, driven by lower watchlist exposures in the property and trade sectors. Impaired exposures to TCE decreased 11 basis points to 0.54% with improvement in the services and agricultural sectors. Australian mortgage 90+ day delinquencies decreased 26 basis points to 0.86% due to a reduction in hardship and a change to serviceability treatment. Properties in possession were 176, a reduction of 25 compared to 30 September 2024 reflecting fewer properties being repossessed and a strong market resulted in faster inventory sales. Australian other consumer 90+ day delinquencies decreased 17 basis points to 1.30% driven by the sale of the auto finance portfolio. Excluding the impact of the sale, other consumer 90+ day delinquencies increased by 7 basis points, mostly within the credit card portfolio. In New Zealand, stressed exposure to TCE decreased by 10 basis points to 1.63%. This was mostly driven by a reduction in watchlist exposures in the mining sector. New Zealand mortgage 90+ day delinquencies were up 5 basis points to 0.54%. Other consumer 90+ day delinquencies were 8 basis points higher at 0.95%. This reflects the lagged impact of high interest rates, inflation and weakening of the labour market. |
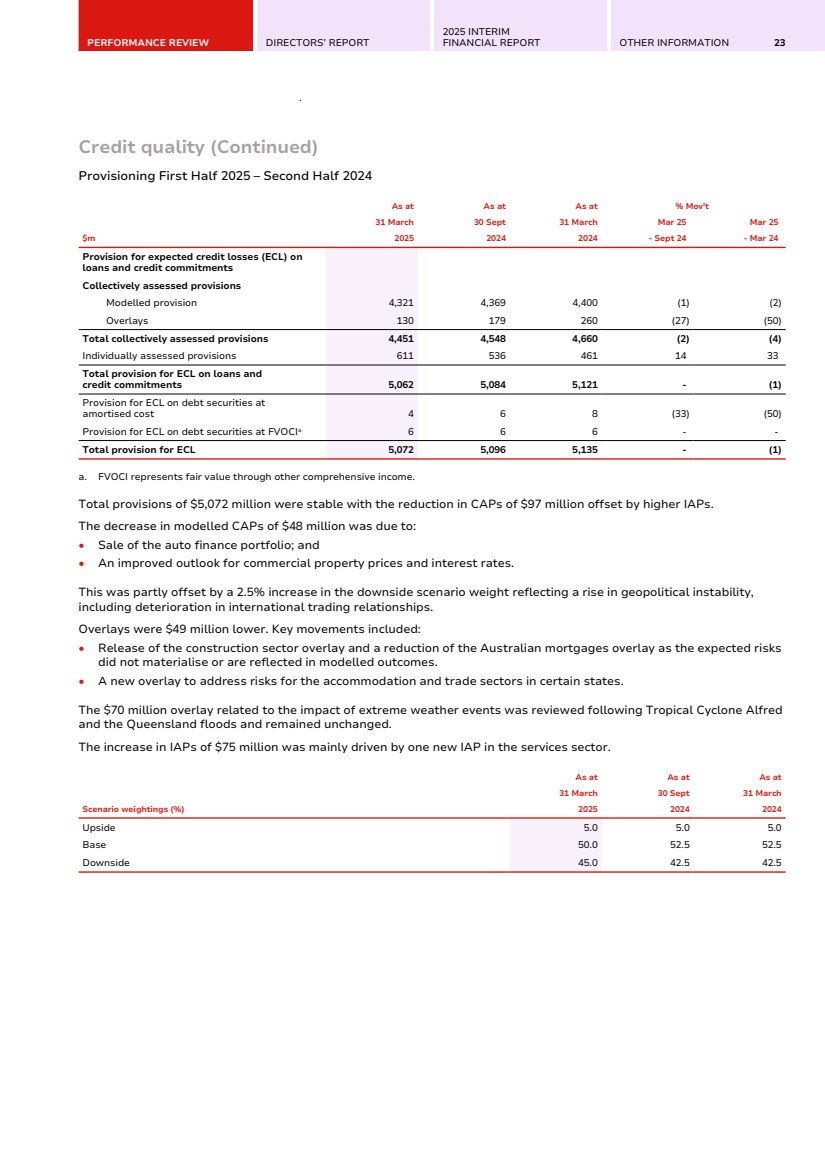
| PERFORMANCE REVIEW DIRECTORS’ REPORT 2025 INTERIM FINANCIAL REPORT OTHER INFORMATION 23 Credit quality (Continued) Provisioning First Half 2025 – Second Half 2024 As at As at As at % Mov't 31 March 30 Sept 31 March Mar 25 Mar 25 $m 2025 2024 2024 - Sept 24 - Mar 24 Provision for expected credit losses (ECL) on loans and credit commitments Collectively assessed provisions Modelled provision 4,321 4,369 4,400 (1) (2) Overlays 130 179 260 (27) (50) Total collectively assessed provisions 4,451 4,548 4,660 (2) (4) Individually assessed provisions 611 536 461 14 33 Total provision for ECL on loans and credit commitments 5,062 5,084 5,121 - (1) Provision for ECL on debt securities at amortised cost 4 6 8 (33) (50) Provision for ECL on debt securities at FVOCIa 6 6 6 - - Total provision for ECL 5,072 5,096 5,135 - (1) a. FVOCI represents fair value through other comprehensive income. Total provisions of $5,072 million were stable with the reduction in CAPs of $97 million offset by higher IAPs. The decrease in modelled CAPs of $48 million was due to: • Sale of the auto finance portfolio; and • An improved outlook for commercial property prices and interest rates. This was partly offset by a 2.5% increase in the downside scenario weight reflecting a rise in geopolitical instability, including deterioration in international trading relationships. Overlays were $49 million lower. Key movements included: • Release of the construction sector overlay and a reduction of the Australian mortgages overlay as the expected risks did not materialise or are reflected in modelled outcomes. • A new overlay to address risks for the accommodation and trade sectors in certain states. The $70 million overlay related to the impact of extreme weather events was reviewed following Tropical Cyclone Alfred and the Queensland floods and remained unchanged. The increase in IAPs of $75 million was mainly driven by one new IAP in the services sector. As at As at As at 31 March 30 Sept 31 March Scenario weightings (%) 2025 2024 2024 Upside 5.0 5.0 5.0 Base 50.0 52.5 52.5 Downside 45.0 42.5 42.5 |
| 24 WESTPAC GROUP 2025 INTERIM FINANCIAL RESULTS GROUP PERFORMANCE Balance sheet and funding Balance sheet As at As at As at % Mov't 31 March 30 Sept 31 March Mar 25 Mar 25 $m 2025 2024 2024 - Sept 24 - Mar 24 Assets Loans 824,808 806,767 784,839 2 5 Housing 573,711 566,081 557,263 1 3 Personal 10,440 11,238 11,951 (7) (13) Business 245,235 234,016 220,207 5 11 Provision for expected credit losses (4,578) (4,568) (4,582) - - Liquid assets 204,249 200,682 201,364 2 1 All other assets 69,836 70,095 66,458 - 5 Total assets 1,098,893 1,077,544 1,052,661 2 4 Liabilities Customer deposits 696,762 673,615 650,946 3 7 Transactions 123,096 119,944 123,354 3 - Savings 228,929 216,256 206,391 6 11 Term 199,612 197,230 187,625 1 6 Non-interest bearing 145,125 140,185 133,576 4 9 Certificates of deposit 42,488 46,874 51,280 (9) (17) Debt issues 171,864 169,284 159,781 2 8 Term funding from central banks 2,740 2,777 12,507 (1) (78) Loan capital 40,703 37,883 37,280 7 9 All other liabilities 71,983 75,059 68,307 (4) 5 Total liabilities 1,026,540 1,005,492 980,101 2 5 Equity Total equity attributable to owners of WBC 72,015 71,705 72,522 - (1) Non-controlling interest 338 347 38 (3) large Total equity 72,353 72,052 72,560 - - |

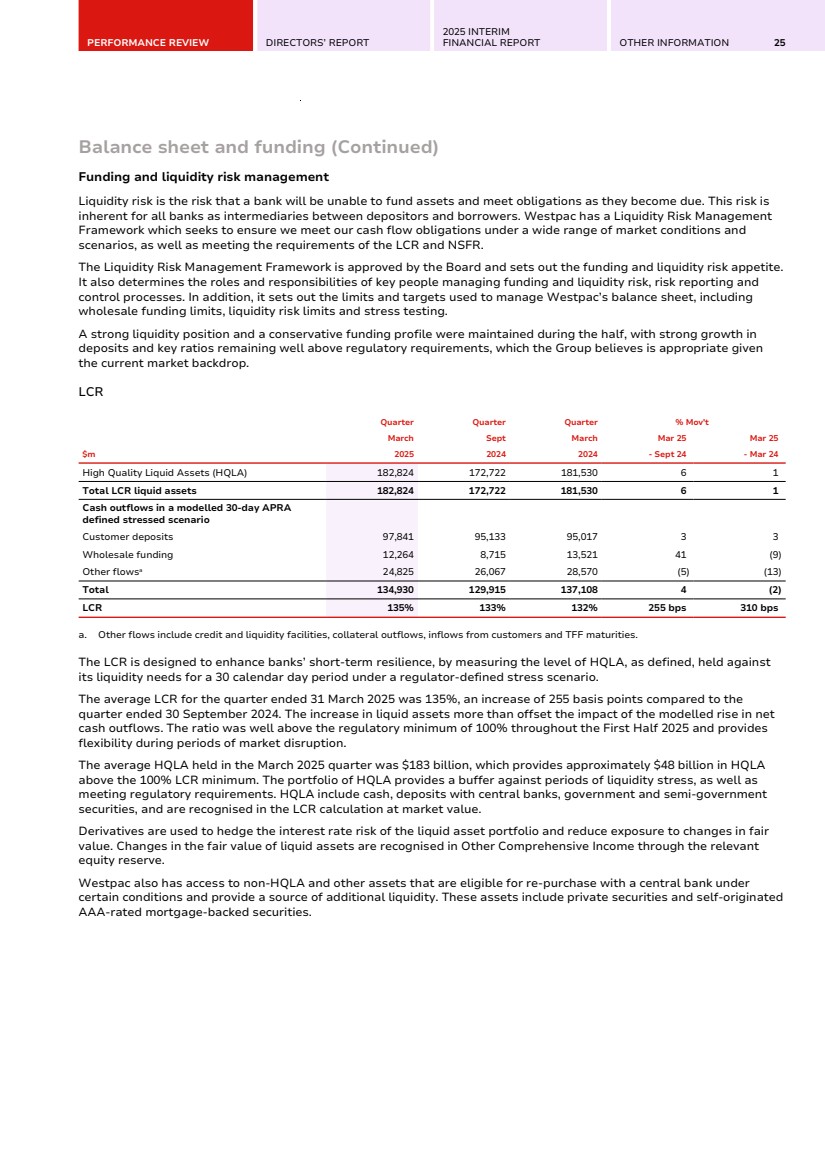
| PERFORMANCE REVIEW DIRECTORS’ REPORT 2025 INTERIM FINANCIAL REPORT OTHER INFORMATION 25 Balance sheet and funding (Continued) Funding and liquidity risk management Liquidity risk is the risk that a bank will be unable to fund assets and meet obligations as they become due. This risk is inherent for all banks as intermediaries between depositors and borrowers. Westpac has a Liquidity Risk Management Framework which seeks to ensure we meet our cash flow obligations under a wide range of market conditions and scenarios, as well as meeting the requirements of the LCR and NSFR. The Liquidity Risk Management Framework is approved by the Board and sets out the funding and liquidity risk appetite. It also determines the roles and responsibilities of key people managing funding and liquidity risk, risk reporting and control processes. In addition, it sets out the limits and targets used to manage Westpac’s balance sheet, including wholesale funding limits, liquidity risk limits and stress testing. A strong liquidity position and a conservative funding profile were maintained during the half, with strong growth in deposits and key ratios remaining well above regulatory requirements, which the Group believes is appropriate given the current market backdrop. LCR Quarter Quarter Quarter % Mov't March Sept March Mar 25 Mar 25 $m 2025 2024 2024 - Sept 24 - Mar 24 High Quality Liquid Assets (HQLA) 182,824 172,722 181,530 6 1 Total LCR liquid assets 182,824 172,722 181,530 6 1 Cash outflows in a modelled 30-day APRA defined stressed scenario Customer deposits 97,841 95,133 95,017 3 3 Wholesale funding 12,264 8,715 13,521 41 (9) Other flowsa 24,825 26,067 28,570 (5) (13) Total 134,930 129,915 137,108 4 (2) LCR 135% 133% 132% 255 bps 310 bps a. Other flows include credit and liquidity facilities, collateral outflows, inflows from customers and TFF maturities. The LCR is designed to enhance banks’ short-term resilience, by measuring the level of HQLA, as defined, held against its liquidity needs for a 30 calendar day period under a regulator-defined stress scenario. The average LCR for the quarter ended 31 March 2025 was 135%, an increase of 255 basis points compared to the quarter ended 30 September 2024. The increase in liquid assets more than offset the impact of the modelled rise in net cash outflows. The ratio was well above the regulatory minimum of 100% throughout the First Half 2025 and provides flexibility during periods of market disruption. The average HQLA held in the March 2025 quarter was $183 billion, which provides approximately $48 billion in HQLA above the 100% LCR minimum. The portfolio of HQLA provides a buffer against periods of liquidity stress, as well as meeting regulatory requirements. HQLA include cash, deposits with central banks, government and semi-government securities, and are recognised in the LCR calculation at market value. Derivatives are used to hedge the interest rate risk of the liquid asset portfolio and reduce exposure to changes in fair value. Changes in the fair value of liquid assets are recognised in Other Comprehensive Income through the relevant equity reserve. Westpac also has access to non-HQLA and other assets that are eligible for re-purchase with a central bank under certain conditions and provide a source of additional liquidity. These assets include private securities and self-originated AAA-rated mortgage-backed securities. |
| 26 WESTPAC GROUP 2025 INTERIM FINANCIAL RESULTS GROUP PERFORMANCE Balance sheet and funding (Continued) NSFR As at As at As at % Mov't 31 March 30 Sept 31 March Mar 25 Mar 25 $m 2025 2024 2024 - Sept 24 - Mar 24 Available stable funding 767,463 736,202 720,483 4 7 Required stable funding 666,726 654,798 632,775 2 5 Net stable funding ratio 115% 112% 114% 268 bps 125 bps The NSFR is designed to encourage banks’ longer-term funding resilience. To comply, banks are required to maintain an NSFR of at least 100% at all times. The NSFR was 115% at 31 March 2025, well above the 100% minimum and above the Group's normal operating range. There has been little change to our liquidity risk or structural term profile. The ratio was up from 112% at 30 September 2024. Available stable funding increased by $31 billion due to growth in customer deposits. This was greater than the increase in required stable funding of $12 billion from customer lending. Funding The composition and stability of the Group's funding is monitored to comply with its funding risk appetite and the regulatory requirements of both the LCR and NSFR. A conservative funding profile was maintained during the half with deposits providing the primary funding source for new lending growth, with wholesale market activities focussed on refinancing wholesale maturities and remaining responsive to balance sheet needs. Funding by residual maturity As at 31 March 2025 As at 30 Sept 2024 As at 31 March 2024 $m Ratio % $m Ratio % $m Ratio % Customer deposits 696,762 67.5 673,615 66.9 650,946 65.9 Wholesale funding Short term 82,066 7.9 82,590 8.2 80,289 8.1 Long term - less than or equal to one year residual maturitya 29,390 2.8 31,790 3.2 44,145 4.5 Long term - more than one year residual maturitya 145,480 14.2 140,458 13.9 133,895 13.5 Securitisation 6,502 0.6 5,539 0.6 6,097 0.7 Total wholesale funding 263,438 25.5 260,377 25.9 264,426 26.8 Equityb 72,131 7.0 72,052 7.2 72,407 7.3 Total funding 1,032,331 100.0 1,006,044 100.0 987,779 100.0 a. Comparatives have been revised to align with current period presentation. b. Includes total share capital, share-based payment reserve and retained profits. |
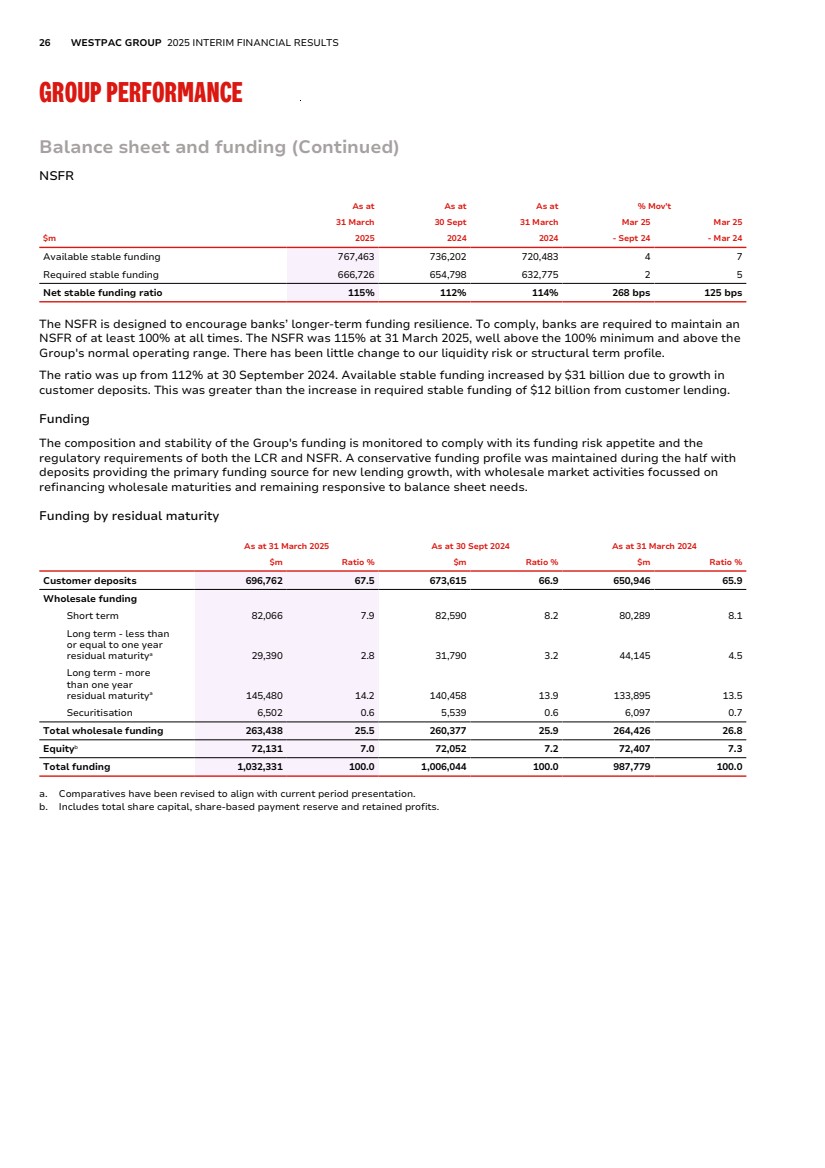
| PERFORMANCE REVIEW DIRECTORS’ REPORT 2025 INTERIM FINANCIAL REPORT OTHER INFORMATION 27 Balance sheet and funding (Continued) Long term wholesale funding Long term funding with a residual maturity greater than 12 months made up 14.2% of total funding at 31 March 2025, up from 13.9% at 30 September 2024, due to movements in exchange rates. Funding from securitisation accounted for a further 0.6% of total funding. In total, $15.3 billion of long term wholesale funding was raised in the First Half 2025, including $1.2 billion issued by Westpac New Zealand Limited. This compares to $19.8 billion in First Half 2024. Growth in household deposits together with lower wholesale funding maturities reduced the bank's long-term wholesale funding needs in the First Half 2025. New term issuance included senior unsecured bonds, RMBS and Tier 2 capital securities and was raised across a range of tenors and currencies. Short term wholesale funding Short term wholesale funding accounted for 7.9% of total funding at 31 March 2025, down from 8.2% in 30 September 2024. Long term funding where the residual maturity is less than one year, reduced to 2.8% at 31 March 2025, from 3.2% at 30 September 2024. The short term wholesale funding portfolio, including long-term funding with a residual maturity of less than one year, had a weighted average maturity of 157 days, up from 151 days at 30 September 2024. Deposit to loan ratio As at 31 March 2025 As at 30 Sept 2024 As at 31 March 2024 $m Ratio % $m Ratio % $m Ratio % Customer deposits 696,762 673,615 650,946 Loans 824,808 84.48 806,767 83.50 784,839 82.94 Customer deposits Customer deposits accounted for 67.5% of total funding at 31 March 2025, compared to 66.9% at 30 September 2024. Over First Half 2025, customer deposits increased by $23.1 billion or 3%, providing the primary funding source for new lending. Loans grew by $18.0 billion or 2% and this resulted in the deposit to loan ratio increasing to 84.5%, a new high for the Group. Equity Funding from equity made up 7.0% of total funding at 31 March 2025, compared to 7.2% at 30 September 2024. This reflects the impact of the on market share buyback conducted during First Half 2025. |
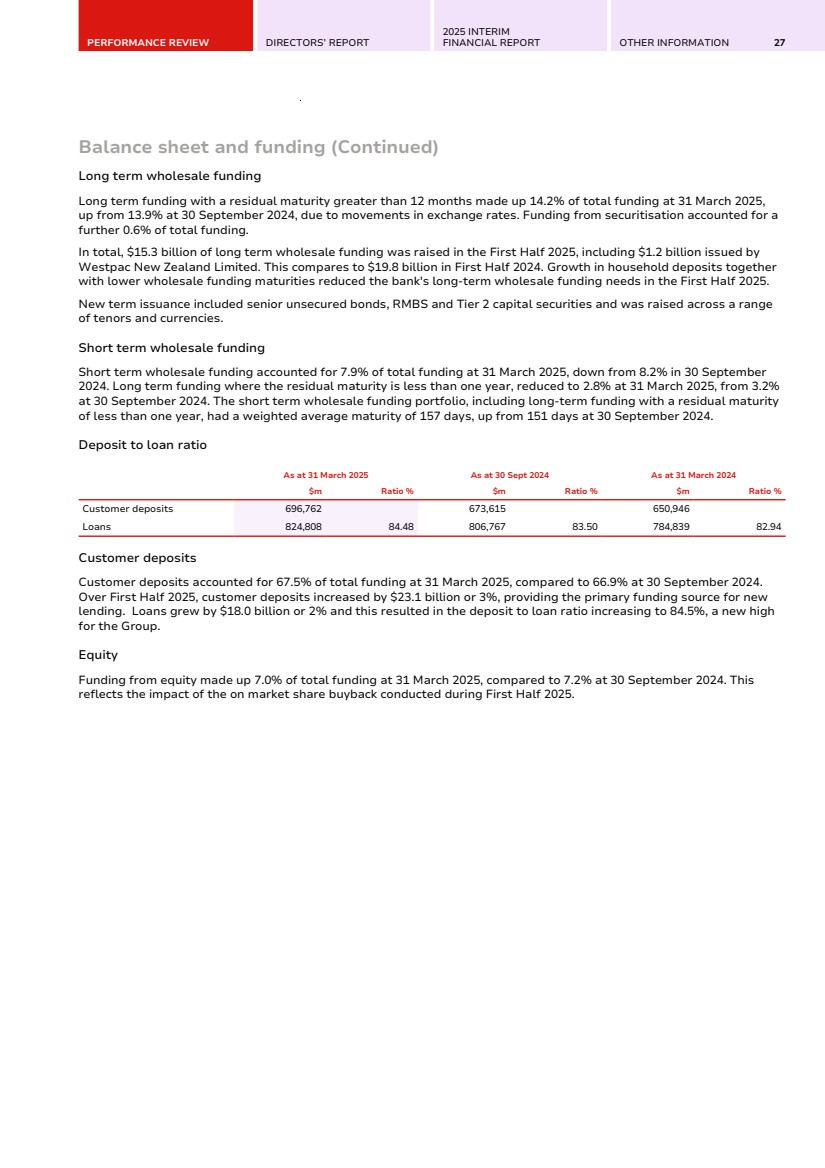
| 28 WESTPAC GROUP 2025 INTERIM FINANCIAL RESULTS GROUP PERFORMANCE Capital and dividends As at As at As at % Mov't 31 March 30 Sept 31 March Mar 25 Mar 25 2025 2024 2024 - Sept 24 - Mar 24 Level 2 regulatory capital structure Common equity Tier 1 (CET1) capital after deductions ($m) 55,007 54,648 55,764 1 (1) Risk weighted assets (RWA) ($m) 449,495 437,430 444,417 3 1 CET1 capital ratio 12.24% 12.49% 12.55% (25 bps) (31 bps) Additional Tier 1 capital ratio 2.31% 2.33% 2.46% (2 bps) (15 bps) Tier 1 capital ratio 14.55% 14.82% 15.01% (27 bps) (46 bps) Tier 2 capital ratio 7.06% 6.56% 6.42% 50 bps 64 bps Total regulatory capital ratio 21.61% 21.38% 21.43% 23 bps 18 bps APRA leverage ratio 5.20% 5.30% 5.49% (10 bps) (29 bps) Level 1 regulatory capital structure CET1 capital after deductions ($m) 51,087 50,454 51,999 1 (2) Risk weighted assets ($m) 408,792 397,719 406,397 3 1 Level 1 CET1 capital ratio 12.50% 12.69% 12.80% (19 bps) (30 bps) Capital management strategy Westpac's capital management strategy is reviewed on an ongoing basis, including through an annual Internal Capital Adequacy Assessment Process (ICAAP). Key considerations include: • Regulatory capital minimums together with the capital conservation buffer and countercyclical capital buffer comprise the Total CET1 Requirement. The Total CET1 Requirement for D-SIBs, including Westpac, is at least 10.25%1 ; • Strategy, business mix and operations and contingency plans; • Perspectives of external stakeholders including rating agencies as well as equity and debt investors; and • A stress testing framework that tests our resilience under a range of adverse economic scenarios. The Board has determined a target CET1 operating capital range of between 11.0% and 11.5%, in normal operating conditions. APRA announcement to phase out Additional Tier 1 (AT1) capital as eligible bank capital On 9 December 2024, APRA confirmed it will phase out AT1 capital instruments from the bank prudential framework. Under APRA’s proposed approach, large internationally active banks such as Westpac will replace 1.5% AT1 capital with 1.25% Tier 2 capital and 0.25% CET1 capital which would see the total CET1 requirement, including regulatory buffers, increase from 10.25% to 10.50%. APRA intends to finalise changes to relevant prudential standards before the end of 2025, with the updated framework to come into effect from 1 January 2027. In addition, from this date, existing AT1 capital instruments would be eligible to be included as Tier 2 capital, until their first scheduled call date. All existing AT1 capital instruments issued by an Australian bank would reach their first scheduled call date by 2032 at the latest. 1. Noting that APRA may apply higher CET1 requirements for an individual ADI. |
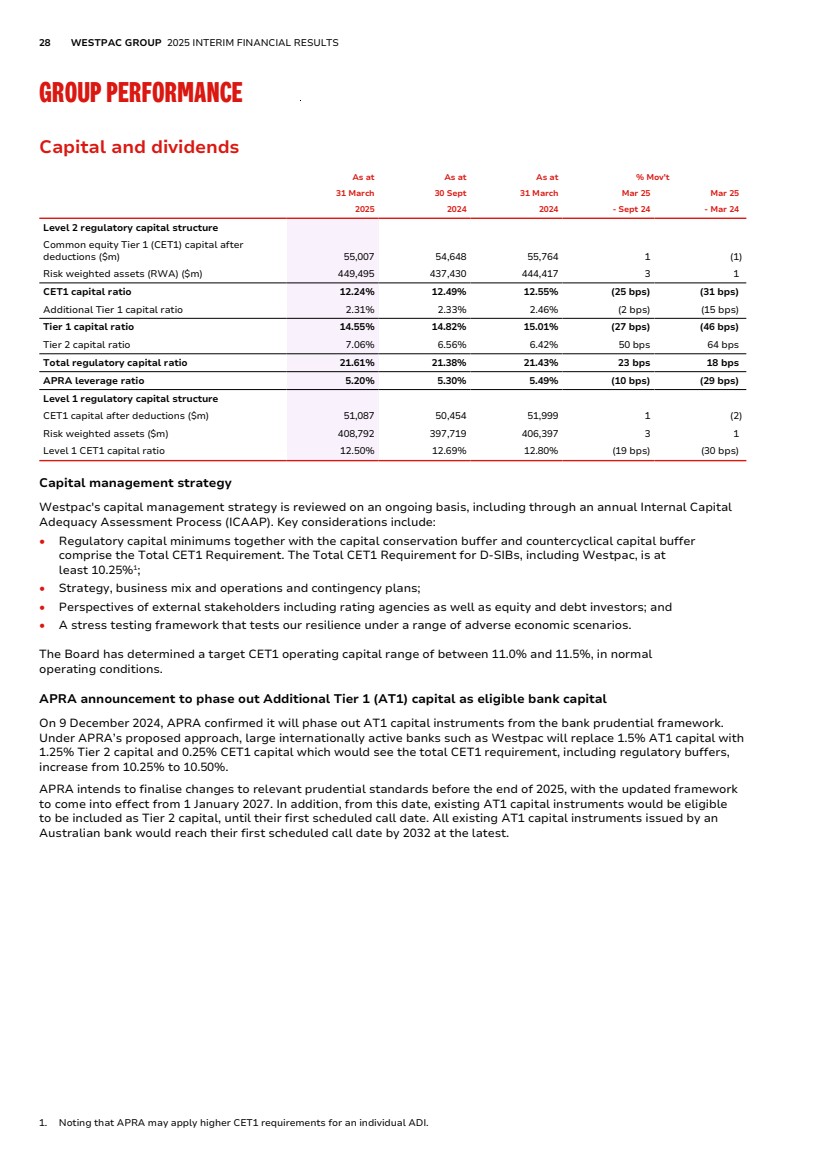
| PERFORMANCE REVIEW DIRECTORS’ REPORT 2025 INTERIM FINANCIAL REPORT OTHER INFORMATION 29 Capital and dividends (Continued) LEVEL 2 CET1 CAPITAL RATIO MOVEMENT FOR FIRST HALF 2025 12.49% 74bps (58bps) (31bps) 3bps (13bps) 12.24% Sep-24 Net profit Dividends RWA movement Capital deductions and other items Capital return Mar-25 The Level 2 CET1 capital ratio was 12.24% at 31 March 2025, 25 basis points lower than 30 September 2024. Key movements included: • First Half 2025 net profit: 74 basis points increase; • Payment of the 2024 final ordinary dividend: 58 basis points reduction; • RWA movement: 31 basis points decrease mainly due to higher non-credit RWA; • Capital deductions and other items: 3 basis points increase mainly due to a decrease in capitalised software and capitalised expenditure balances; and • Capital return: 13 basis points reduction comprising approximately $0.6 billion of on market share buybacks. The Level 1 CET1 capital ratio was 12.50% at 31 March 2025, 19 basis points lower than 30 September 2024 with movements broadly in line with Level 2. Tier 2 Westpac issued $3.6 billion of Tier 2 capital instruments and redeemed $2.4 billion over the half. The net impact of these transactions was an increase in the total regulatory capital ratio of approximately 25 basis points. Domestic systemically important banks (D-SIBs), including Westpac, have a total capital requirement of 18.25% from 1 January 2026. Westpac's total regulatory capital ratio was 21.61% at 31 March 2025. Leverage ratio The leverage ratio represents the percentage of Tier 1 capital relative to the Exposure Measure1 . At 31 March 2025, Westpac's leverage ratio was 5.20%, down 10 basis point from 30 September 2024. The ratio remains well above APRA's regulatory minimum requirement of 3.5%. The decrease in the leverage ratio is mainly due to an increase in total exposures of $34.8 billion from higher lending. Internationally comparable capital ratios APRA’s capital adequacy requirements are more conservative than those of the Basel Committee on Banking Supervision, leading to lower reported capital ratios when compared to international peers. International comparable capital ratios have been calculated using the methodology outlined in the Australian Banking Association study released on 10 March 2023. As at As at As at % Mov't 31 March 30 Sept 31 March Mar 25 Mar 25 % 2025 2024 2024 - Sept 24 - Mar 24 Internationally comparable capital ratios CET1 capital ratio 18.22% 18.27% 18.55% (5 bps) (33 bps) Tier 1 capital ratio 21.31% 21.33% 21.83% (2 bps) (52 bps) Total regulatory capital ratio 30.76% 29.93% 30.41% 83 bps 35 bps Leverage ratio 5.66% 5.78% 5.95% (12 bps) (29 bps) 1. As defined under Attachment D of APS 110: Capital Adequacy. |
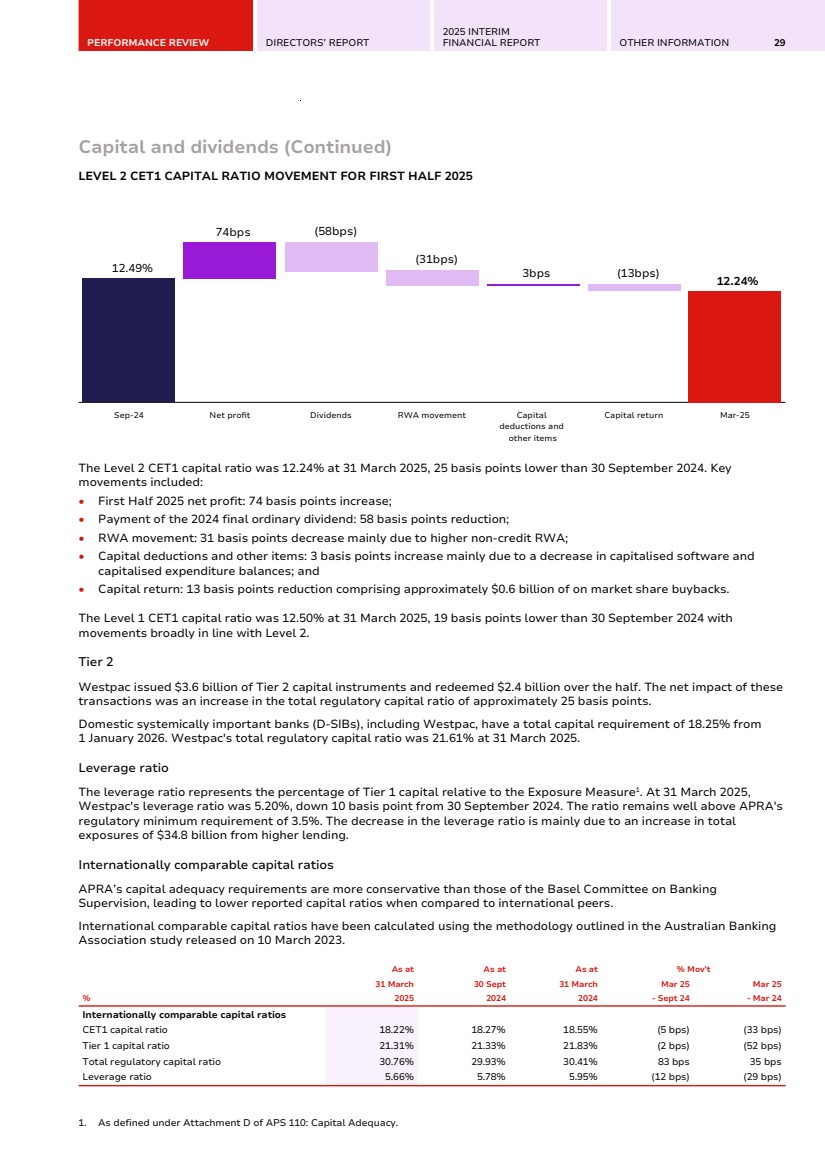
| 30 WESTPAC GROUP 2025 INTERIM FINANCIAL RESULTS GROUP PERFORMANCE Capital and dividends (Continued) Risk Weighted Assets (RWA) As at As at As at % Mov't 31 March 30 Sept 31 March Mar 25 Mar 25 $m 2025 2024 2024 - Sept 24 - Mar 24 Credit risk: Corporate 30,140 25,976 25,269 16 19 Business lending 26,373 25,033 23,426 5 13 Property finance 31,612 32,196 30,386 (2) 4 Large corporate 20,471 21,035 20,558 (3) - Sovereign 2,173 2,047 1,919 6 13 Financial institution 15,174 13,694 13,088 11 16 Residential mortgages 116,954 116,228 115,918 1 1 Australian credit cards 3,523 3,565 3,789 (1) (7) Other retail 3,395 3,995 4,259 (15) (20) Small business 16,531 17,123 17,378 (3) (5) Specialised lending 4,588 3,695 3,276 24 40 Securitisation 8,010 7,821 7,317 2 9 Standardised 19,951 25,414 26,668 (21) (25) New Zealanda 48,345 48,142 46,490 - 4 Other assets 5,993 5,760 4,892 4 23 Total credit riskb 353,233 351,724 344,633 - 2 Market risk 8,478 9,555 11,251 (11) (25) Operational risk 48,521 48,196 54,934 1 (12) Interest rate risk in the banking book (IRRBB) 39,263 27,955 33,599 40 17 Total risk weighted assets 449,495 437,430 444,417 3 1 a. Includes credit and securitisation exposures regulated under RBNZ prudential requirements. b. Includes counterparty credit risk, credit valuation adjustment, securitisation exposures in the banking book and settlement risk. Comparatives have been revised to include RWAs relating to Other assets. Total RWA increased by 2.8% to $449.5 billion over the half largely due to the increase in non-credit RWA. Credit RWA increased by $1.5 billion. Key movements included: • A $9.1 billion increase from higher lending primarily in corporate, business lending, property finance and residential mortgages; • A $0.3 billion increase from foreign currency translation impacts, predominantly the depreciation of the A$ against the US$; • A $4.1 billion decrease from data refinements mainly related to property finance and residential mortgages1 ; • A $2.0 billion decrease from counterparty credit risk and credit valuation adjustments; • A $1.1 billion decrease mainly due to improvements in residential mortgages delinquency rates; and • A $1.0 billion decrease from sale of the auto finance portfolio. Non-credit RWA increased by $10.6 billion. Key movements included: • IRRBB RWA: $11.3 billion increase from: – A $13.2 billion increase in repricing and yield curve, basis and optionality risk primarily driven by a $8.8 billion increase in RWA due to the Group's decision to extend the duration of its core non-rate sensitive (NRS) hedge from 4 years to 5 years2 and underlying banking book positions; and – A $1.9 billion decrease from lower interest rates resulting in a regulatory embedded gain of $3.1 billion as at 31 March 2025 compared to $1.3 billion gain as at 30 September 2024. • Market RWA: $1.1 billion decrease mainly from lower market risk exposures. 1. This includes a $1 billion APRA RWA overlay pending rectification of the usage of a customer risk grade proxy on a small sub-set of non-retail exposures. 2. Westpac is seeking approval from APRA for its revised NRS model to allow the approved profile to move to 5 years from 4 years which, subject to APRA's approval, would remove this capital. APRA is reviewing this model and is expected to respond after September 2025 as part of the implementation of the revisions to APS117. |
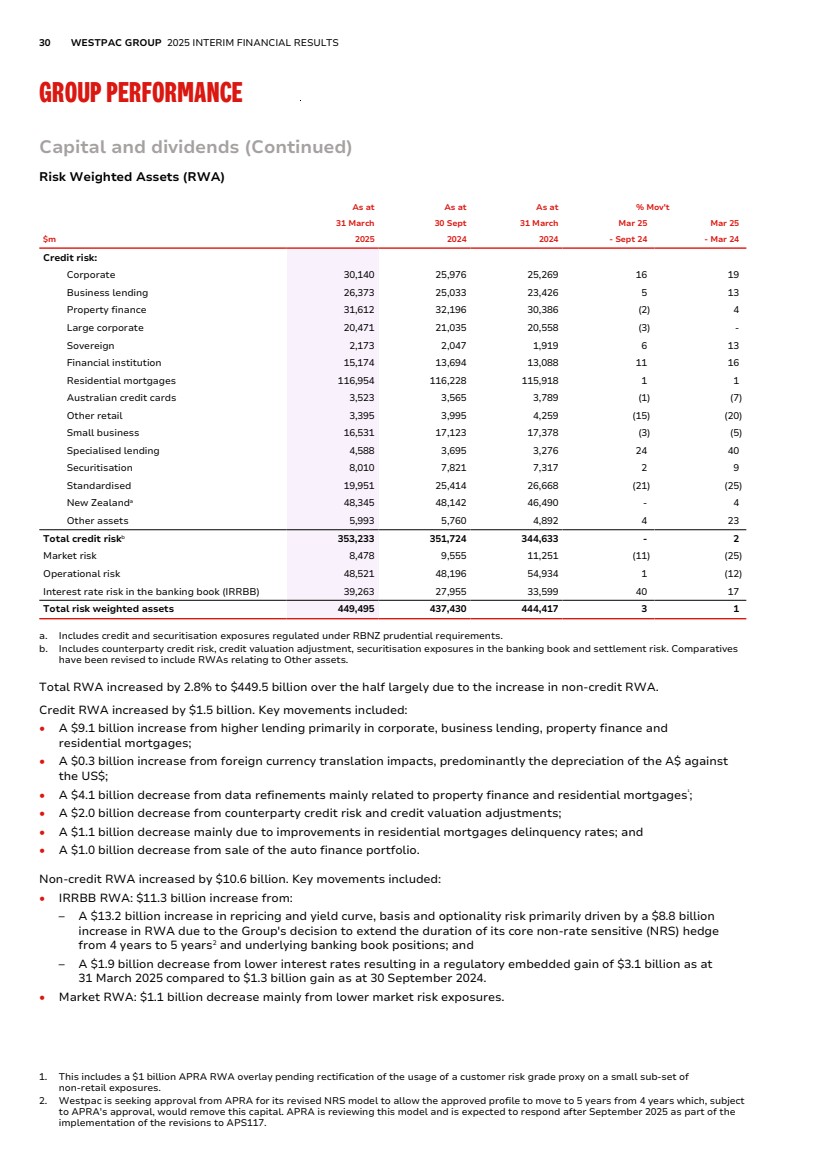
| PERFORMANCE REVIEW DIRECTORS’ REPORT 2025 INTERIM FINANCIAL REPORT OTHER INFORMATION 31 Capital and dividends (Continued) Capital adequacy As at As at As at 31 March 30 Sept 31 March $m 2025 2024 2024 Tier 1 capital CET1 capital Paid up ordinary capital 37,354 37,958 38,944 Treasury shares (877) (815) (815) Equity based remuneration 2,116 2,028 1,994 Foreign currency translation reserve (385) (471) (332) Accumulated other comprehensive income (625) (617) (238) Non-controlling interests - other 3 8 38 Retained earnings 33,451 32,773 32,179 Less retained earnings in life and general insurance, funds management and securitisation entities (387) (357) (399) Deferred fees 356 350 305 Total CET1 capital 71,006 70,857 71,676 Deductions from CET1 capital Goodwill (8,066) (8,071) (8,050) Deferred tax assets (2,343) (2,377) (2,186) Capitalised expenditure (2,289) (2,349) (2,333) Capitalised software (2,527) (2,668) (2,658) Investments in subsidiaries not consolidated for regulatory purposes (175) (154) (136) Regulatory expected downturn loss in excess of eligible provisions - - - Securitisation (1) (9) (16) Defined benefit superannuation fund surplus (211) (215) (146) Equity investments (219) (235) (234) Regulatory adjustments to fair value positions (168) (131) (153) Total deductions from CET1 capital (15,999) (16,209) (15,912) Total CET1 capital after deductions 55,007 54,648 55,764 Additional Tier 1 capital Basel III complying instruments 10,413 10,225 10,956 Total Additional Tier 1 capital 10,413 10,225 10,956 Deductions from Additional Tier 1 capital Holdings of own and other financial institutions Additional Tier 1 capital instruments (26) (30) (26) Total deductions from Additional Tier 1 capital (26) (30) (26) Net Additional Tier 1 regulatory capital 10,387 10,195 10,930 Net Tier 1 regulatory capital 65,394 64,843 66,694 Tier 2 capital Basel III complying instruments 31,531 28,293 28,067 Eligible general reserve for credit loss 729 770 896 Total Tier 2 capital 32,260 29,063 28,963 Deductions from Tier 2 capital Holdings of own and other financial institutions Tier 2 capital instruments (518) (368) (410) Total deductions from Tier 2 capital (518) (368) (410) Net Tier 2 regulatory capital 31,742 28,695 28,553 Total regulatory capital 97,136 93,538 95,247 Risk weighted assets 449,495 437,430 444,417 CET1 capital ratio 12.24% 12.49% 12.55% Additional Tier 1 capital ratio 2.31% 2.33% 2.46% Tier 1 capital ratio 14.55% 14.82% 15.01% Tier 2 capital ratio 7.06% 6.56% 6.42% Total regulatory capital ratio 21.61% 21.38% 21.43% |
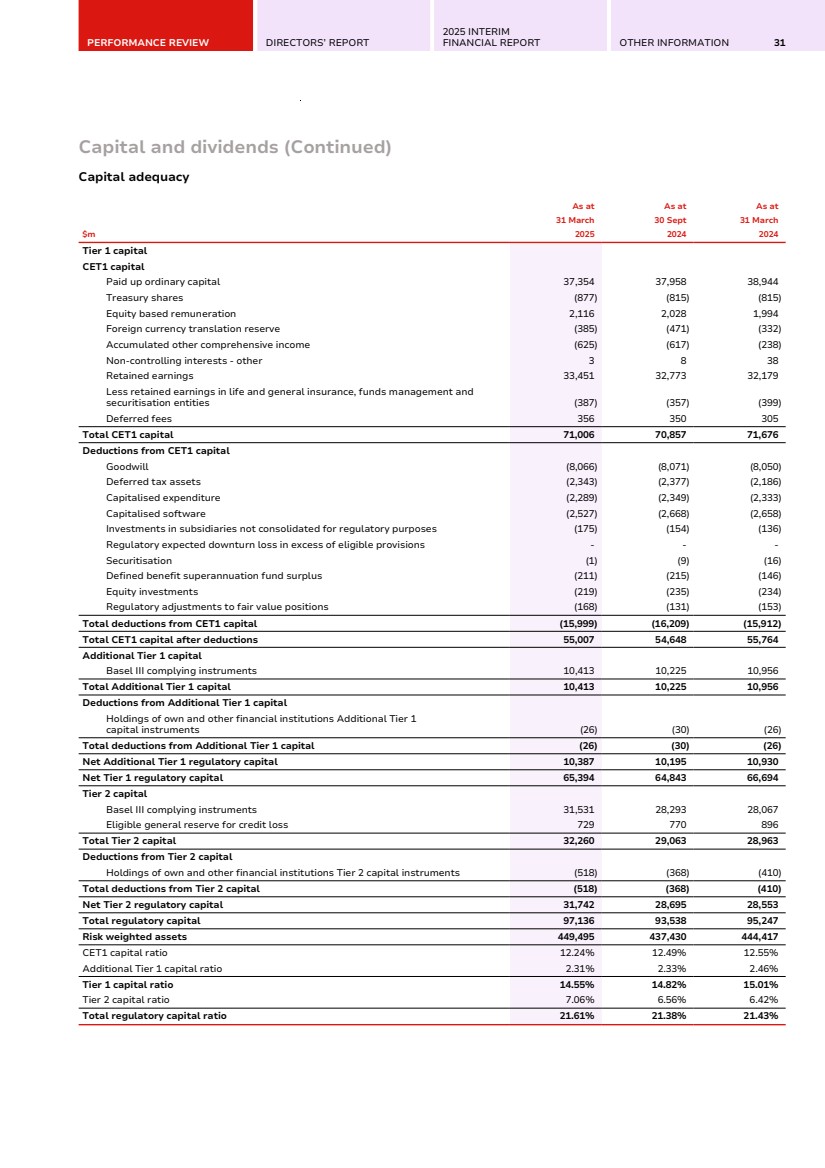
| 32 WESTPAC GROUP 2025 INTERIM FINANCIAL RESULTS GROUP PERFORMANCE Capital and dividends (Continued) Dividends Half Year Half Year Half Year % Mov't March Sept March Mar 25 Mar 25 2025 2024 2024 - Sept 24 - Mar 24 Ordinary dividend - Interim (cents per share) 76 - 75 - 1 Ordinary dividend - Final (cents per share) - 76 - (100) - Total ordinary dividend (cents per share) 76 76 75 - 1 Special dividend (cents per share) - - 15 - (100) Ordinary dividend payout ratio 78.39% 71.60% 77.83% large 56 bps Ordinary dividend payout ratio (ex Notable Items) 75.22% 72.41% 74.19% 281 bps 103 bps Adjusted franking credit balance ($m) 3,522 3,504 3,321 1 6 The Board has determined to pay a fully franked 2025 interim ordinary dividend of 76 cents per share, to be paid on 27 June 2025 to shareholders on the register at the record date of 9 May 2025. The 2025 interim ordinary dividend represents a payout ratio of 78.39%. In addition to being fully franked, the 2025 interim ordinary dividend will carry NZ$0.06 in New Zealand imputation credits that may be used by New Zealand tax residents. The Board has determined to satisfy the DRP for the 2025 interim ordinary dividend by arranging for the purchase of shares in the market by a third party. The market price used to determine the number of shares to be provided to DRP participants will be set over the 17 trading days commencing 14 May 2025 and will not include a discount. |
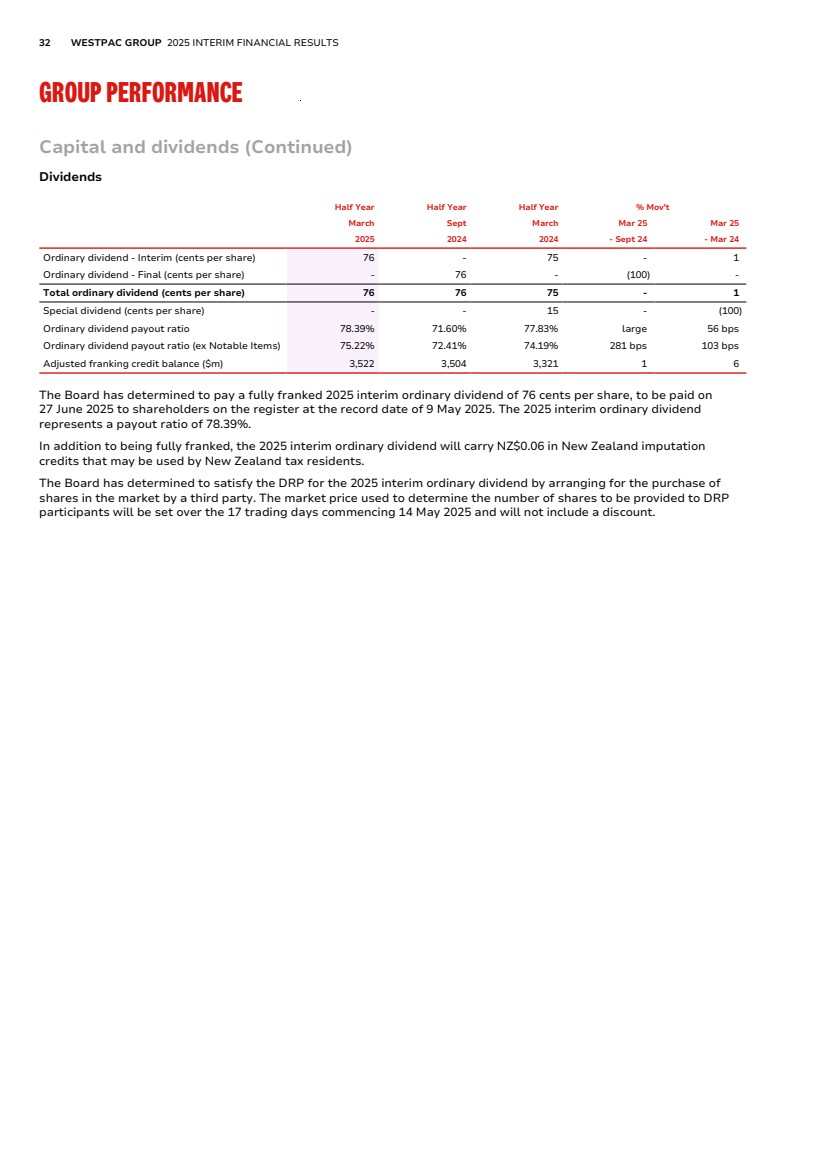
| PERFORMANCE REVIEW DIRECTORS’ REPORT 2025 INTERIM FINANCIAL REPORT OTHER INFORMATION 33 Sustainability performance Westpac’s sustainability approach Our Sustainability Strategy is aligned to our Purpose and designed to create better futures for our people, customers, communities and the environment. It is guided by the UN Sustainable Development Goals and supported by a broad range of policies, procedures, and plans which are detailed on our website. It has six objectives: enhancing financial inclusion and equality; strengthening data security and protection; becoming a net-zero, climate resilient bank; becoming a nature positive bank; respecting and advancing human rights; and enabling diversity and inclusion. Our sustainability disclosures are available on our website, of which most are updated and reported annually. Our Sustainability Index and Datasheet consolidates most of our sustainability metrics and outlines our alignment with key reporting initiatives including the Global Reporting Initiative, and initiatives led by the International Sustainability Standards Board. First Half 2025 highlights • Elevated the role of the newly appointed Chief Sustainability Officer to report directly to the CEO; • Included sustainability and climate-related measures in the Group Short Term Variable Reward Scorecard for the CEO and certain Group Executives; • Continued engagement via a Sustainability Market Update and a separate Sustainability Town Hall with approximately 4,800 employees participating; • Released our 2024 Modern Slavery Statement, outlining our actions to assess and address risks across our operations and supply chain; • Completed a Human Rights Risk Assessment which reviewed salient human rights risks to help us mitigate possible impacts across our operations and supply chain; • Launched a Safety by Design Toolkit, in collaboration with the Australian Banking Association (ABA), to support banks in designing products and services with safeguards aimed at mitigating financial harms such as hardship, loss or abuse; • Launched Australia’s first Social Tailored Deposit to help fund lending that seeks to improve specific social issues; • Provided 278 disaster relief packages to support customers impacted by Ex-Tropical Cyclone Alfred; • Published our 2024 Westpac New Zealand Climate Report, the first report under the mandatory Aotearoa New Zealand Climate Standards; and • Released the Westpac New Zealand 2027 Sustainability Commitments which are focused on: supporting a low-emissions, climate-resilient, and nature positive future; enhancing financial inclusion and independence; and helping customers and local communities thrive. Climate strategy Our 2024 Climate Report outlines our ambition to become a net-zero, climate resilient bank, with three areas of focus. 1. Net-zero and climate resilience in our operations In Full Year 2024 we achieved our 2030 target of a 76% reduction in scope 1 and 2 absolute emissions from our 2021 baseline, six years ahead of schedule. We also reached our objective of sourcing the equivalent of 100% of our direct operational Australian electricity demand from renewables, 12 months ahead of plan. First Half 2025 highlights: • Continued to source the equivalent of 100% of our direct electricity demand from renewables in Australia; • Helped employees reduce their carbon footprint through the launch of two additional renewable electricity offers in partnership with Flow Power and Energy Australia; • Sought to further reduce waste to landfill from our Victoria and New South Wales corporate sites through new collection services for soft plastics and other hard-to-recycle materials; and • Retired carbon credits to offset our 2024 residual direct operational emissions as required under the Australian Government's Climate Active Carbon Neutral standard for Organisations. Certification for Australia for 2024 is pending. Maintained Toitū Net Carbon Zero certification for our New Zealand direct operations since 2019. |
| 34 WESTPAC GROUP 2025 INTERIM FINANCIAL RESULTS GROUP PERFORMANCE Sustainability performance (Continued) Progress on direct operational emissions and renewable energy targets First Half 2025 (estimated) Full Year 2024 Full Year 2021 baseline Market-based direct operational Scope 1 and Scope 2 greenhouse gas (GHG) emissionsa,b before carbon credits (tCO2-e) 3,703 8,565 62,360 Reduction to 2021 baseline (Half Year annualised) (%) (88) (86) n/a Share of Australian operational electricity demand sourced from renewables (% equivalent)b 100 100 n/a Share of global operational electricity demand sourced from renewables (% equivalent, RE100)b 96 96 n/a a. For our scope 1 & 2 direct operational emissions we are using a market-based accounting method for emissions calculation. The 2021 baseline for this target was adjusted for COVID-19 pandemic and other impacts. b. Refer to our 2024 Sustainability Index and Datasheet for metric definition. For our Pacific Island businesses, Westpac surrendered additional large-scale generation certificates (LGCs) in the Australian market to achieve the equivalent of 100% renewable electricity sourced globally. 2. Supporting customers’ transition to net-zero and to build their climate resilience We have 13 interim 2030 emission targets across all nine emissions-intensive sectors under our NZBA commitment, as detailed in our 2024 Climate Report. First Half 2025 highlights: • Continued to engage customers on their climate transition plans and refined our engagement approach, focusing more on climate opportunities and sharing insights; • Completed ESG risk assessments for more than 5,000 Australian commercial banking customers (circa 3,800 since October 2024), and our 50 largest business customers in Fiji and PNG; • Increased sustainable finance lending1 to $33.3 billion at 31 March 2025 (up 16% since September 2024); • Increased sustainable bond facilitation by $3.2 billion in First Half 2025 (up 20% since 30 September 2024), bringing total facilitation to $19.1 billion since October 20212 ; and • Made progress on other sustainable products and services outside our Sustainable Finance Framework including providing 739 loans for EV/hybrid vehicles to Australian customers totalling $31 million. Green Tailored Deposits decreased to $1.34 billion at 31 March 2025 ($1.97 billion at 30 September 2024) as customers opted for shorter dated deposit products. These Deposits are not available for terms less than six months. 3. Collaborate for impact on initiatives towards net-zero and climate resilience We participated in a range of sustainability discussions and initiatives, including with ABA, ASIC, APRA, ASFI, New Zealand’s FMA, NZBA and UNEP FI3 . 1. Total committed exposure, or balance for mortgages, assessed as sustainable finance in accordance with our Sustainable Finance Framework at 31 March 2025. 2. Bond facilitation target and progress is measured as the cumulative sum of our proportionate share of qualifying bonds facilitated from 1 October 2021. Prior years are restated following data quality reviews which identified additional bonds not previously included. 3. The Australian Banking Association, the Australian Securities and Investments Commission, the Australian Prudential Regulation Authority, the Australian Sustainable Finance Institute, the New Zealand Financial Markets Authority, the Net-Zero Banking Alliance and the UN Environment Programme Finance Initiative. |
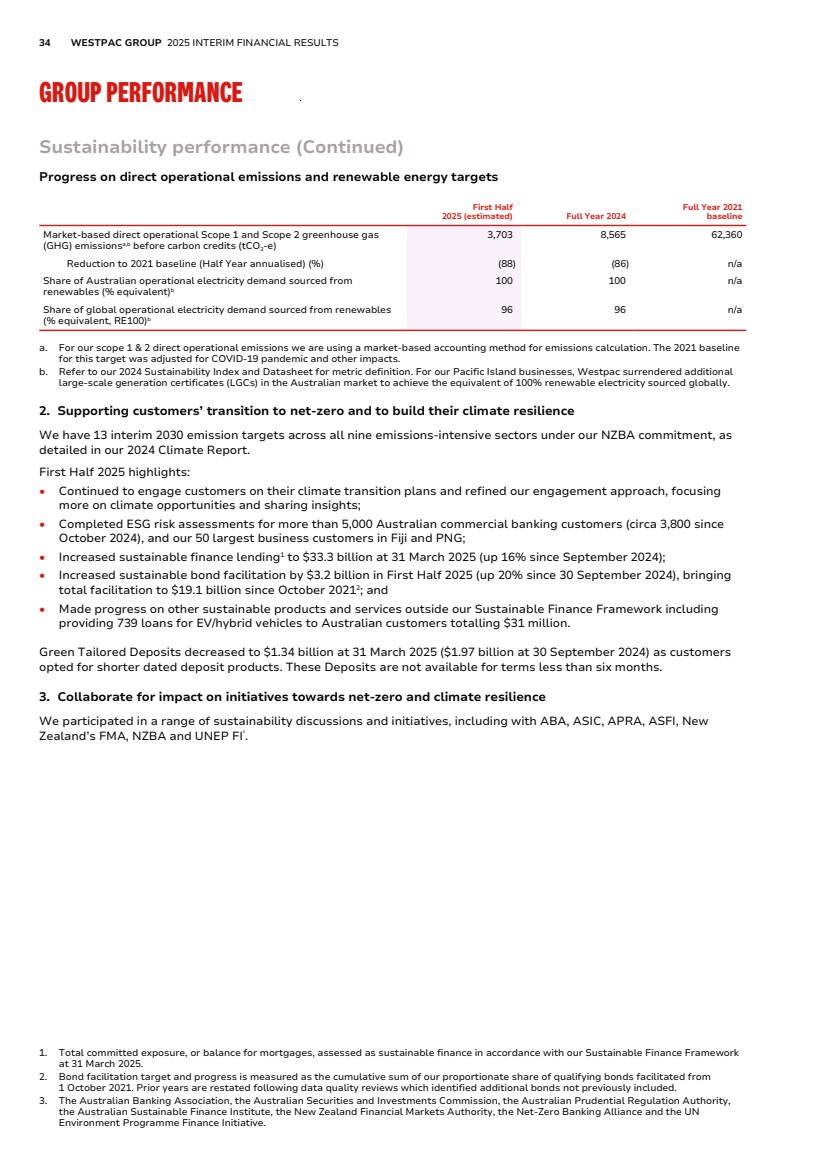
| PERFORMANCE REVIEW DIRECTORS’ REPORT 2025 INTERIM FINANCIAL REPORT OTHER INFORMATION 35 SEGMENT REPORTING For reporting purposes, Westpac identifies the impact of Notable Items on income and expenses and includes a subtotal titled “Pre-provision profit”. Pre-provision profit represents profit before impairment charges and income tax expenses. Consumer Business & Wealth Westpac Institutional Bank Westpac New Zealand (A$) $m a Group Businesses Group Half Year March 2025 Net interest income 3,852 2,697 1,177 1,236 607 9,569 Non-interest income 280 396 619 121 8 1,424 Notable Items - - - (1) (199) (200) Net operating income 4,132 3,093 1,796 1,356 416 10,793 Operating expenses (2,420) (1,368) (791) (665) (454) (5,698) Total operating expenses (2,420) (1,368) (791) (665) (454) (5,698) Pre-provision profit 1,712 1,725 1,005 691 (38) 5,095 Impairment (charges)/benefits (142) (117) 39 (30) - (250) Profit before income tax (expense)/benefit 1,570 1,608 1,044 661 (38) 4,845 Income tax (expense)/benefit and NCIb (482) (490) (286) (185) (85) (1,528) Net profit/(loss) 1,088 1,118 758 476 (123) 3,317 Net profit includes impact of: Notable Items (post tax)b - - - (1) (139) (140) Half Year September 2024 Net interest income 3,861 2,722 1,150 1,217 615 9,565 Non-interest income 273 389 599 135 (14) 1,382 Notable Items - - - (2) 53 51 Net operating income 4,134 3,111 1,749 1,350 654 10,998 Operating expenses (2,422) (1,370) (756) (616) (385) (5,549) Total operating expenses (2,422) (1,370) (756) (616) (385) (5,549) Pre-provision profit 1,712 1,741 993 734 269 5,449 Impairment (charges)/benefits (104) (47) (19) (3) (2) (175) Profit before income tax (expense)/benefit 1,608 1,694 974 731 267 5,274 Income tax (expense)/benefit and NCIb (482) (513) (288) (203) (140) (1,626) Net profit/(loss) 1,126 1,181 686 528 127 3,648 Net profit includes impact of: Notable Items (post tax)b - - - (2) 43 41 a. Refer to Westpac New Zealand NZ$ segment reporting (page 46) for further details. b. Includes tax benefit on Notable Items of $60 million in First Half 2025 (Second Half 2024: $10 million expense). |
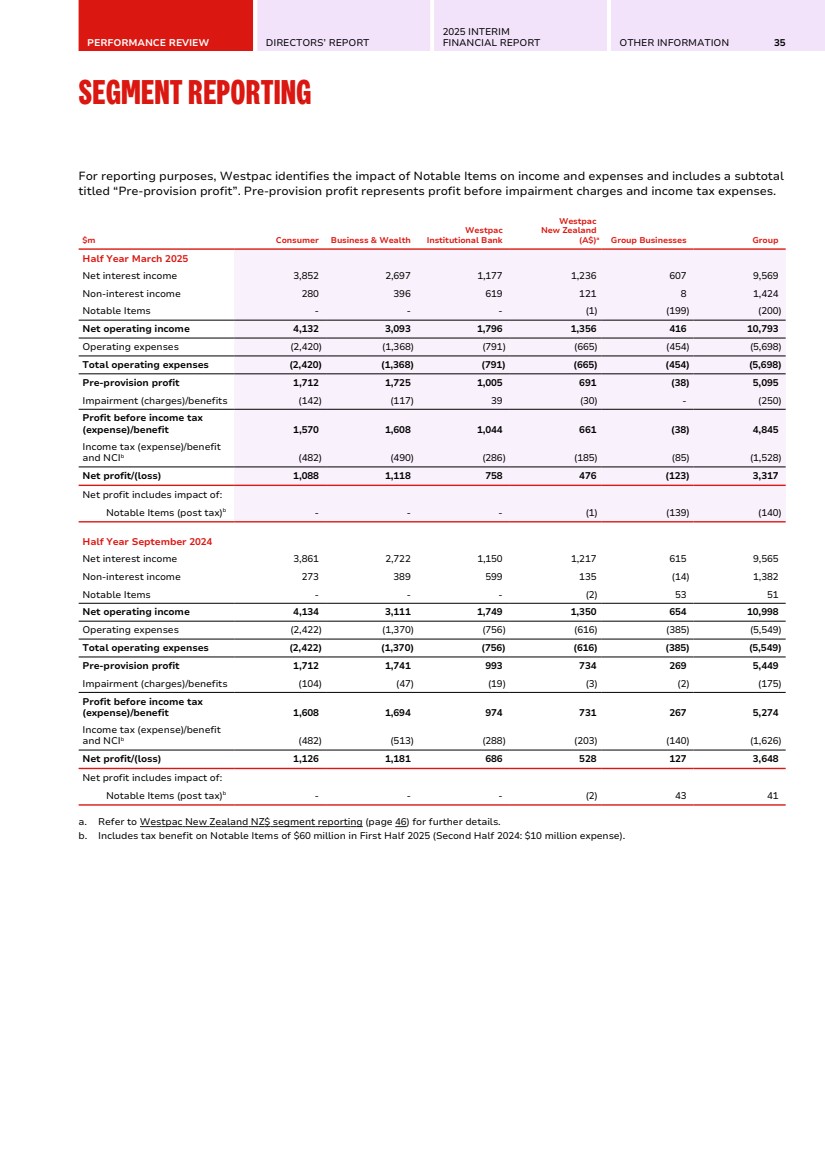
| 36 WESTPAC GROUP 2025 INTERIM FINANCIAL RESULTS SEGMENT REPORTING Consumer Business & Wealth Westpac Institutional Bank Westpac New Zealand (A$) $m a Group Businesses Group Half Year March 2024 Net interest income 3,771 2,616 1,090 1,171 703 9,351 Non-interest income 255 409 666 122 13 1,465 Notable Items - - - (6) (220) (226) Net operating income 4,026 3,025 1,756 1,287 496 10,590 Operating expenses (2,365) (1,256) (709) (646) (419) (5,395) Total operating expenses (2,365) (1,256) (709) (646) (419) (5,395) Pre-provision profit 1,661 1,769 1,047 641 77 5,195 Impairment (charges)/benefits (144) (95) (101) (22) - (362) Profit before income tax (expense)/benefit 1,517 1,674 946 619 77 4,833 Income tax (expense)/benefit and NCIb (459) (499) (265) (174) (94) (1,491) Net profit/(loss) 1,058 1,175 681 445 (17) 3,342 Net profit includes impact of: Notable Items (post tax)b - - - (4) (160) (164) a. Refer to Westpac New Zealand NZ$ segment reporting (page 46) for further details. b. Includes tax benefit on Notable Items of $62 million. |
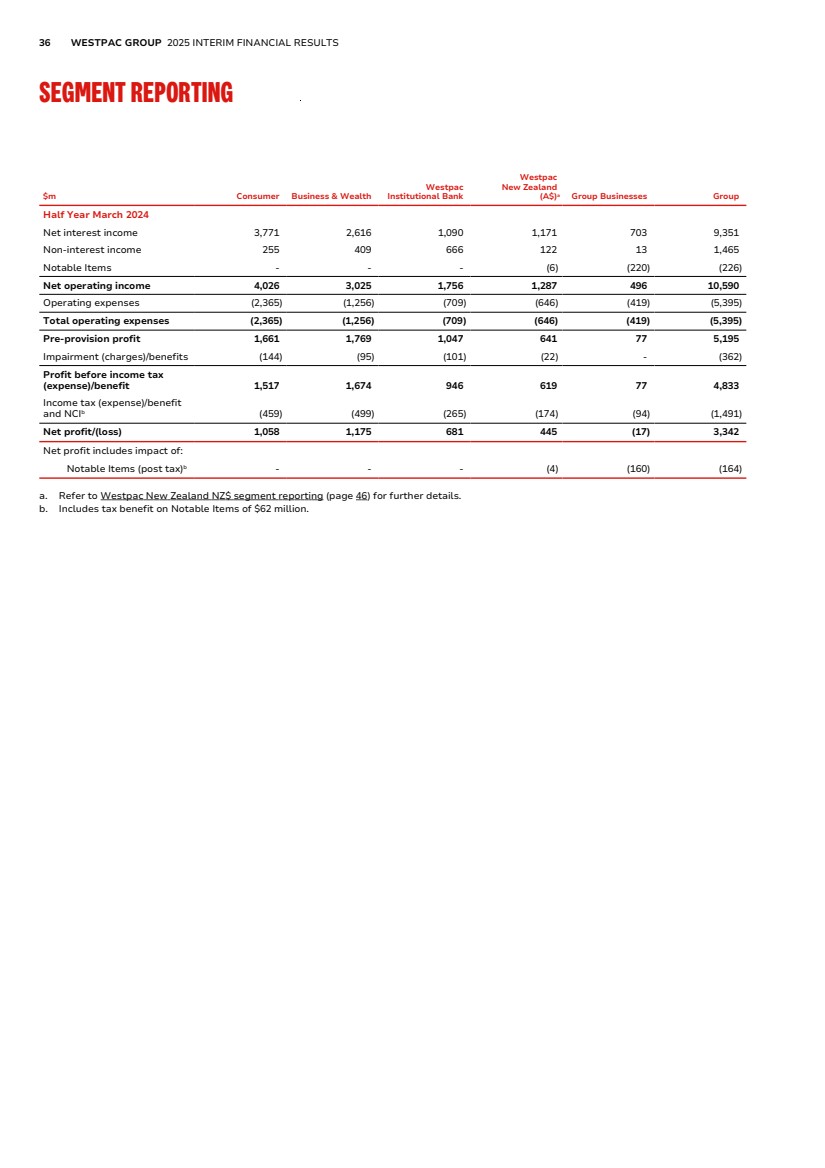
| PERFORMANCE REVIEW DIRECTORS’ REPORT 2025 INTERIM FINANCIAL REPORT OTHER INFORMATION 37 Consumer The Consumer segment provides banking products and services to customers in Australia. Products and services are provided through a portfolio of brands comprising Westpac, St.George, BankSA and Bank of Melbourne using digital channels, call centres, mobile bankers, branches and third-party brokers. It also includes the RAMS business, which is closed to new business. Half Year Half Year Half Year % Mov't March Sept March Mar 25 Mar 25 $m 2025 2024 2024 - Sept 24 - Mar 24 Net interest income 3,852 3,861 3,771 - 2 Non-interest income 280 273 255 3 10 Net operating income 4,132 4,134 4,026 - 3 Operating expenses (2,420) (2,422) (2,365) - 2 Total operating expenses (2,420) (2,422) (2,365) - 2 Pre-provision profit 1,712 1,712 1,661 - 3 Impairment (charges)/benefits (142) (104) (144) 37 (1) Profit before income tax expense 1,570 1,608 1,517 (2) 3 Income tax expense and NCI (482) (482) (459) - 5 Net profit 1,088 1,126 1,058 (3) 3 Expense to income ratio 58.57% 58.59% 58.74% (2 bps) (17 bps) Net interest margin 1.70% 1.70% 1.69% - 1 bps As at As at As at % Mov't 31 March 30 Sept 31 March Mar 25 Mar 25 $bn 2025 2024 2024 - Sept 24 - Mar 24 Customer deposits Transactions 46.3 46.6 47.4 (1) (2) Savings 170.5 159.0 148.0 7 15 Term 66.2 65.6 66.0 1 - Mortgage offsets 68.0 63.3 59.9 7 14 Total customer deposits 351.0 334.5 321.3 5 9 Loans Housing 484.6 473.5 461.9 2 5 RAMS (in runoff) 25.6 29.8 33.3 (14) (23) Other 8.8 8.8 9.0 - (2) Provisions (1.8) (1.8) (1.8) - - Total loans 517.2 510.3 502.4 1 3 Deposit to loan ratio 67.86% 65.54% 63.95% 232 bps 391 bps Total assets 529.0 521.8 514.7 1 3 TCE 600.6 594.2 586.4 1 2 Risk weighted assets 165.1 174.4 174.8 (5) (6) Average interest earning assets 454.9 453.7 446.1 - 2 Average allocated capital 23.3 24.0 24.0 (3) (3) Credit quality Impairment charges/(benefits) to average loans 0.06% 0.04% 0.06% 2 bps - Mortgage 90+ day delinquencies 0.86% 1.12% 1.06% (26 bps) (20 bps) Other consumer loans 90+ day delinquencies 1.28% 1.23% 1.17% 5 bps 11 bps Total stressed exposures to TCE 0.99% 1.10% 1.04% (11 bps) (5 bps) |

| 38 WESTPAC GROUP 2025 INTERIM FINANCIAL RESULTS SEGMENT REPORTING Consumer (Continued) First Half 2025 – Second Half 2024 Net profit decreased 3% to $1,088 million. Pre-provision profit was stable at $1,712 million. Flat operating income reflected a stable net interest margin while flat operating expenses reflected lower costs from a smaller property footprint and seasonally lower investment spend offset by higher salaries and wages and technology spend including the step up in UNITE investment. Net interest income flat • The net interest margin was stable at 1.70%. Key drivers included: – Lending competition to both retain and attract new mortgage customers was partly offset by higher lending spreads as customers switched from lower spread fixed rate mortgages to higher spread variable rate mortgages; – A deposit mix shift towards higher interest rate, lower margin savings accounts which was offset by higher returns on hedged deposits; – Higher funding costs from the widening of the spread between the bank bill and overnight index swap rates; and – Higher returns on hedged capital provided a benefit to margin. • Net loans increased by 1% to $517.2 billion. Mortgage growth of 1% was below APRA housing system growth, reflecting the decision to close RAMS to new business. Excluding this impact, mortgages grew 2%, representing 0.9x system; • Deposits were up 5% to $351.0 billion representing 1.0x APRA household deposits system growth. Savings accounts grew by $11.5 billion as customer preference shifted towards higher yielding flexible products. Mortgage offset balances rose 7% to $68.0 billion, as customers continue to recognise the benefits of offset accounts; and • Deposit to loan ratio improved 232 basis points as customer deposit growth exceeded lending growth and provided the main source of new funding. Non-interest income up 3% • Non-interest income was up 3% with higher credit card fees partly offset by lower account keeping and settlement fees. Expenses flat • Operating expenses were flat reflecting: – Benefits from a simpler operating model and a smaller property footprint, including branches and ATMs; – The step up in UNITE spend partly offset by seasonally lower spend across other investments; – Higher salaries and wages and higher technology costs as we responded to additional demand and delivered new capabilities; and – Costs related to the closure of RAMS to new business were lower than Second Half 2024. Impairment charge of $142 million • Impairment charges to average loans were 6 basis points, up 2 basis points from the prior period. The charge reflects an increase in the downside scenario weight and write-offs in cards and personal lending, partly offset by lower underlying delinquencies. • Stressed exposure to TCE improved by 11 basis points to 0.99% reflecting the continued resilience of customers. Mortgage 90+ day delinquencies decreased 26 basis points to 0.86% due to a reduction in hardship and a change to serviceability treatment. Other consumer loan 90+ day delinquencies increased 5 basis points to 1.28%. |

| PERFORMANCE REVIEW DIRECTORS’ REPORT 2025 INTERIM FINANCIAL REPORT OTHER INFORMATION 39 Consumer (Continued) First Half 2025 – First Half 2024 Net profit increased 3% to $1,088 million. Pre-provision profit increased 3% to $1,712 million with operating income up 3% and operating expense growth of 2%. The improvement in operating income was driven by solid balance sheet growth and a 1 basis point increase in the net interest margin. The rise in operating expenses reflected higher salaries and wages and technology costs including a step up in UNITE spend partly offset by productivity benefits. Net interest income up 2% • The net interest margin increased 1 basis point. Key drivers included: – Lower lending spreads as competition to both retain and attract new mortgage customers was partly offset by customers switching from lower spread fixed rate mortgages to higher spread variable rate mortgages; – Flat deposit spreads as a mix shift towards higher interest rate, lower margin savings accounts was offset by higher returns on hedged deposits; – Higher funding costs primarily due to the widening of the spread between the bank bill and overnight index swap rates and maturing TFF being replaced with more expensive wholesale funding; and – Higher returns on hedged capital balances provided a benefit. • Net loans increased by 3% to $517.2 billion. Mortgage growth of 5%, excluding RAMS, was mostly achieved in owner occupied variable rate mortgages. Variable rate mortgages increased from 85% to 95% of the portfolio with most of the $46.6 billion of expiring fixed rate loans being retained and rolling onto variable rates, coupled with almost all new loans on variable rates; • Deposits were up 9% to $351.0 billion. Growth was mostly in savings with balances increasing by $22.5 billion as customers continued to shift towards higher yielding products. Term deposits were flat as customers largely preferred the flexibility of similar rate saving accounts. Mortgage offset balances rose by 14% to $68.0 billion, as almost all new loans were to variable rate mortgages with an offset feature; and • With deposit growth continuing to exceed loan growth, the deposit to loan ratio improved 391 basis points to 67.9%. Non-interest income up 10% • Non-interest income rose 10% to $280 million driven by higher currency conversion fees from a rise in overseas card spend and an increase in annual credit card fees. Expenses up 2% • Operating expenses increased 2% to $2,420 million. Key drivers included: – Higher salaries and wages and higher technology costs as we responded to additional demand and delivered new capabilities; – Increased UNITE investment spend, that was partly offset by the completion of investments in the prior corresponding period. • Expense increases were partly offset by the benefits from a simpler operating model and a smaller property footprint, including branches and ATMs. Impairment charge of $142 million • Impairment charge to average loans of 6 basis points was flat to the prior corresponding period. The charge reflects an increase in the downside scenario weight and write-offs in cards and personal lending. • Stressed exposure to TCE improved by 5 basis points to 0.99%. Mortgage 90+ day delinquencies decreased 20 basis points reflecting fewer customers needing hardship support and a change to the serviceability treatment. Other consumer loan 90+ day delinquencies increased 11 basis points. |
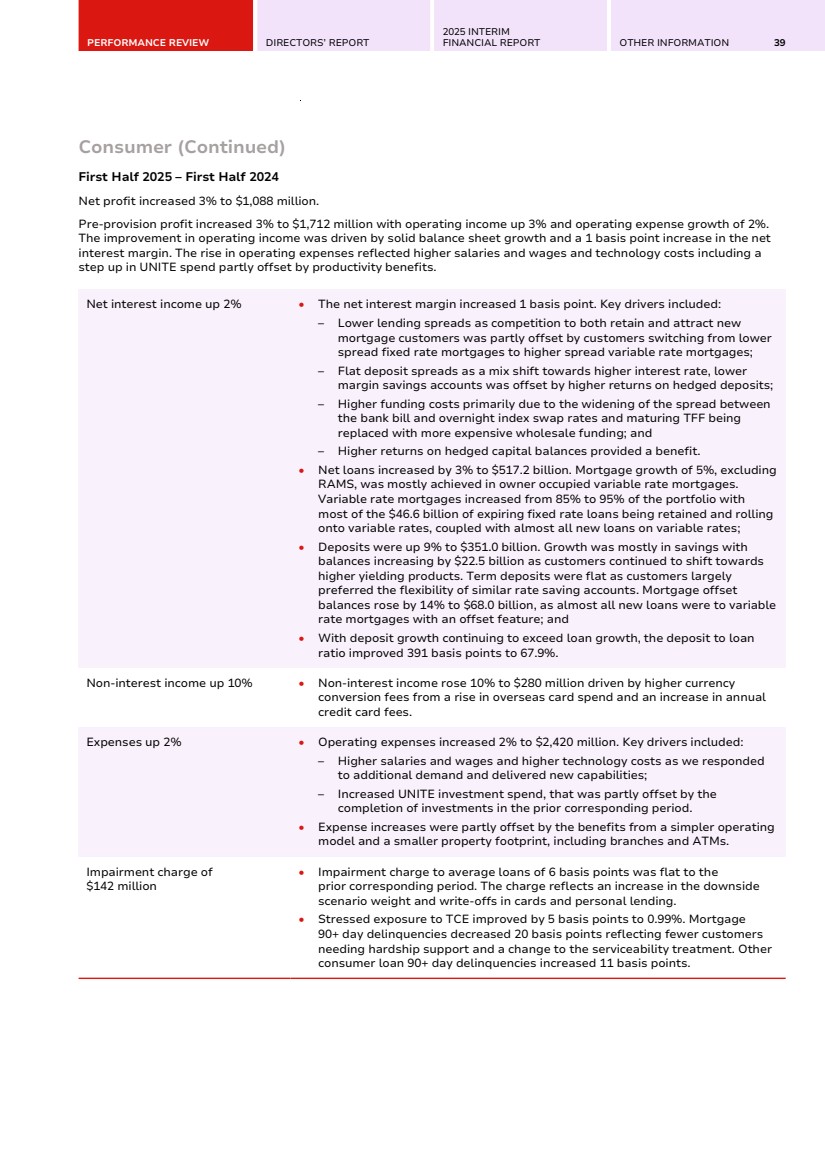
| 40 WESTPAC GROUP 2025 INTERIM FINANCIAL RESULTS SEGMENT REPORTING Business & Wealth The Business & Wealth segment provides banking products and services to customers in Business Banking, Wealth Management, Private Wealth and Westpac Pacific. Business Banking offers lending generally up to $200 million in exposure, merchant services using eCommerce solutions and transaction banking services. Customers are categorised by commercial businesses, small to medium businesses and agribusiness. The segment includes Private Wealth, supporting the needs of high-net-worth individuals, as well as BT Financial Group, which provides wealth management platform services. It also includes Westpac Pacific and for part of the period included our auto finance portfolio, which has been in runoff and was sold in March 2025. The segment operates under the Westpac, St.George, BankSA, Bank of Melbourne and BT brands. Half Year Half Year Half Year % Mov't March Sept March Mar 25 Mar 25 $m 2025 2024 2024 - Sept 24 - Mar 24 Net interest income 2,697 2,722 2,616 (1) 3 Non-interest income 396 389 409 2 (3) Net operating income 3,093 3,111 3,025 (1) 2 Operating expenses (1,368) (1,370) (1,256) - 9 Total operating expenses (1,368) (1,370) (1,256) - 9 Pre-provision profit 1,725 1,741 1,769 (1) (2) Impairment (charges)/benefits (117) (47) (95) 149 23 Profit before income tax expense 1,608 1,694 1,674 (5) (4) Income tax expense and NCI (490) (513) (499) (4) (2) Net profit 1,118 1,181 1,175 (5) (5) Expense to income ratio 44.23% 44.04% 41.52% 19 bps 271 bps Net interest margin 5.09% 5.37% 5.34% (28 bps) (25 bps) As at As at As at % Mov't 31 March 30 Sept 31 March Mar 25 Mar 25 $bn 2025 2024 2024 - Sept 24 - Mar 24 Customer deposits Transactions 65.6 65.2 62.9 1 4 Savings 30.5 29.1 30.1 5 1 Term 52.1 50.0 47.6 4 9 Total customer deposits 148.2 144.3 140.6 3 5 Loans Commercial/SME 105.8 99.1 93.0 7 14 Pacific 1.5 1.3 1.3 15 15 Business lending 107.3 100.4 94.3 7 14 Other 1.4 1.4 1.4 - - Auto financea - 2.1 3.1 (100) (100) Provisions (1.9) (1.9) (1.9) - - Total loans 106.8 102.0 96.9 5 10 Deposit to loan ratio 138.74% 141.48% 145.10% (274 bps) large Total assets 112.1 107.1 102.4 5 9 TCE 141.9 137.8 131.2 3 8 Risk weighted assets 91.3 92.9 89.1 (2) 2 Average interest earning assets 106.2 101.3 98.0 5 8 Average allocated capital 12.0 11.7 11.5 3 4 Total funds 152.1 150.8 147.0 1 3 Credit quality Impairment charges/(benefits) to average loans 0.22% 0.09% 0.20% 13 bps 2 bps Impaired exposures to TCE 0.57% 0.68% 0.54% (11 bps) 3 bps Total stressed exposures to TCE 5.26% 5.56% 5.52% (30 bps) (26 bps) a. Portfolio was sold in March 2025. Balances included personal and business auto finance loans. |
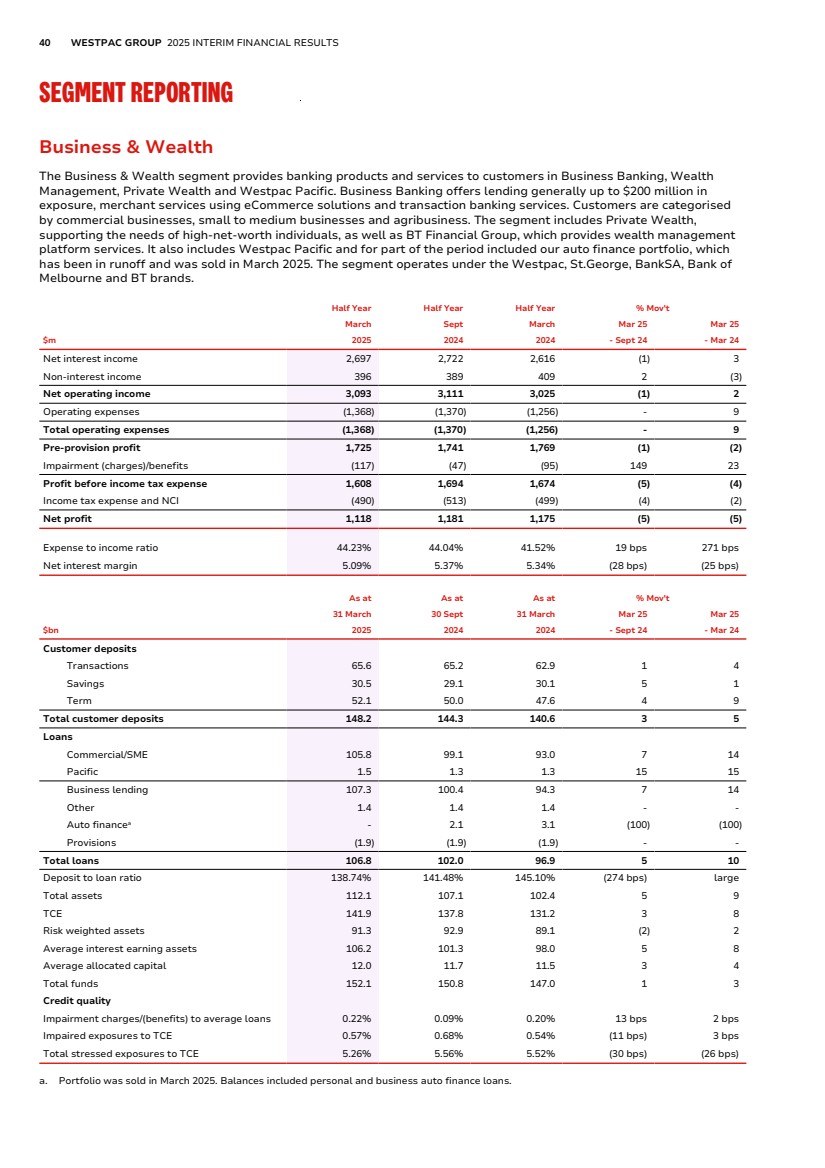
| PERFORMANCE REVIEW DIRECTORS’ REPORT 2025 INTERIM FINANCIAL REPORT OTHER INFORMATION 41 Business & Wealth (Continued) First Half 2025 – Second Half 2024 Net profit decreased 5% to $1,118 million. Pre-provision profit decreased 1% to $1,725 million reflecting a 1% decline in operating income and flat operating expenses. Excluding a provision release in Second Half 2024, operating income increased 1% supported by 5% lending growth which was largely offset by a 28 basis point lower net interest margin. For operating expenses, higher UNITE costs were offset by lower litigation and restructuring costs. Net interest income down 1% • The net interest margin contracted 28 basis points. This included the impact of provision releases in the prior period and the completion of the sale of the auto finance portfolio in First Half 2025. These items detracted 6 basis points. Excluding these items, drivers in descending order were: – Unfavourable portfolio mix as lending growth outpaced deposit growth, reflected in a lower deposit to loan ratio; – The mix shift towards lower margin term deposits and an increase in customers switching to higher yielding accounts. Higher returns on hedged deposits partly offset these impacts; – Lower lending spreads reflecting competitive market dynamics; and – Higher returns on hedged capital balances provided a benefit to margin. • Net loans increased 5% to $106.8 billion. Business lending grew 7% with growth across most sectors. Target sectors of health, professional services and agriculture all performed well, growing between 8% and 12%. This was partly offset by the wind down and subsequent sale of the $2.1 billion auto finance portfolio; and • Deposits were up 3% to $148.2 billion. The business grew both term deposits and at-call balances, with term deposits increasing $2.1 billion and at-call up $1.8 billion. Within the business segment, growth was in commercial, private wealth and small to medium business. Micro business balances decreased slightly due to softer economic and trading conditions. Non-interest income up 2% • Non-interest income increased 2%, including a $8 million net loss on sale of the auto finance portfolio. Excluding this impact, non-interest income increased 4% reflecting higher platform revenue and lending volume which was partly offset by lower merchants income reflecting lower customer spend. Expenses flat • Operating expenses were flat reflecting: – Lower litigation and restructuring costs; – The step up in UNITE investment which was partly offset by seasonally lower investment spend across other projects; and – Higher salaries and wages including an investment in 73 business bankers to drive growth and coverage. Impairment charge of $117 million • The impairment charge of 22 basis points of average loans compared to 9 basis points in the prior period. The charge reflected new IAPs in the trade and property services sectors, a small CAP charge from an increase in the downside scenario weight and higher overlays. • Credit quality metrics improved with stressed exposures to TCE decreasing 30 basis points to 5.26%, mostly within the property and retail trade sectors. The proportion of impaired loans to TCE decreased 11 basis points to 0.57%. |
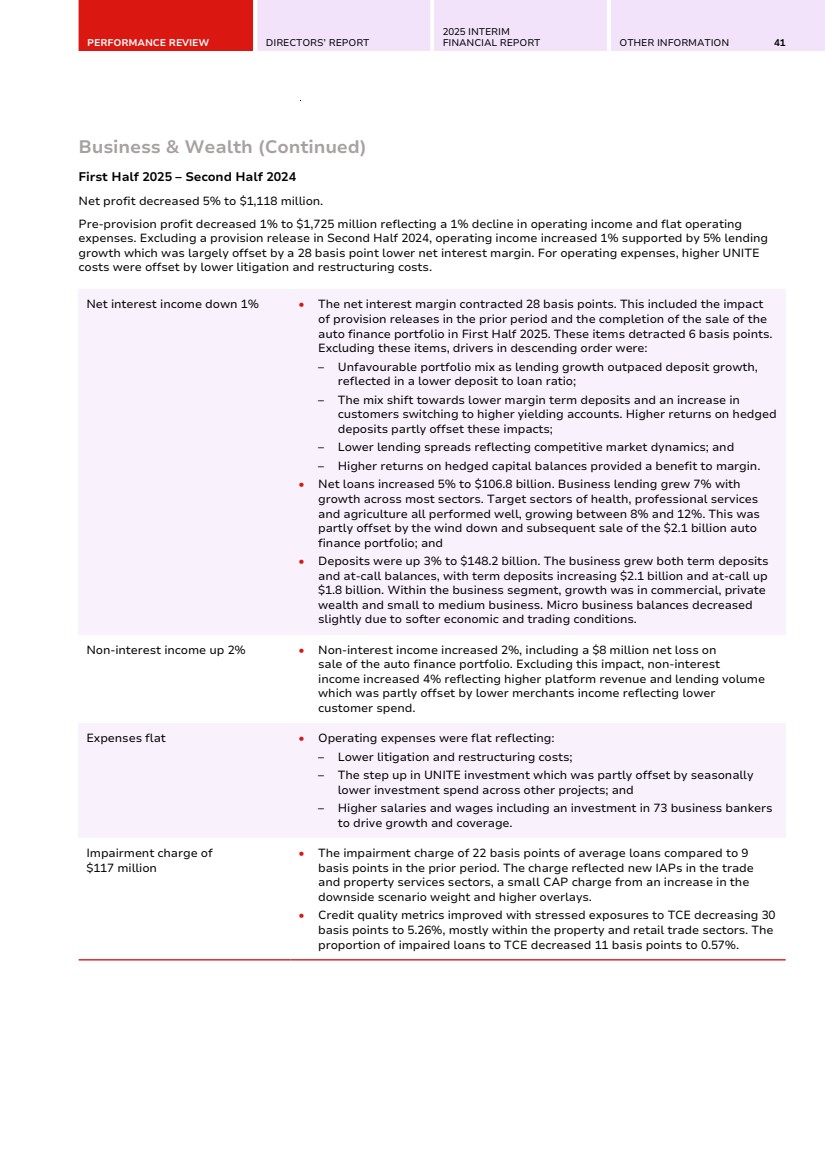
| 42 WESTPAC GROUP 2025 INTERIM FINANCIAL RESULTS SEGMENT REPORTING Business & Wealth (Continued) First Half 2025 – First Half 2024 Net profit decreased 5% to $1,118 million. Pre-provision profit decreased 2% to $1,725 million with a 2% increase in operating income more than offset by a 9% rise in operating expenses. Operating expenses increased reflecting higher investment spend in UNITE, higher wages and third party technology costs and 119 additional bankers. The rise in operating income from strong lending growth was tempered by a lower net interest margin. Net interest income up 3% • The net interest margin contracted 25 basis points. Drivers in descending order were: – Unfavourable portfolio mix as lending growth outpaced deposit growth, reflected in a lower deposit to loan ratio; – The mix shift towards lower margin term deposits and an increase in customers switching to higher yielding accounts. Higher returns on hedged deposits partly offset these impacts; – Lower lending spreads reflecting competitive market dynamics and the runoff of the higher margin auto finance portfolio; and – Higher returns on hedged capital balances provided a benefit to margin. • Net loans increased by 10% to $106.8 billion. Business lending growth of 14% was diversified with strong growth in target areas of health, professional services, agriculture and SME. This was partly offset by the runoff from the wind down and subsequent sale of the auto finance portfolio; and • Deposits increased 5% to $148.2 billion as the business grew both term deposits and at-call balances. Within the business segment, growth was in commercial, private wealth and small to medium business. Micro business balances decreased slightly due to softer economic and trading conditions. Non-interest income down 3% • Non-interest income decreased 3%. Excluding the impact of the loss on sale of the auto finance portfolio, income decreased 1% due to lower merchant income reflecting lower customer spend partly offset by higher platform revenue. Expenses up 9% • Operating expenses were up 9% reflecting: – The step up in UNITE investment; – Higher salaries and wages and third-party technology vendor costs; and – Investment in 119 additional business bankers to drive growth and coverage. Impairment charge of $117 million • The impairment charge of 22 basis points of average loans was an increase of 2 basis points from the prior corresponding period. The charge reflects new IAPs in the trade and property services sectors and a small CAP charge from an increase in the downside scenario weight and higher overlays. • Credit quality metrics improved with stressed exposures to TCE decreasing 26 basis points to 5.26%, mostly due to portfolio growth. The proportion of impaired loans to TCE increased 3 basis points to 0.57%. Platforms and Investments BT & Private Wealth platforms funds under administration increased 1% to $152.1 billion over the half reflecting higher equity markets. |
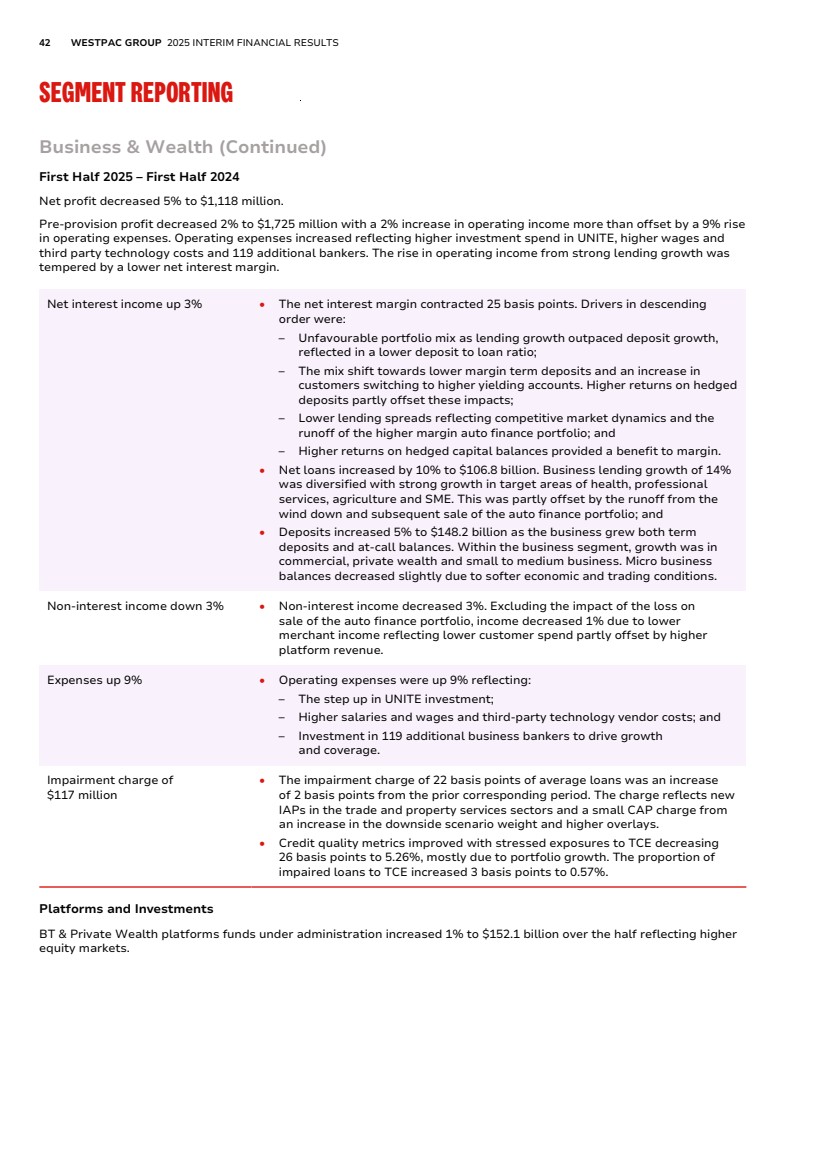
| PERFORMANCE REVIEW DIRECTORS’ REPORT 2025 INTERIM FINANCIAL REPORT OTHER INFORMATION 43 Westpac Institutional Bank (WIB) Westpac Institutional Bank (WIB) services predominantly corporate, institutional and government clients through three areas of specialisation: Corporate & Institutional Banking (CIB); Global Transaction Services (GTS); and Financial Markets (FM). CIB uses dedicated industry relationship and specialist product teams to support clients’ borrowing needs. GTS provides payments and liquidity management solutions to WIB’s clients and Westpac's domestic and international payments infrastructure. FM provides a range of risk management, investment and debt capital markets solutions to WIB clients and access to financial markets products for consumer and business customers. Clients are supported throughout Australia and via branches and subsidiaries located in New Zealand, New York, London, Frankfurt and Singapore. Half Year Half Year Half Year % Mov't March Sept March Mar 25 Mar 25 $m 2025 2024 2024 - Sept 24 - Mar 24 Net interest income 1,177 1,150 1,090 2 8 Non-interest income 619 599 666 3 (7) Net operating income 1,796 1,749 1,756 3 2 Operating expenses (791) (756) (709) 5 12 Total operating expenses (791) (756) (709) 5 12 Pre-provision profit 1,005 993 1,047 1 (4) Impairment (charges)/benefits 39 (19) (101) large large Profit before income tax expense 1,044 974 946 7 10 Income tax expense and NCI (286) (288) (265) (1) 8 Net profit 758 686 681 10 11 Expense to income ratio 44.04% 43.22% 40.38% 82 bps 366 bps Net interest margin 1.76% 1.82% 1.85% (6 bps) (9 bps) As at As at As at % Mov't 31 March 30 Sept 31 March Mar 25 Mar 25 $bn 2025 2024 2024 - Sept 24 - Mar 24 Customer deposits Transactions and others 66.5 64.2 66.2 4 - Savings 10.0 10.4 9.8 (4) 2 Term 45.8 45.2 39.3 1 17 Total customer deposits 122.3 119.8 115.3 2 6 Loans Loans 107.5 101.0 93.4 6 15 Provisions (0.5) (0.4) (0.4) 25 25 Total loans 107.0 100.6 93.0 6 15 Deposit to loan ratio 114.35% 119.10% 124.00% large large Total assets 140.6 137.2 123.1 2 14 TCE 231.0 216.2 215.7 7 7 Risk weighted assets 86.7 83.0 81.0 4 7 Average interest earning assets 134.2 126.6 117.9 6 14 Average allocated capital 10.3 9.7 9.6 6 7 Credit quality Impairment charges/(benefits) to average loans (0.07%) 0.04% 0.22% large large Impaired exposures to TCE 0.12% 0.05% 0.05% 7 bps 7 bps Total stressed exposures to TCE 0.78% 0.76% 0.63% 2 bps 15 bps |
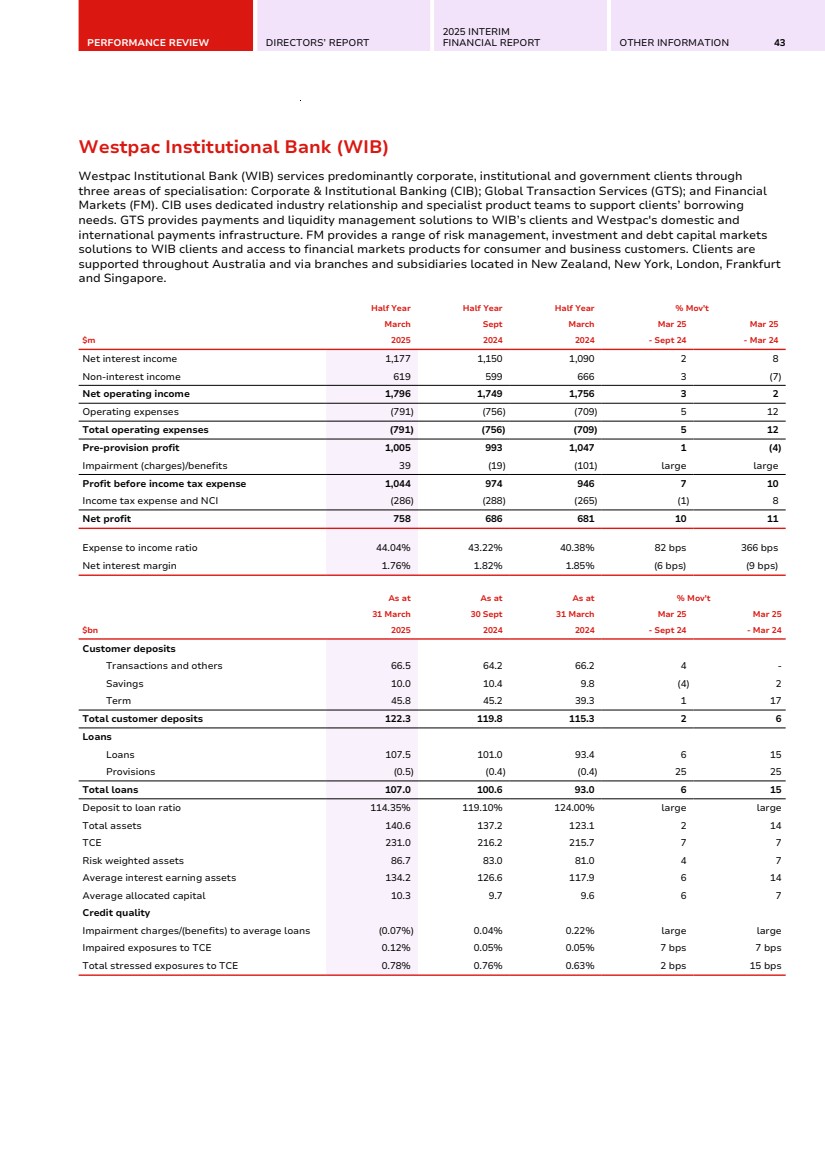
| 44 WESTPAC GROUP 2025 INTERIM FINANCIAL RESULTS SEGMENT REPORTING Westpac Institutional Bank (WIB) (Continued) Net operating income contribution1 Half Year Half Year Half Year % Mov't March Sept March Mar 25 Mar 25 $m 2025 2024 2024 - Sept 24 - Mar 24 Lending and deposit revenue 1,296 1,289 1,272 1 2 Sales and risk management income 421 391 455 8 (7) DVA (19) 4 (12) large 58 Othera 98 65 41 51 139 Net operating income contribution 1,796 1,749 1,756 3 2 a. Includes capital benefit and the Bank Levy. First Half 2025 – Second Half 2024 Net profit was up 10% to $758 million. Pre-provision profit increased 1% to $1,005 million, reflecting a 3% increase in operating income which was partly offset by a 5% rise in operating expenses. The growth in operating income reflects lending growth and higher earnings on capital partly offset by a lower net interest margin. The 5% increase in operating expenses was driven by higher investment spend and software amortisation in addition to higher staffing and third party vendor costs to support growth. Net interest income up 2% • The net interest margin decreased 6 basis points, including the benefit from lower trading securities in Markets. Excluding this, the net interest margin decreased 11 basis points reflecting an increase in funding costs as lending growth outpaced deposit growth, resulting in a lower deposit to loan ratio, and competitive market dynamics contracted loan spreads. This was partly offset by higher returns on hedged capital; • Net loans increased 6% to $107.0 billion from strengthening relationships with existing clients, predominantly in the energy, infrastructure, and property sectors; and • Deposits increased 2% to $122.3 billion driven by growth in transactional accounts and term deposits. The growth reflects a targeted strategy to maintain strength in the public sector, and to deepen customer relationships. Non-interest income up 3% • Non-interest income increased 3% to $619 million. Key drivers included: – Higher sales and risk management income including foreign exchange; – Higher fee income from increased underwriting activity and a larger loan book; and – A $21 million reduction from DVA. Expenses up 5% • Expenses increased 5% to $791 million. Movements reflected: – Higher salaries and wages and third-party technology vendor costs; and – Higher investment spend and software amortisation costs from prior investments, in particular payments. Impairment benefit of $39 million • The impairment benefit to average loans was 7 basis points, compared to a 4 basis point charge in the prior period. The benefit was driven by revisions to economic projections and upgrades to customer risk ratings. • Stressed exposures to TCE increased 2 basis points to 0.78%, reflecting higher watchlist exposures in the property sector. The proportion of impaired exposures to TCE increased 7 basis points to 0.12%, mostly in the services sector. 1. DVA includes Funding Value Adjustment (FVA) and Credit Value Adjustment (CVA). Sales and risk management income includes both customer and non-customer income. |
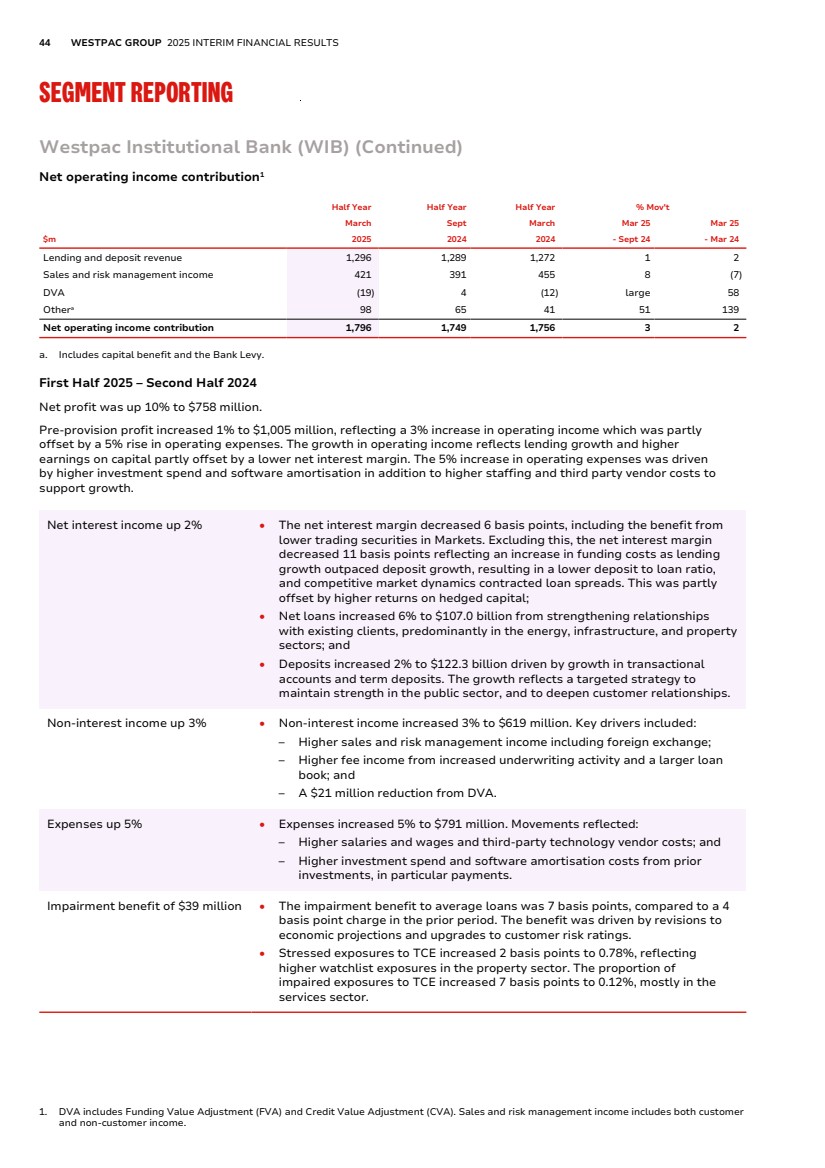
| PERFORMANCE REVIEW DIRECTORS’ REPORT 2025 INTERIM FINANCIAL REPORT OTHER INFORMATION 45 Westpac Institutional Bank (WIB) (Continued) First Half 2025 – First Half 2024 Net profit was up 11% to $758 million. Pre-provision profit decreased 4% to $1,005 million with a 2% increase in operating income more than offset by operating expense growth of 12%. The growth in operating income reflects lending and deposit growth and higher earnings on capital. The growth in operating expenses reflects higher investment spend and software amortisation and higher wages costs including more frontline bankers to support growth. Net interest income up 8% • The net interest margin was down 9 basis points, including the impact of an increase in trading securities to support customer activity in Markets. Excluding this, the net interest margin decreased 6 basis points reflecting an increase in funding costs as lending growth outpaced deposit growth, resulting in a lower deposit to loan ratio. This was partly offset by the benefit of higher returns on hedged capital; • Net loans increased 15% to $107.0 billion, driven by strengthening relationships with existing clients, predominantly in the energy, infrastructure, property, and industrial sectors. Offshore lending where there is a clear nexus to Australia or New Zealand also contributed to growth; and • Deposits increased by 6% to $122.3 billion driven by term deposit growth reflecting a strategy to deepen customer relationships. Transaction and savings accounts were up slightly. Non-interest income down 7% • Non-interest income declined by 7% to $619 million. Key drivers include: – Lower sales and risk management income, from lower fixed income trading; and – A $12 million reduction from DVA. Expenses up 12% • Expenses increased 12% to $791 million, reflecting: – Higher investment spend including technology simplification and an increase in software amortisation costs from prior year investments; and – Higher salaries and wages costs including an increase of 37 front-line staff to support relationships and lending growth. Impairment benefit of $39 million • The impairment benefit to average loans was 7 basis points, compared to a 22 basis point charge in the prior year. The benefit was driven by revisions in economic forecasts and upgrades to customer risk ratings. • Stressed exposures to TCE increased 15 basis points to 0.78%, mostly from higher substandard exposures in the trade sector. The proportion of impaired exposures to TCE increased 7 basis points, mostly in the services sector. |
| 46 WESTPAC GROUP 2025 INTERIM FINANCIAL RESULTS SEGMENT REPORTING Westpac New Zealand Westpac New Zealand provides banking and wealth products and services for consumer, business and institutional customers in New Zealand. All figures are in NZ$ unless noted otherwise. Half Year Half Year Half Year % Mov't March Sept March Mar 25 Mar 25 NZ$m 2025 2024 2024 - Sept 24 - Mar 24 Net interest income 1,365 1,332 1,258 2 9 Non-interest income 133 148 131 (10) 2 Notable Items (1) (3) (6) (67) (83) Net operating income 1,497 1,477 1,383 1 8 Operating expenses (734) (674) (695) 9 6 Total operating expenses (734) (674) (695) 9 6 Pre-provision profit 763 803 688 (5) 11 Impairment (charges)/benefits (33) (4) (23) large 43 Profit before income tax expense 730 799 665 (9) 10 Income tax expense and NCI (205) (221) (188) (7) 9 Net profit 525 578 477 (9) 10 Notable Items (post tax) (1) (1) (5) - (80) Expense to income ratio (Ex Notable Items) 49.00% 45.54% 50.04% 346 bps (104 bps) Net interest margin (Ex Notable Items) 2.26% 2.23% 2.11% 3 bps 15 bps As at As at As at % Mov't 31 March 30 Sept 31 March Mar 25 Mar 25 NZ$bn 2025 2024 2024 - Sept 24 - Mar 24 Customer deposits Transactions and others 21.4 20.8 21.0 3 2 Savings 20.7 19.4 20.1 7 3 Term 38.8 39.5 37.7 (2) 3 Total customer deposits 80.9 79.7 78.8 2 3 Loans Mortgages 69.5 68.0 67.4 2 3 Business 33.0 33.4 32.7 (1) 1 Other 1.2 1.2 1.2 - - Provisions (0.5) (0.5) (0.5) - - Total loans 103.2 102.1 100.8 1 2 Deposit to loan ratio 78.39% 78.06% 78.17% 33 bps 22 bps Total assets 125.3 123.5 123.5 1 1 TCE 153.0 147.3 148.1 4 3 Risk weighted assets 61.1 62.0 60.1 (1) 2 Liquid assets 17.9 17.8 18.6 1 (4) Average interest earning assets 121.3 119.4 119.1 2 2 Average allocated capital 8.4 8.2 8.1 2 4 Total funds 13.3 13.2 12.6 1 6 Credit quality Impairment charges/(benefits) to average loans 0.06% 0.01% 0.05% 5 bps 1 bps Mortgage 90+ day delinquencies 0.54% 0.49% 0.47% 5 bps 7 bps Other consumer loans 90+ day delinquencies 0.95% 0.87% 0.96% 8 bps (1 bps) Impaired exposures to TCE 0.17% 0.16% 0.12% 1 bps 5 bps Total stressed exposures to TCE 1.63% 1.73% 1.55% (10 bps) 8 bps |
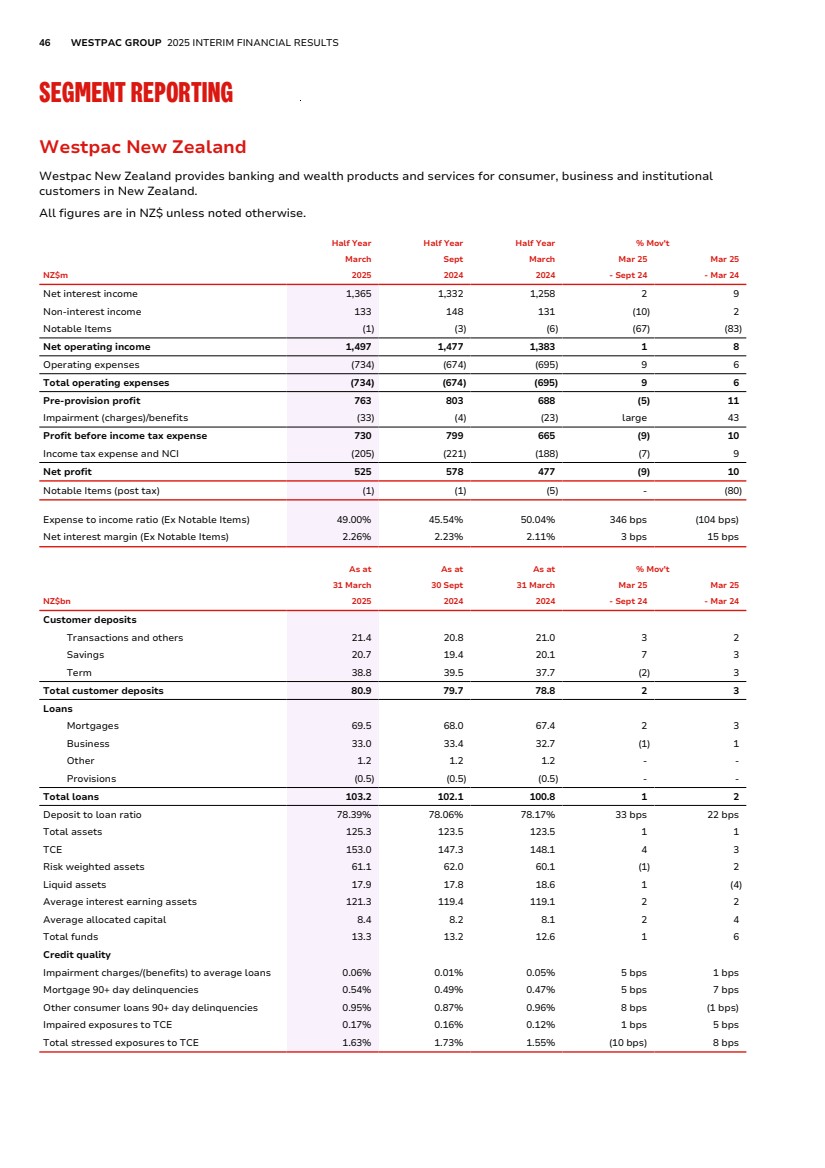
| PERFORMANCE REVIEW DIRECTORS’ REPORT 2025 INTERIM FINANCIAL REPORT OTHER INFORMATION 47 Westpac New Zealand (Continued) First Half 2025 – Second Half 2024 Net profit decreased 9% to $525 million. Pre-provision profit decreased 5% to $763 million, with a 1% increase in operating income more than offset by a 9% increase in operating expenses. Operating income reflected modest growth in lending balances of 1% and a 3 basis point increase in net interest margin, while operating expenses were driven by higher staff and technology costs, including software amortisation and investment spend. Net interest income up 2% • The net interest margin was up 3 basis points reflecting improved lending spreads and the continued benefit from prior interest rate increases on capital balances. This was partly offset by competition for term deposits; • Net loans increased 1% to $103.2 billion, driven entirely by mortgages. System growth was slower reflecting a challenging macroeconomic environment reducing demand for credit. Key drivers included: – Mortgage growth of 2%, represents 0.9x RBNZ housing system growth. Expectations for the RBNZ to continue to cut interest rates drove a shift in customers preference to shorter fixed rate tenors and variable rate loans; and – Business lending fell 1% reflecting challenged macroeconomic conditions and subdued business confidence. Agriculture lending fell 3% with farmers deleveraging following record milk prices. • Deposits increased 2% to $80.9 billion with growth predominantly in savings accounts. Term deposits decreased as customers elected to maintain some flexibility given the uncertain economic environment. Growth was primarily in household deposits while business deposits remained stable. Non-interest income down 10% • Non-interest income decreased 10% to $133 million reflecting lower cards income and lower business activity. Expenses up 9% • Operating expenses increased 9% to $734 million reflecting: – Higher staff expenses and third-party technology vendor costs; – Increase in technology investment to enhance core infrastructure and digital capability; and – Higher software amortisation. Impairment charge of $33 million • Impairment charges to average loans of 6 basis points, up 5 basis points, was driven by a small CAP charge relating to an increase in the downside scenario weight and weaker economic projections. • Stressed exposures to TCE decreased 10 basis points to 1.63% mostly due to lower watchlist exposures. Impaired exposures to TCE increased 1 basis point to 0.17%. |
| 48 WESTPAC GROUP 2025 INTERIM FINANCIAL RESULTS SEGMENT REPORTING Westpac New Zealand (Continued) First Half 2025 – First Half 2024 Net profit increased 10% to $525 million. Pre-provision profit increased 11% to $763 million, reflecting an 8% increase in operating income, more than offsetting a 6% increase in operating expenses. Operating income benefited from a higher net interest margin, while operating expenses increased due to higher staff and technology costs, including software amortisation. Net interest income up 9% • The net interest margin was up 15 basis points reflecting improved lending spreads and benefits from a mix shift to higher margin variable rate lending. Higher returns on capital balances from the impact of prior interest rate increases also provided a benefit. This was partly offset by competition for, and customers switching to, higher yielding term deposits; • Net loans increased 2% to $103.2 billion. Key drivers included: – Mortgage growth of 3%, mostly to owner occupiers. Expectations for the RBNZ to continue to cut interest rates drove a shift in customer preference to short-dated fixed rate tenors and variable rate loans; and – Business lending growth of 1%, was primarily driven by growth in corporate lending. Agriculture lending fell 3% with farmers deleveraging following record milk prices. • Deposits increased 3% to $80.9 billion. Growth was primarily in term deposits and savings accounts as customers preferences shifted to higher yielding accounts. Term deposit growth was entirely in Second Half 2024, while growth shifted to savings accounts in First Half 2025 as term deposit rates declined. Non-interest income up 2% • Non-interest income increased 2% to $133 million driven by higher investment income and business fees which were partly offset by lower cards income. Expenses up 6% • Operating expenses increased 6% to $734 million driven by: – Higher staff and third-party technology vendor costs to enhance digital capabilities; and – Higher software amortisation. Impairment charge of $33 million • Impairment charge to average loans of 6 basis points, up 1 basis point, was driven by a small CAP charge relating to an increase in the downside scenario weight and weaker economic projections. • Stressed exposures to TCE increased 8 basis points to 1.63% mostly due to higher non-performing exposures in the retail and manufacturing sectors. Impaired exposures to TCE increased 5 basis points to 0.17%. |
| PERFORMANCE REVIEW DIRECTORS’ REPORT 2025 INTERIM FINANCIAL REPORT OTHER INFORMATION 49 Westpac New Zealand (Continued) Westpac New Zealand segment performance (A$ Equivalent) Results have been translated into Australian dollars (A$) at the average exchange rates for each reporting period. First Half 2025: $1.1042 (Second Half 2024: $1.0932; First Half 2024: $1.0759). Unless otherwise stated, assets and liabilities have been translated at spot rates as at the end of the period, 31 March 2025: $1.1001 (30 September 2024: $1.0885; 31 March 2024: $1.0892). Half Year Half Year Half Year % Mov't March Sept March Mar 25 Mar 25 $m 2025 2024 2024 - Sept 24 - Mar 24 Net interest income 1,236 1,217 1,171 2 6 Non-interest income 121 135 122 (10) (1) Notable Items (1) (2) (6) (50) (83) Net operating income 1,356 1,350 1,287 - 5 Operating expenses (665) (616) (646) 8 3 Total operating expenses (665) (616) (646) 8 3 Pre-provision profit 691 734 641 (6) 8 Impairment (charges)/benefits (30) (3) (22) large 36 Profit before income tax expense 661 731 619 (10) 7 Income tax expense and NCI (185) (203) (174) (9) 6 Net profit 476 528 445 (10) 7 Notable Items (post tax) (1) (2) (4) (50) (75) Expense to income ratio (Ex Notable Items)a 49.00% 45.54% 50.04% 346 bps (104 bps) Net interest margin (Ex Notable Items)a 2.26% 2.23% 2.11% 3 bps 15 bps a. Ratios calculated using NZ$. As at As at As at % Mov't 31 March 30 Sept 31 March Mar 25 Mar 25 $bn 2025 2024 2024 - Sept 24 - Mar 24 Customer deposits 73.6 73.2 72.4 1 2 Loans 93.8 93.8 92.6 - 1 Deposit to loan ratioa 78.39% 78.06% 78.17% 33 bps 22 bps Total assets 113.9 113.5 113.4 - - TCE 139.0 135.3 136.0 3 2 Risk weighted assets 55.6 56.9 55.1 (2) 1 Liquid assets 16.2 16.3 17.0 (1) (5) Average interest earning assetsb 109.7 109.3 110.7 - (1) Average allocated capitalb 7.7 7.5 7.5 3 3 Total funds 12.0 12.1 11.5 (1) 4 a. Ratios calculated using NZ$. b. Averages are converted at applicable average rates. |
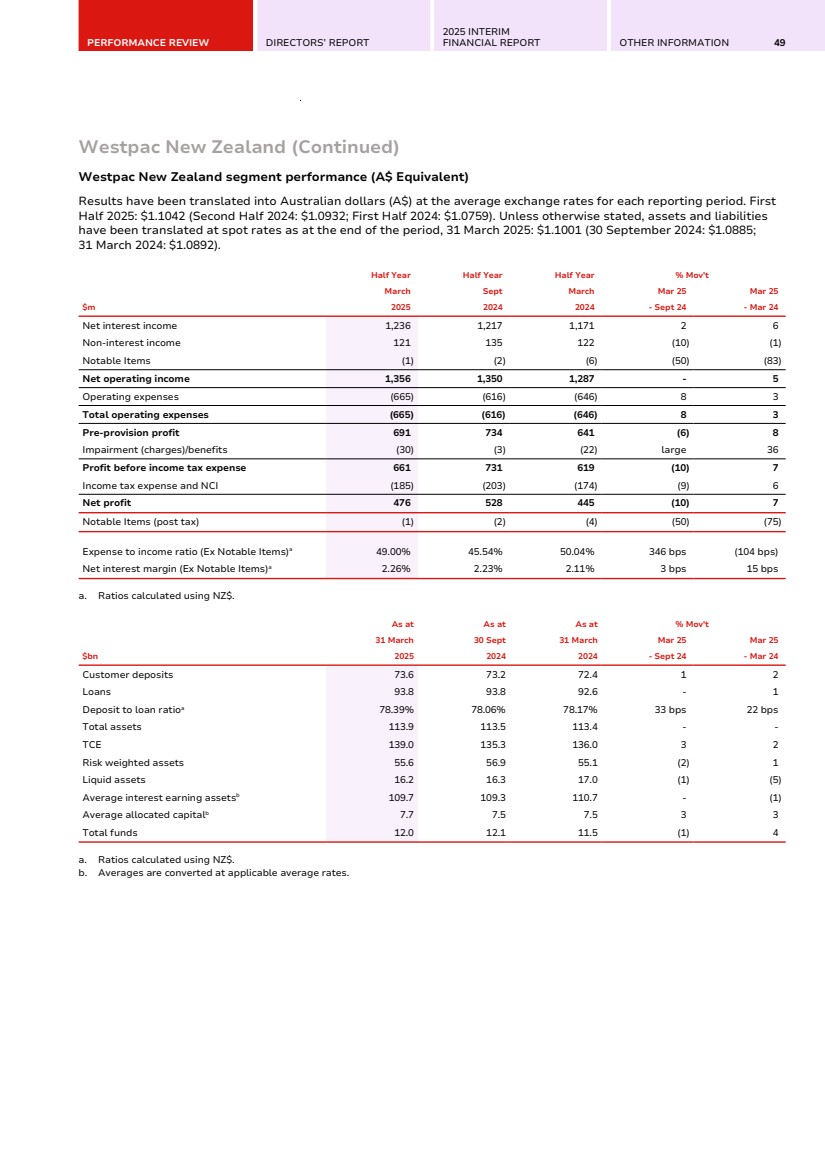
| 50 WESTPAC GROUP 2025 INTERIM FINANCIAL RESULTS SEGMENT REPORTING Group Businesses The segment comprises: • Treasury, which is responsible for the management of Westpac’s balance sheet including wholesale funding, capital, and liquidity. Treasury also manages interest rate risk and foreign exchange risk associated with wholesale funding; • Enterprise services, which include earnings on capital not allocated to segments, certain intra-group transactions and gains/losses from asset sales, earnings and costs associated with Westpac’s fintech investments; and • Other costs not directly attributable to segments include Corporate Affairs, a portion of enterprise technology costs related to UNITE in prior periods, certain customer remediation expenses and enterprise provisions. Half Year Half Year Half Year % Mov't March Sept March Mar 25 Mar 25 $m 2025 2024 2024 - Sept 24 - Mar 24 Net interest income 607 615 703 (1) (14) Non-interest income 8 (14) 13 large (38) Notable Items (199) 53 (220) large (10) Net operating income 416 654 496 (36) (16) Operating expenses (454) (385) (419) 18 8 Total operating expenses (454) (385) (419) 18 8 Pre-provision profit (38) 269 77 large large Impairment (charges)/benefits - (2) - (100) - Profit before income tax expense (38) 267 77 large large Income tax expense and NCI (85) (140) (94) (39) (10) Net profit/(loss) (123) 127 (17) large large Notable Items (post tax) (139) 43 (160) large (13) Treasury Half Year Half Year Half Year % Mov't March Sept March Mar 25 Mar 25 $m 2025 2024 2024 - Sept 24 - Mar 24 Net interest income 502 500 554 - (9) Non-interest income 6 7 13 (14) (54) Notable Items (217) 62 (220) large (1) Net operating income 291 569 347 (49) (16) Net profit 117 316 168 (63) (30) |
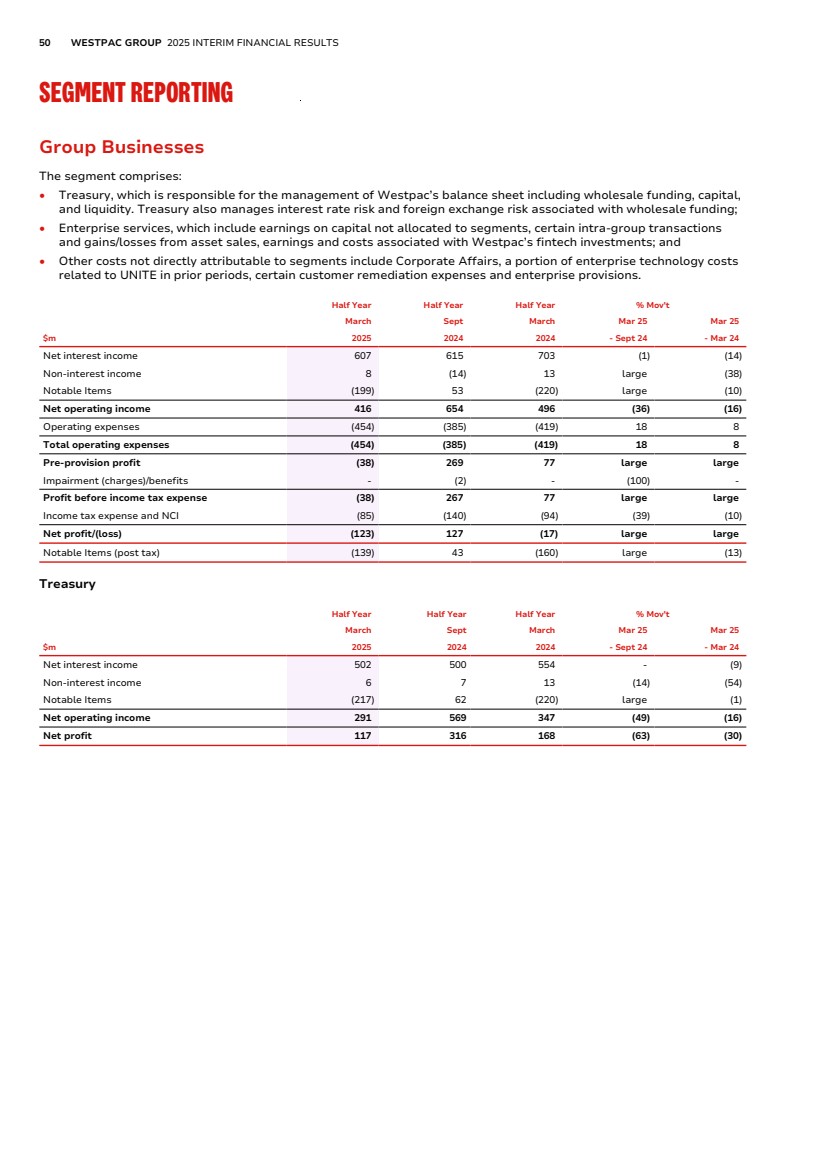
| PERFORMANCE REVIEW DIRECTORS’ REPORT 2025 INTERIM FINANCIAL REPORT OTHER INFORMATION 51 Group Businesses (Continued) First Half 2025 – Second Half 2024 Net loss of $123 million compared to a profit of $127 million in the prior period. Pre-provision loss of $38 million compared to a profit of $269 million in the prior period. Excluding Notable Items, pre-provision profit was $161 million compared with a $216 million profit in the prior period. Net operating income down 36% Excluding Notable Items, income was up 2% or $14 million. Expenses up 18% Operating expenses increased 18% or $69 million driven by an increase in employee and remediation costs partly offset by a decrease in UNITE spend as all costs are now allocated to divisions. First Half 2025 - First Half 2024 Net loss of $123 million compared to a loss of $17 million in the prior corresponding period. Pre-provision loss of $38 million was lower than a profit of $77 million in the prior corresponding period. Excluding Notable Items, pre-provision profit was $161 million compared with a $297 million profit in the prior corresponding period. Net operating income down 16% Excluding Notable Items, income was down 14% or $101 million. Movements included: • Interest rate volatility positioning during First Half 2024 outperformed First Half 2025; and • Lower capital income as unallocated balances reduced following the share buyback and special dividend. Expenses up 8% Operating expenses increased 8% or $35 million primarily driven by an increase in employee and remediation costs partly offset by a decrease in UNITE spend as all costs are now allocated to divisions. |
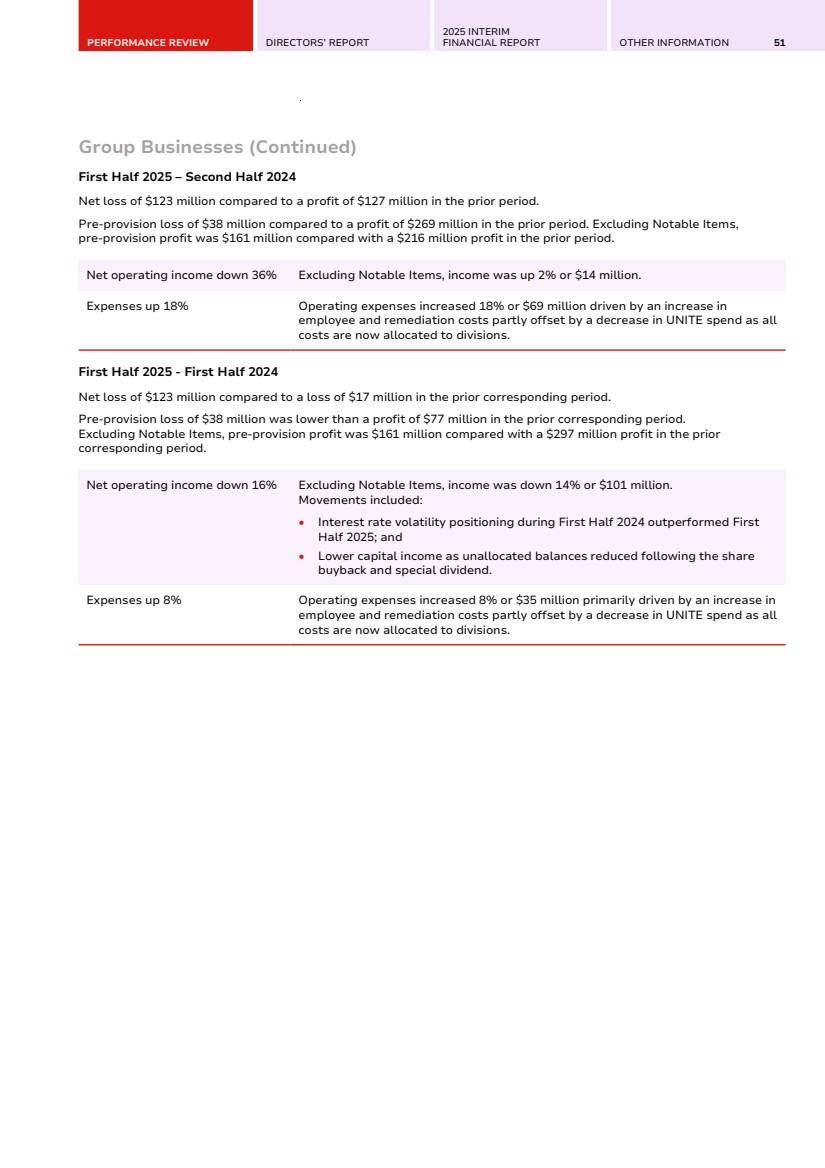
| 52 WESTPAC GROUP 2025 INTERIM FINANCIAL RESULTS DIRECTORS’ REPORT DIRECTORS’ REPORT Directors Review and results of the Group’s operations Significant developments Risk factors Rounding of amounts Auditor's Independence Declaration Responsibility Statement |

| PERFORMANCE REVIEW DIRECTORS’ REPORT 2025 INTERIM FINANCIAL REPORT OTHER INFORMATION 53 DIRECTORS’ REPORT The Directors of Westpac present their report together with the financial statements of Westpac and its controlled entities (collectively referred to as ‘the Group’) for the half year ended 31 March 2025. Directors The names of the Directors of Westpac holding office at any time during, and since the end of, the half year and the period for which each has served as a Director are set out below: Name Position Steven Gregg Director since November 2023 and Chairman since December 2023. Anthony Miller Managing Director and Chief Executive Officer since December 2024. Tim Burroughs Director since March 2023. Nerida Caesar Director since September 2017. David Cohen Director since April 2025. Debra Hazelton Director since March 2025. Andy Maguire Director since July 2024. Peter Nash Director since March 2018. Margaret Seale Director since March 2019. Michael Ullmer AO Director since April 2023. Peter King Retired 15 December 2024. Managing Director and Chief Executive Officer from December 2019. Audette Exel AO Retired 13 December 2024. Director since September 2021. Nora Scheinkestel Retired 6 November 2024. Director since March 2021. Review and results of the Group’s operations Net profit attributable to owners of Westpac for First Half 2025 was $3,317 million, 1% lower than First Half 2024, with Net operating income up 2% from higher net interest income and lower impairment expenses, partly offset by a reduction in Non-interest income largely due to lower gains from trading activities, and higher operating expenses from rising staff and technology costs. Compared to Second Half 2024, net profit was 9% lower. A summary of the movements in the major line items in Net profit for First Half 2025 compared to First Half 2024 is discussed below. Net interest income was up 2% at $9,351 million, with a 3% increase in average interest earning assets and a 1 basis point decline in the net interest margin. The main contributors to the movement in net interest margin included: • Tighter spreads on loans in response to competition; • The impact of increased costs of deposits and wholesale funding; and • Higher benefits on capital balances as a result of higher hedge interest rates. Non-interest income was 1% lower at $1,442 million compared to First Half 2024, mostly due to: • Trading income which was down $65 million; partly offset by • A rise of $21 million from Net wealth management income, reflecting higher platform revenues; and • A rise of $25 million from Other income mostly due to fair value gains on commodities swaps. Operating expenses were $5,698 million, 6% higher compared to First Half 2024. The increase was mainly due to: • Staff costs which rose $184 million from wages growth, higher average FTEs and superannuation rates; and • Technology costs which rose $157 million from technology services, and software maintenance and licence costs. Impairment charges were lower at $250 million compared to $362 million in First Half 2024, with both individually assessed and collectively assessed charges down. The reduction in collectively assessed impairment included the impacts of: • An increase in the downside scenario weighting, reflecting greater uncertainty in international trading relations and geopolitical instability; • An improvement in credit quality; • Improvement in economic outlook on commercial property prices and interest rates; and • The release of certain overlays. Overall, credit quality remains sound with stressed exposures as a percentage of TCE stable, and mortgage and consumer delinquency lower than First Half 2024. |
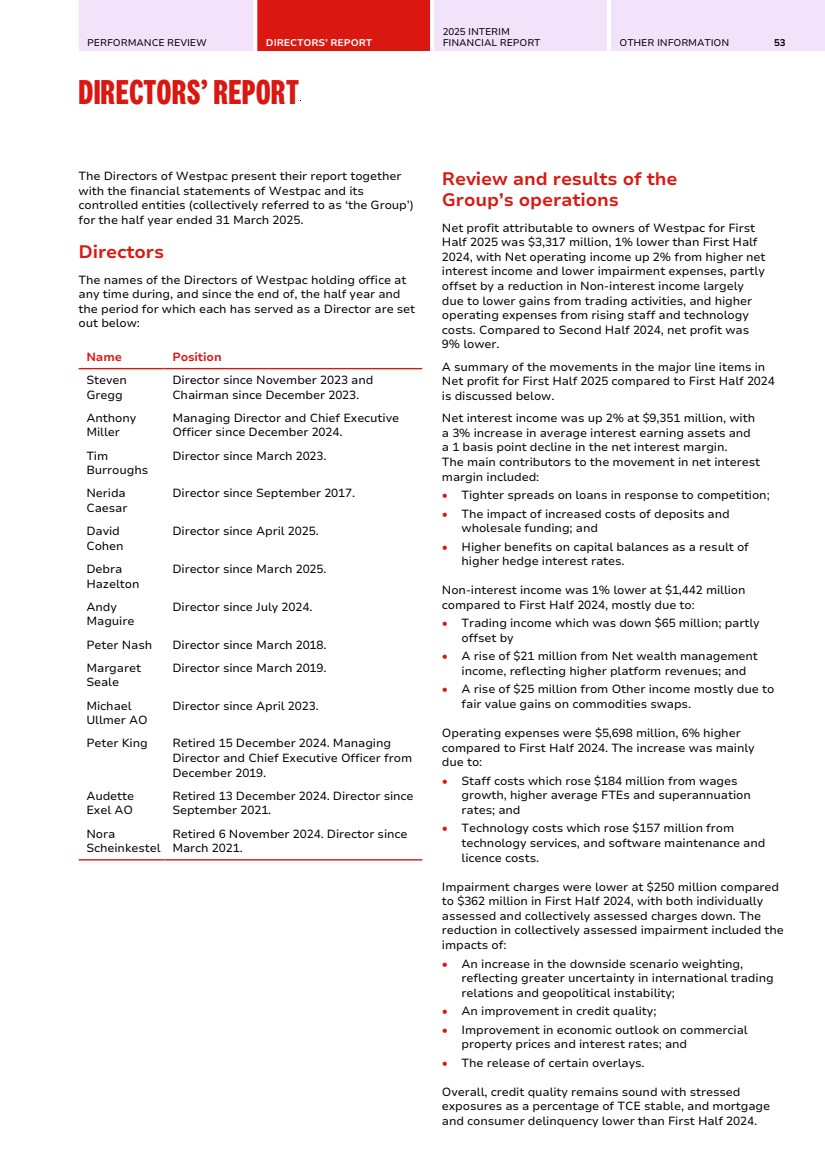
| 54 WESTPAC GROUP 2025 INTERIM FINANCIAL RESULTS DIRECTORS’ REPORT The effective tax rate of 31.37% was higher compared to the 30.85% of First Half 2024 with the primary drivers related to tax provision adjustments for prior periods and higher non-deductible expenses in First Half 2025. The Board has determined an interim ordinary dividend of 76 cents which will be fully franked. A review of the operations and results of the Group and its segments for the half year ended 31 March 2025 is set out in Performance review (see pages 2-51) of this Results Announcement which form part of the Directors' Report. Further information about our financial position and financial results is included in the financial statements and accompanying notes, which form part of the 2025 Interim Financial Report. Significant developments Westpac significant developments – Australia Changes to Board of Directors On 16 December 2024, Anthony Miller commenced as CEO and Managing Director. Independent Non-executive Directors, Dr Nora Scheinkestel and Ms Audette Exel AO, retired from the Board on 6 November 2024 and 13 December 2024, respectively. Debra Hazelton and David Cohen commenced as Independent Non-executive Directors of the Board on 4 March 2025 and 1 April 2025, respectively. Changes to Executive Team On 4 February 2025, Westpac announced the appointment of Paul Fowler as the Chief Executive of Business & Wealth, commencing on 12 May 2025. In the interim, Peter Herbert continues to act in this role. On 3 March 2025, Peter Herbert commenced as the Chief Transformation Officer. On 5 November 2024, Westpac announced the retirement of Christine Parker, Group Executive of Human Resources and on 2 April 2025, Westpac announced the appointment of Kate Dee as the new Chief People Officer, who will commence in the role later this year. On 17 December 2024, Westpac announced the retirement of Michael Rowland, Chief Financial Officer, and on 17 March 2025 announced the appointment of Nathan Goonan as the new Chief Financial Officer, subject to regulatory approval. Mr Rowland will remain in his role until Mr Goonan commences in his role. On 7 March 2025, Westpac announced that Jason Yetton, Group Executive of Consumer, has decided to leave the bank and on 29 April 2025, Westpac announced the appointment of Carolyn McCann, who is the current Group Executive of Customer & Corporate Services (CCS) as Acting Chief Executive, Consumer, while an external search is underway for a permanent replacement. As a result, Carolyn Hoy, who is currently the General Manager, Property, Procurement and Resilience, will act as Group Executive, CCS. These changes will be effective from 12 May 2025. On market buyback As at 31 March 2025, Westpac had completed $2.4 billion of the $3.5 billion on market share buyback previously announced, with 85.9 million Westpac shares purchased at an average price of $27.87. The shares bought back were subsequently cancelled. Westpac reserves the right to vary, suspend or terminate the buyback at any time. External auditor rotation Following approval by Westpac’s shareholders at the 2024 AGM on 13 December 2024, KPMG commenced as Westpac’s external auditor for the 2025 financial year. Regulatory and risk developments Enforceable undertaking on risk governance remediation, Integrated Plan and CORE program Following completion of the Integrated Plan (IP), as committed, in December 2023 (required under the enforceable undertaking (EU) entered into with APRA in December 2020 in relation to our risk governance remediation), Westpac continued to focus on the sustainability and effectiveness of the IP uplifts via a transition phase. On 31 December 2024, we completed the transition phase, as confirmed by Promontory Australia (as Independent Reviewer) in February 2025. APRA releases final Prudential Standard CPS230 Operational Risk Management On 17 July 2023, APRA released the final version of Prudential Standard CPS 230 Operational Risk Management which will come into effect from 1 July 2025. CPS 230 brings new and enhanced requirements for our operational risk management, material service provider management and business continuity planning; and we are undertaking a programme of work to assist in implementing these requirements. Details about operational risk and the consequences of failing to comply with regulatory requirements are set out in Risk factors (pages 57-70). Financial crime Westpac continues to make progress on improving our financial crime risk management with significant ongoing work, as we implement a multi-year program of work (including AML/CTF, Sanctions, Anti-Bribery and Corruption, the US Foreign Account Tax Compliance Act (FATCA) and Common Reporting Standard (CRS)). Through this work, we continue to undertake activities to strengthen and remediate our Financial Crime Program and to improving regulatory reporting, including in relation to International Funds Transfer Instructions, Threshold Transaction Reports, Suspicious Matter Reports (including ‘tipping off’ controls), and FATCA and CRS reporting and equivalent reports in jurisdictions outside Australia. On 29 November 2024, the Australian Parliament passed the Anti-Money Laundering and Counter-Terrorism Financing Amendment Act 2024 (Cth) (AML/CTF Amendment Act). The AML/CTF Amendment Act and proposed associated rules modernise and overhaul |
| PERFORMANCE REVIEW DIRECTORS’ REPORT 2025 INTERIM FINANCIAL REPORT OTHER INFORMATION 55 Significant developments (Continued) the AML/CTF regime, to ensure Australia continues to effectively deter, detect and disrupt financial crime. We will make amendments to our policies, procedures, systems and controls as appropriate and in accordance with the specified compliance timeframes. With increased focus on financial crime, further areas of potential non-compliance have been, and may continue to be identified, and we continue to liaise with the Australian Transaction Reports and Analysis Centre (AUSTRAC) and the Australian Taxation Office (ATO) and local regulators in jurisdictions outside Australia, as appropriate, including to remediate findings and adopt recommendations from regulators with significant ongoing programmes of work across the Group. Details about the consequences of failing to comply with financial crime obligations are set out in Risk factors (pages 57-70). Scams On 21 February 2025, the Scams Prevention Framework Act 2025 (Cth) came into effect. This implements the Scams Prevention Framework (SPF) through amendment to the Competition and Consumer Act 2010 (Cth). The SPF outlines the responsibilities of designated sectors (initially banks, telecommunications, and digital platform service providers) to prevent, detect, report, disrupt and respond to scams in Australia. We are considering the potential impacts of the new legislation, including on our policies, procedures, systems and controls. New climate reporting standards New mandatory climate-related reporting standards were approved in September 2024 by the Australian Accounting Standards Board and legislation requiring compliance has been passed by the Australian Parliament. Westpac will report against these new requirements from its financial year ending 30 September 2026. US Securities and Exchange Commission (SEC) rules on the disclosure of climate-related information expected to apply to Westpac from FY26 have been stayed following a lawsuit challenging the rules. On 27 March 2025, the SEC notified the court it was withdrawing its defence of the rules and on 24 April 2025 the court suspended the lawsuit until the SEC advises whether it intends to review or reconsider the rules. APRA capital requirements Operational risk capital overlays In 2019, APRA applied $1 billion of additional capital overlays to our operational risk capital requirement. These overlays were applied through an increase in risk weighted assets (RWA). On 19 July 2024, APRA announced its decision to reduce Westpac’s total operational risk capital overlay from $1 billion to $500 million. The impact of the remaining $500 million overlay on our Level 2 common equity Tier 1 (CET1) capital ratio at 31 March 2025 was a decrease of 17 basis points. APRA announcement to phase out AT1 capital as eligible bank capital On 9 December 2024, APRA confirmed that it will proceed with its proposal to phase out AT1 capital instruments from the bank prudential framework. Further details about this change are set out in Capital and dividends (pages 28-32). Westpac significant developments – New Zealand RBNZ review of overseas bank branches On 21 August 2024, the RBNZ released the proposed Branch Standard under the Deposit Takers Act 2023 which will implement decisions made as part of the review of its policy for branches of overseas banks. The proposed Branch Standard will require that overseas bank branches only conduct business with wholesale clients; the total size of an overseas bank’s branch cannot exceed NZ$15 billion in total assets; and dual-operating branches (such as Westpac’s New Zealand Branch) only conduct business with “large” corporate and institutional clients. It is proposed that “large” means those with consolidated annual turnover of over NZ$50 million, total assets of over NZ$75 million or total assets under management of over NZ$1 billion (for funds management entities only). The implementation date is expected to be in July 2028. Westpac’s New Zealand Branch currently provides financial markets, trade finance and international payment products and services to customers referred by WNZL. We expect the RBNZ’s Branch Standard will require changes to the activities Westpac’s New Zealand Branch undertakes, and as a result, WNZL may also make changes to the scope of the activities it undertakes. RBNZ review of capital settings for deposit takers On 31 March 2025, the RBNZ announced that it intends to conduct a review of the capital settings applicable to New Zealand incorporated deposit takers (including WNZL). The planned Prudential Capital Buffer increase of 1% will proceed on 1 July 2025, with the review to be conducted promptly to allow for any changes prior to the next capital requirement increase scheduled for 1 July 2026. The review will include: • an assessment of how New Zealand’s capital settings compare internationally; • a reassessment of the appropriate risk appetite for capital settings in New Zealand; • reviewing the degree of proportionality in the framework and considering changes; and • considering the balance between going concern and gone concern capital and the role of ‘AT1’ capital. General regulatory changes affecting our businesses Cyber security We continue to work on enhancing our systems and processes to mitigate cyber security risks, including those related to third parties, and to respond to changes in regulation, including from the legislation passed by the Australian Parliament in November 2024, which implemented certain measures proposed by the |
| 56 WESTPAC GROUP 2025 INTERIM FINANCIAL RESULTS DIRECTORS’ REPORT Significant developments (Continued) Federal Government in its 2023-2030 Australian Cyber Security Strategy. Regulators have continued their focus on cyber security following high profile cyber-related incidents. APRA is seeking to ensure that regulated entities further strengthen their cyber security practices, focusing on the effective implementation and ongoing compliance with Prudential Standard CPS 234 Information Security and Prudential Standard CPS 230 Operational Risk Management (which, as noted above, will come into effect from 1 July 2025). Similarly, ASIC is emphasising strengthened cybersecurity at the companies it regulates and has indicated a focus on strengthening cyber resilience through proposed testing strategies. The Australian Signals Directorate and the Australian Cyber Security Centre are increasingly providing threat intelligence and tailored guidance to help organisations enhance their information security measures. We will continue to engage with regulators and the government more broadly regarding cyber-related regulation, legislation and policy. Details about operational risks and information security risks, including cyberattacks, are set out in Risk factors (pages 57-70). Revised Banking Code of Practice On 28 February 2025, the new version of the Australian Banking Association’s (ABA) Banking Code of Practice (the Code) came into effect. The strengthened Code includes uplifts to existing provisions and additional safeguards and protections for small business customers, guarantors, vulnerable customers and customers requiring additional support. These updates include: • an expanded small business definition that increases the aggregate borrowing limit from $3 million to $5 million, which is anticipated to provide up to 10,000 more small businesses with access to the Code protections; • a new obligation to take reasonable steps to ensure that a meeting is held with a guarantor in the absence of the borrower before signing a guarantee; • a new obligation to do all things necessary to ensure banking services under the Code are provided ‘efficiently, honestly and fairly’; • an updated vulnerability definition that expands the categories of vulnerability and recognises that a customer can become vulnerable at any time; • updated provisions to improve the process for managing deceased estates; and • an uplift of the inclusivity and accessibility provisions to expressly include LGBTQIA+ persons and a new commitment to organise or refer customers to free external support services. Legal proceedings Our entities are parties to legal proceedings from time to time arising from the conduct of our business. Certain litigation (including regulatory proceedings) and class actions are described as required in Note 13 (pages 101-105) to the financial statements in this Results Announcement. |
| PERFORMANCE REVIEW DIRECTORS’ REPORT 2025 INTERIM FINANCIAL REPORT OTHER INFORMATION 57 Risk factors Our business is subject to risks that can adversely impact our financial performance, financial condition and future performance. Our 2024 Annual Report sets out the 11 major risk categories that impact our business, our approach to managing risks, as well as key focus areas. This section provides our investors (and potential investors) with further information in relation to the current and future risks we face, as well as potential consequences if those risks materialise. The content of this section is current as of the date of publication, and it is important to note that subsequent developments may impact its relevance. Risks and risk management strategies are inherently dynamic, evolving alongside changes in the external environment, market conditions and organisational priorities. The risks and uncertainties described below can emerge together or quickly in succession in a fashion that is uncorrelated with the order in which they are presented below, and they are not the only ones we face. Additional risks and uncertainties that we are unaware of, or that we currently deem to be immaterial, may also become important factors that affect us. If any of the following risks materialise, our business, prospects, reputation, financial performance or financial condition could be materially adversely affected, which may subsequently cause the price of our securities or the level of dividends to decline and, as a security holder, you could lose all, or part, of your investment. You should carefully consider the risks described (individually and in combination) and the other information in this Results Announcement and in our 2024 Annual Report and subsequent disclosures before investing in, or continuing to own, our securities. Risks relating to our business We have experienced, and could in the future experience, information security risks, including cyberattacks - Cyber risk - Cyber attacks - Operational risk - Information security risks - Data breaches - Third party risk Our operations depend on the secure processing, storage and transmission of information on our systems and those of external suppliers. Despite our measures to protect the confidentiality, availability and integrity of our information, our information assets may face security breaches, unauthorised access, malware, social engineering, denial of service attacks, ransomware, destructive attacks, employee misconduct, human error or other external and internal threats. These could adversely impact our and others’ confidential information and system availability. Information security risks are heightened by factors such as new technologies, increased digitisation, larger volumes of sensitive data, sophisticated cyber crime, supply chain disruptions, remote and hybrid working, targeting of critical infrastructure providers, geopolitical tensions, terrorism, state sponsored attacks, and the use of AI in cyberattacks (which can increase the speed, complexity and effectiveness of cyberattacks). These factors could compromise our information assets and interrupt usual operations for us, our customers, suppliers and counterparties. Adverse events such as data breaches, cyberattacks, espionage and errors (including human-related), are increasing in frequency and impact, potentially causing financial instability, reputational damage, service disruption, contagion risk, in addition to economic and non-economic losses to us, our customers, shareholders, suppliers, counterparties and others. Our systems and processes designed to protect against and respond to these threats have not always been, and may not always be, effective and human error can occur. Westpac, our customers and other stakeholders could suffer losses from cyberattacks, information security breaches or ineffective cyber resilience. Consequences could be severe if customer data is being held in breach of legal or regulatory obligations and that data is compromised as part of an information security incident. We may not always be able to anticipate and prevent or effectively respond to such incidents, or effectively respond to and/or rectify the resulting damage. Our suppliers, counterparties, and other parties involved in or who facilitate our activities, financial platforms and infrastructure as well as our customers’ suppliers and counterparties are also at risk, which could impact us. As cyberattacks increase globally, the likelihood of regulatory enforcement and legal action for information security failures from customers or shareholders increases. This could include class action litigation for issues such as information security risk management failures, misleading statements about our information security practices or for deficiencies in our response to cyberattacks and information security threats (including any delayed, deficient or misleading notifications). Consequences of successful attacks could include damage to technology infrastructure, government intervention, service disruptions, loss of customers and market share, data loss, cyber extortion, customer remediation and/or compensation, breaches of the law, vulnerability to fraud or scams, litigation, fines, and increased regulatory scrutiny or other enforcement action. Such outcomes could negatively affect our business, prospects, reputation, financial performance or financial condition. As cyber threats evolve, we may need to allocate significant resources and incur additional costs to enhance our systems, address vulnerabilities or incidents and respond to regulatory changes. |
| 58 WESTPAC GROUP 2025 INTERIM FINANCIAL RESULTS DIRECTORS’ REPORT Risk factors (Continued) We could suffer losses due to geopolitical events - Geopolitical risks - Conflicts - Operational risk - Credit risk We, our customers and our suppliers operate businesses, engage in trade with and hold assets in different geographic locations. Significant risks subsist including from geopolitical instability, conflicts, trade tensions, tariffs, sanctions, social disruption, civil unrest, war, terrorist activity, acts of international hostility, and complicity with or reluctance to take action against certain types of crimes. Such events or the uncertainty related to the potential for such events are and could continue to directly and indirectly impact our and our customers’ operations, affect domestic and international economic stability and impact consumer and investor confidence, which in turn could disrupt industries, businesses, service providers and supply chains and ultimately adversely impact economic activity. This could lead to shortages of materials and labour, higher energy costs and commodity prices, volatility in markets and damage to property. This in turn could affect asset values and impact customers’ ability to repay amounts owing to us, and our ability to recover amounts owing. All of these impacts could adversely affect our business, prospects, financial performance or financial condition. The current global landscape is marked by significant and prolonged conflicts, increasing protectionist policies (and uncertainties surrounding such policies) and heightened tensions, which have the potential to further intensify these impacts. We could be adversely affected by legal or regulatory change - Compliance and conduct risk - Regulators' expectations - Legal and regulatory change - Fines, penalties, other costs and capital overlays We operate in a highly regulated industry with an environment of sustained legal and regulatory change and ongoing scrutiny of financial services providers. Our business, prospects, reputation, financial performance and financial condition have been, and could in the future be, adversely affected by domestic and international changes to laws, regulations, policies, supervisory activities, regulator expectations, and industry codes of practice, such as the Banking Code of Practice. Such changes may affect how we operate and have altered, and may in the future alter, the way we provide our products and services, in some cases requiring us to change, suspend or discontinue our offerings. Industry-wide reviews and inquiries could further reshape laws, regulations, policy or regulatory expectations. The effects of such reviews and inquiries in the past have included, and could continue to include, limiting our flexibility, requiring us to incur substantial costs (e.g. system changes, incurring Compensation Scheme of Last Resort levies, liabilities related to scams, fraud or operational costs relating to scam management or other industry wide issues), absorbing specialist resources, impacting profitability and requiring us to retain additional capital, which impacts our ability to pursue strategic initiatives or implement other changes, resulting in us being unable to increase or maintain market share and/or creating pressure on margins and fees. A failure to manage legal or regulatory changes effectively and in the timeframes required has resulted, and could in the future result, in the Group not meeting its compliance obligations. It could also result in enforcement actions, penalties, fines, civil litigation, capital impacts, and ultimately loss of or variations to business licences. Frequent and large volumes of regulatory change also contribute to execution risk, as technology and system and process updates may not always be successful in keeping pace with such change and there is heightened risk of flaws, human error or unintended consequences. Managing these changes may require significant management attention, costs and resources, including the availability of skilled personnel, which may be limited. There is additional information on certain aspects of regulatory changes affecting the Group in Significant Developments (pages 54-56) and in the sections ‘Critical accounting assumptions and estimates’ and ‘Future developments in accounting standards’ in Note 1 (pages 79-80) to the financial statements. |

| PERFORMANCE REVIEW DIRECTORS’ REPORT 2025 INTERIM FINANCIAL REPORT OTHER INFORMATION 59 Risk factors (Continued) We have been and could be adversely affected by failing to comply with laws, regulations or regulatory policy - Compliance and conduct risk - Regulators' expectations - Legal and regulatory - Industry codes - Fines, penalties and capital overlays We are responsible for complying with all applicable legal and regulatory requirements and industry codes of practice in the jurisdictions where we operate or obtain funding. We are subject to compliance and conduct risks, which are exacerbated by the complexity and volume of regulation, as well as ongoing regulatory change. These risks increase when there is ambiguity or multiple ways of interpreting our obligations and rights, conflicting laws between jurisdictions or regimes, or where there is limited industry consultation or a lack of regulatory guidance, particularly with respect to new or untested regulations. Our compliance and conduct management system, which is designed to mitigate compliance and conduct risks, has not always been, and may not always be, effective. Breakdowns have occurred, and may in the future occur due to factors such as poor judgement, flaws in the design or implementation of controls or processes, or the implementation of new measures. Such issues can lead to non-compliance, including failures to meet obligations to report or provide information to regulators. Ongoing reviews and change programs continue to identify compliance issues. Conduct risk has occurred, and could continue to occur, through the provision of products and services that may not meet customer needs or market or regulator expectations, especially for vulnerable customers, customers in hardship and indigenous customers. This risk has occurred, and could continue to occur, from deliberate, reckless, negligent, accidental or unintentional conduct of our employees, officers, contractors, agents, authorised representatives, credit representatives and/or external service providers, resulting in circumvention of, or inadequate implementation of, controls, processes, policies or procedures. This could occur through a failure to meet professional obligations (including fiduciary, suitability and responsible lending requirements), human error or weaknesses in risk culture, corporate governance or organisational culture or poor product design and implementation (including failing in whole or in part to consider customer needs or selling products and services outside of target markets). Inadequate supervision and oversight of our distribution channels can heighten these risks. Non-compliance by our people may negatively impact other employees, leading to outcomes including litigation and reputational damage. Additionally, third party conduct (e.g. where customers misrepresent their position on product applications and we have failed to identify it) may limit our recourse and regulatory outcomes may not be mitigated by third party culpability. These factors have resulted, and could continue to result, in poor customer outcomes (including for vulnerable customers and customers in hardship), failure to meet compliance obligations (or to promptly detect, report and/or remedy non-compliance), impacts which may compromise the integrity of the markets in which we operate or data we report, reputational damage, increased regulatory surveillance or investigation and employment disputes. We are currently subject to a number of investigations, reviews and industry inquiries by, and have and continue to respond to a number of requests from, domestic and international regulators including APRA, ASIC, the ATO, the ACCC, AUSTRAC, BCCC, FINRA, AFCA, the OAIC, RBNZ, New Zealand Financial Markets Authority, New Zealand Commerce Commission, the Fair Work Ombudsman, the SEC, BaFin and BPNG’s Financial Analysis and Supervision Unit, involving significant resources and costs (which may divert specialist resources from other programs of work). Regulatory reviews and investigations have in the past, and may in the future, result in a regulator taking administrative or enforcement action against us and/or our representatives. Regulators have broad powers and may issue directions (e.g. for product design and distribution and remedial action), pursue civil or criminal proceedings, seek substantial fines and penalties, and other compliance or enforcement outcomes. These risks are heightened (and penalties have been and may be higher) where contraventions are not promptly detected or addressed, where we fail to meet our obligations (or the expectations of regulators), where there are patterns of behaviour indicating systemic conduct or where there has been an awareness of contraventions, especially in areas of heightened regulatory focus, such as vulnerable customers, customers in hardship and indigenous customers. Additionally, regulatory investigations may lead to adverse findings against directors and management, including potential disqualification. The resources allocated to these reviews and investigations can impede other activities, including change and remediation programs. APRA can also require the Group to hold additional capital either through a capital overlay or higher risk weighted assets (including in response to a failure to comply with prudential standards and/or expectations in relation to, for example, stress testing and liquidity management). Following the commencement of civil penalty proceedings, APRA imposed a A$500 million Culture, Governance and Accountability Review overlay and a further A$500 million Risk Governance overlay to our required operational risk capital in 2019. Although APRA reduced the Group’s capital overlay from A$1 billion to A$500 million in 2024, additional capital overlays could have an adverse impact on our financial performance. The evolving political and regulatory landscape has seen (and may continue to see) expansion of regulators’ powers, materially increased civil penalties and fines and increased criminal prosecutions against institutions |

| 60 WESTPAC GROUP 2025 INTERIM FINANCIAL RESULTS DIRECTORS’ REPORT Risk factors (Continued) and/or their employees and representatives (including where there is no fault element). This could also result in reputational damage and impact the willingness of customers, investors and other stakeholders to deal with us. Given our size and scale of activities, a failure by us may result in multiple contraventions, which could lead to significant penalties, remedial action and other consequences (e.g. regulatory damage). The introduction of the Financial Accountability Regime has further intensified these risks through imposing strengthened responsibility and accountability frameworks. Regulatory investigations or actions commenced against the Group have exposed, and may in the future expose, the Group to an increased risk of litigation brought by third parties (including through class action proceedings), which may require us to pay (sometimes substantial) compensation to third parties and/or to undertake further remediation activities. Market developments suggest there is an expanding scope for potential claims, including in relation to cyber incidents, financial crime and ESG issues. We have incurred significant remediation costs on a number of occasions (including compensation payments and costs of correcting issues) and new issues may arise requiring remediation. We have faced, and may continue to face, challenges in effectively and reliably scoping, quantifying and implementing remediation activities, including determining how to compensate impacted parties properly, fairly and in a timely way. Investigation of the underlying issue may be impeded due to the passage of time, technical system constraints, or inadequacy of records. Delays in remediation may occur due to factors such as the number of affected parties and their responsiveness, ongoing investigations or litigation, and regulatory requirements. Remediation programs may not prevent regulatory action or investigations, litigation or other proceedings from being pursued, or sanctions being imposed. Regulatory investigations, inquiries, litigation, fines, penalties, infringement notices, revocation, suspension or variation of conditions of regulatory licences or other enforcement or administrative action or agreements (such as enforceable undertakings) have and could, either individually or in aggregate with other regulatory action, adversely affect our business, prospects, reputation, financial performance or financial condition and increase class action risk. There is additional information on certain regulatory and other matters that may affect the Group (including class actions) in Significant Developments (pages 54-56) and in Note 13 (pages 101-105) to the financial statements. We have suffered, and in the future could suffer, losses and be adversely affected by the failure to implement effective risk management - Risk management - Controls and processes - Risk culture - Risk governance - Fines, penalties Our risk management framework has not always been, and may not in the future be, fully effective. The resources we allocate to identifying, measuring, evaluating, monitoring, reporting, controlling or mitigating material risks may sometimes be inadequate. This may arise due to inadequacies in the design of the framework or key risk management policies, controls and processes, the design or operation of our remuneration structures and consequence management processes, technology failures, our corporate structure, incomplete implementation or embedment, or failure by our people (including contractors, agents, authorised representatives and credit representatives) to comply with or properly implement our policies and processes. The potential for these types of failings is heightened if we lack sufficiently skilled, trained or qualified personnel or capacity, including people, processes and technology, to appropriately manage risks. Although we periodically review our risk management framework to determine if it remains appropriate, all risk management frameworks have inherent limitations (and may also be ineffective because of weaknesses in risk culture or governance), and some risks may exist or emerge that we have not anticipated or identified. For example, where there is a lack of awareness of our policies, controls and processes or where they are not adequately complied with, monitored, audited or enforced. This may result in poor decision-making or risk and control weaknesses not being identified, escalated or acted upon. Risks are measured and monitored against our risk appetite, and when outside of appetite, we aim to take steps to bring such risks back into appetite, including framework and policy design improvements. However, bringing risks back within appetite may be delayed or ineffective, due to factors including complexity, information technology system enhancement delays, staffing constraints (including where staff are occupied by other regulatory change or remediation projects), operational failures or external factors beyond our control, resulting in certain risks remaining outside of appetite for periods of time. As part of the Enforceable Undertaking with APRA in December 2020 in relation to our risk governance remediation and to support the strengthening of our risk governance, accountability and culture, we developed the Integrated Plan (IP). As committed, the IP was completed in December 2023 and in April 2024, Promontory Australia (as Independent Reviewer) confirmed our completion. IP reports issued by Promontory Australia are published on our website at https://www.westpac.com.au/about-westpac/media/core/. Westpac continued to focus on the sustainability |

| PERFORMANCE REVIEW DIRECTORS’ REPORT 2025 INTERIM FINANCIAL REPORT OTHER INFORMATION 61 Risk factors (Continued) and effectiveness of the uplift delivered by the IP through a transition phase that was completed in December 2024 and confirmed as complete by Promontory Australia in February 2025. If any of our governance or risk management processes and procedures prove ineffective or inadequate or are not appropriately implemented or we fail to bring risks into appetite, we may face sustained or increased regulatory scrutiny and action. While a stronger risk culture fosters early self-identification and remediation, it may also highlight concerns that trigger further regulatory action. This may result in financial losses, additional capital requirements, compliance breaches, fines, reputational damage, and/or significant remediation, which could adversely affect our business, prospects, financial performance or financial condition. We could suffer losses due to technology failures - Operational risk - Information and technology - Change management - Technology failure - Outages Maintaining the reliability, availability, integrity, confidentiality, security and resilience of our information and technology is crucial to our business. Despite existing processes to preserve, monitor and facilitate the availability of and recovery of, our systems, there is a risk that our information and technology systems may be inadequate, could be compromised, fail to operate properly or result in outages, including from events wholly or partially beyond our control. A technology failure could lead to failures to meet compliance obligations (such as a requirement to retain records and/or data for a certain period, or to destroy records and/or data after a certain period, or other risk management, privacy, business continuity management or outsourcing obligations). Our stakeholders, including employees and customers may be adversely affected, including by being unable to access our products and services, as a result of privacy breaches, or the loss of personal data. This could result in business disruption, reputational damage, remediation costs, regulatory investigations and/or action, or others commencing litigation. Technology issues in the financial sector can also affect multiple institutions, meaning we could impact, or be impacted by, other institutions. The use of legacy systems, as well as work underway to uplift our technological capabilities, may heighten the risk of a technology failure, change management issues and the risk of non-compliance with our regulatory obligations or poor customer outcomes. Projects aimed at simplifying/streamlining our systems (including our UNITE program) will require significant resources (including specialist expertise) and incur costs. These risks may be heightened while those projects are being undertaken, or post-implementation where there are unanticipated outcomes or impacts. These projects may also not be completed on time, may not deliver the expected benefits or may require further resources or funding than anticipated. The success of such projects relies in part on having robust governance arrangements and appropriate oversight at Board and senior executive level. Shortcomings in these areas could elevate the risk of regulatory non-compliance, poor customer outcomes, delays, increased costs or demand on resources. Failure to regularly renew and enhance our technology to deliver new products and services, comply with regulatory obligations and ongoing regulatory changes, improve automation of systems and controls, meet our customers’ and regulators’ expectations, or to effectively implement new technology projects, could result in cost overruns, technology failures (including due to human error in implementation), reduced productivity, outages, operational failures or instability, compliance failures, reputational damage and/or loss of market share. Climate change and other sustainability factors such as human rights and natural capital may have adverse effects on our business - Climate and nature risks - Physical and transition risks - Social and human rights risks - Credit risk - Operational risk - Reputational and sustainability risk - Compliance and conduct risks Climate and other sustainability-related risks have had and are likely to have adverse effects on us, our customers, external suppliers, and the communities in which we operate. Managing these risks is challenging given significant uncertainties in modelling and assessing their impact. Climate related risks may manifest as physical risks, transition risks, and liability risks. Physical risks include direct risks to us, as well as those to our customers, suppliers and other stakeholders. These risks could arise from increases and variability in temperatures, precipitation changes, rising sea levels, loss of |

| 62 WESTPAC GROUP 2025 INTERIM FINANCIAL RESULTS DIRECTORS’ REPORT Risk factors (Continued) natural capital (including biodiversity loss), and more severe and frequent climatic events, including fires, storms, floods and droughts. Such events could also increase human rights risk and/or increase customer vulnerability. Impacts may arise through damage, disruption or changes to business activities, operations, asset values and insurability of assets (or insurance availability/affordability), resulting in higher costs and/or reduced revenues, and, in turn, lower Group income caused by increased default rates, delinquencies, write-offs and impairment charges in the Group’s portfolios. Transition risks may arise through the transition to a lower carbon economy, which in turn could impact Westpac through changes such as in consumer behaviour and market sentiment. These risks could unfold in various ways – gradually and orderly, abruptly and disorderly, or a combination of both. Impacts could result from climate change mitigation efforts, the obsolescence of certain businesses due to the energy transition, changes in investor appetite, shifting customer preferences, technology developments and regulatory changes. Such risks could also emerge through lending to customers facing reduced revenues, asset devaluation and rising costs, thereby increasing our credit risk. Additionally, Westpac may be indirectly impacted by transition risks, from adverse effects to the broader economy (interest rates, inflation and growth) or adverse asset pricing and valuations. Our ambition to become a net-zero, climate resilient bank, has led and will continue to lead to changes in policies and processes which may present associated execution risk. Our ability to meet our commitments and targets is in part dependent on the orderly transition of the broader economy to net-zero, which may be impacted by external factors including (but not limited to) government policies, investment levels, electricity grid capacity, and constraints in the development and supply of technology, infrastructure and skilled labour. Additionally, our ability to transition, including to meet our targets and commitments, may also be impacted by the challenges faced by our customers in executing their own transition plans and commitments. Natural capital loss, referring to the depletion of renewable and non-renewable natural resources that combine to yield a flow of benefits to people, poses a risk to us, primarily through our exposure to customers that are materially dependent or impact on natural resources. This loss can contribute to, and be accelerated by, climate change. Increasing recognition and responses to this risk also create heightened regulatory and stakeholder expectations on Westpac. Our ambition to become a nature-positive bank may lead to changes to policies and processes, which may present potential execution risk. Our ability to meet those ambitions will also be influenced by external factors beyond our control. As global standards for natural capital are at an early stage, regulatory risk and uncertainty remain elevated. We may be exposed to social and human rights risks through our operations, supply chain and in the provision of our products and services. Failure to identify and manage these risks may cause, contribute to, or be directly linked to adverse social and human rights impacts. This includes the risk that we provide services to, or rely on services provided by parties involved in human rights abuses or criminal activity, as well as the potential exploitation of our platforms and products for illicit purpose. Our ability to identify, assess, and mitigate these risks may be constrained by factors such as the sophistication of perpetrators. Data relevant to our assessment and management of climate, and other sustainability-related risks continues to mature. Reliance on third party data (which may not be sufficiently available or reliable), may affect our decision making, target setting and reporting, and affect our ability to meet our targets and commitments. Associated risks increase where disclosure of data is required by mandatory reporting. Actual or perceived failure to adapt our strategy, governance, procedures, systems and/or controls to manage or disclose climate and other sustainability-related risks and opportunities (including, for example, perceived misstatement of, or failure to adequately implement or meet, sustainability claims, commitments and/or targets) may give rise to business, reputational, legal and regulatory risks. This includes financial and credit risks that may impact our profitability and outlook, and the risk of regulatory action or litigation (including class actions) against us and/or our customers. We may also be subject, from time to time, to legal and business challenges due to actions instituted by activist or other groups. Examples of areas which have attracted activism and challenges include: the financing of businesses perceived to be at greater risk from climate-related physical and transition risks and/or perceived not to demonstrate responsible management of climate, human rights or other sustainability issues; the extent or quality of human rights due diligence that is carried out; and climate and sustainability related disclosures (including net-zero or emissions reduction strategies, targets and policies). Scrutiny from regulators, shareholders, activists and other stakeholders on climate-related risk management practices, lending policies, targets and commitments, and other sustainability products, claims and marketing practices will likely remain high. Applicable legal and regulatory regimes, policies, and reporting and other standards are also evolving. For example, in Australia, mandatory climate reporting has been introduced, and there is an increased compliance and enforcement focus by ASIC and the ACCC on a range of issues related to sustainability, sustainable finance, and monitoring/investigation of related claims. This increases compliance, legal and regulatory risks, and costs. |

| PERFORMANCE REVIEW DIRECTORS’ REPORT 2025 INTERIM FINANCIAL REPORT OTHER INFORMATION 63 Risk factors (Continued) For further detail on the identification, assessment and management of these risks, please refer to our 2024 Climate Report, and the Creating Value for the Community, Creating Value for the Environment, Risk Management and Sustainability Governance sections of the 2024 Annual Report. The failure to comply with financial crime obligations has had, and could have further, adverse effects on our business and reputation - Financial crime risk - Bribery and corruption - Tax evasion - Money laundering and terrorism financing - Economic and trade sanctions The Group is subject to various laws and rules regarding anti-money laundering and counter-terrorism financing (AML/CTF), anti-bribery and corruption, economic and trade sanctions and tax transparency across its operating jurisdictions (Financial Crime Laws). Financial Crime Laws can be complex and, in some circumstances, impose a diverse range of obligations. As a result, regulatory, operational and compliance risks are heightened. In some jurisdictions (e.g. the Pacific region), financial crime risks are elevated beyond the Group’s risk appetite requiring an appropriate action plan to reduce risk, and to return within appetite. Financial Crime Laws require us to report certain matters and transactions to regulators (such as international funds transfer instructions, threshold transaction reports, suspicious matter reports, Foreign Account Tax Compliance Act (FATCA) and Common Reporting Standard (CRS) reports) and to ensure that we know who our customers are and that we have appropriate ongoing customer due diligence in place. The failure to comply with some of these laws has had, and in the future could potentially have, adverse impacts for the Group. The Group operates within a landscape that is constantly changing, particularly with the emergence of new payment technologies, ongoing legislative reform impacting Financial Crime Laws, increased regulatory focus on digital assets, and increasing reliance on economic and trade sanctions to manage issues of international concern. These developments may require updates to the Group’s systems, policies, processes and controls to address emerging financial crime risks for the Group (as well as other risks including scams, fraud and technology-enabled crime). There has been, and continues to be, a focus on compliance with financial crime obligations. Regulators globally remain focused on continuing investigations and taking enforcement actions for identified non-compliance, often seeking significant penalties. Due to our scale of operations, undetected failures or the ineffective implementation, monitoring or remediation of a system, policy, process or control (including a regulatory reporting obligation) has resulted, and could in the future result, in a significant number of breaches of AML/CTF or other Financial Crime Laws, which could lead to significant financial penalties and other adverse impacts for the Group, such as reputational damage and litigation risk. While the Group has systems, policies, processes and controls in place designed to manage its financial crime obligations (including reporting obligations), these have not always been, and may not in the future always be, effective, due to reasons such as control deficiencies, technology failures or changes in financial crime risks or typologies. Our analysis and reviews, in addition to regulator feedback, have highlighted that our systems, policies, processes and controls are not always operating satisfactorily in a number of respects and require improvement. We continue to have an increased focus on financial crime risk management and, as such, further issues requiring attention have been identified and may continue to be identified. Although the Group provides updates to various regulators on its remediation and other program activities, there is no assurance that those or other regulators will agree that its remediation and program update activities will be adequate or effectively enhance the Group’s compliance programs. Failure to comply with our financial crime obligations has resulted, and could in the future result, in significant regulatory enforcement actions, reputational risks and other consequences as detailed in other sections of these Risk factors. There is additional information on financial crime matters in Significant Developments (pages 54-56). Reputational damage has harmed, and could in the future harm, our business and prospects - Reputational and sustainability risk - Negative customer outcomes We face reputational risk where our plans, processes, performance and behaviours differ from the expectations, beliefs and perceptions of our stakeholders. Our actions or inactions (or those of our customers, employees, suppliers, contractors, agents, authorised representatives, credit representatives, joint-venture partners, strategic partners or other counterparties) could result in reputational damage when they cause, or are perceived to cause, a negative outcome for customers, shareholders, the community or other stakeholders. This could arise from, for example, failure or perceived failure |

| 64 WESTPAC GROUP 2025 INTERIM FINANCIAL RESULTS DIRECTORS’ REPORT Risk factors (Continued) to adequately monitor, prevent or respond to community, environmental, social and ethical issues or expectations or failure to comply with regulatory requirements or expectations. We are also exposed to contagion risk from incidents in (or affecting) other financial institutions and/or the financial sector more broadly (e.g. issues affecting the cash-in-transit industry and the potential for disruption to the availability of cash, as well as flow on consequences including runs on cash). Failure, or perceived failure, to address issues that could or do give rise to reputational risk, has created, and could in the future create, additional legal risk, including regulatory investigations, regulatory enforcement actions, fines and penalties or litigation or other actions brought by third parties (including class actions), and the requirement to remediate and compensate customers, including prospective customers, investors and the market. It could also result in losing customers or restricting our ability to efficiently access capital markets. This could adversely affect our business, prospects, financial performance or financial condition. We have and could suffer losses due to litigation - Compliance and conduct risk - Enforcement action - Litigation - Class actions - Substantial fines and penalties Litigation has been, and could in the future be, commenced against us by a range of plaintiffs, such as customers, shareholders, employees, suppliers, counterparties, activists, receivers and regulators and may, either individually or in aggregate, adversely affect the Group’s business, operations, prospects, reputation or financial condition. Recently, there has been an increase in class action proceedings in the broader market, many of which have resulted in significant monetary settlements. The risk of class actions has been heightened by a number of factors, including regulatory enforcement actions and willingness by regulators to commence proceedings, increased regulatory investigations and inquiries, media scrutiny, increased prospect of regulatory reforms (including those that may eliminate any actual or perceived barriers to such litigation), and the growth of third party litigation funding. Class actions commenced against competitors could also lead to similar proceedings against us, and may also impact attitudes of counterparties to Westpac proceedings or Westpac’s standing more broadly. There has also been an increase in proceedings related to third party scams and fraud activity, and the bank has been and may be joined to such proceedings. Activism strategies directed at financial institutions, particularly related to climate change, sustainability, diversity equity and inclusion initiatives and energy transition, have also increased globally in recent years. These strategies may involve litigation to highlight issues, enforce legal or regulatory standards, or influence the target’s operations and activities. We are currently, and may continue to be, exposed to such litigation and/or activist strategies. Litigation is subject to many uncertainties and the outcome may not be predicted accurately. Furthermore, the Group’s ability to respond to and defend litigation may be adversely affected by inadequate record keeping. The Group’s ability to settle litigation on reasonable terms will be affected by attitudes of counterparties. Costs will be incurred associated with managing, responding to and/or defending litigation. Depending on the outcome of any litigation, the Group has been, and may in the future be, required to comply with broad court orders, including compliance orders, adverse publicity orders, enforcement orders or otherwise pay significant damages, fines, penalties or legal costs. The actual amount paid following a settlement or determination by a Court for any legal proceedings may be materially higher or lower than any relevant provision (where applicable) or that any contingent liability may be larger than anticipated. There is also a risk that additional litigation or contingent liabilities arise, all of which could adversely affect our business, prospects, reputation, financial performance or financial condition. There is additional information on certain legal proceedings that may affect the Group in Significant Developments (pages 54-56) and in Note 13 (pages 101-105) to the financial statements. We are exposed to adverse funding market conditions - Market risk - Volatility and disruption - Funding and liquidity risk - Credit risk We rely on deposits and global funding markets to fund our business and source liquidity. Our funding costs are subject to funding market and general economic and geopolitical conditions, in addition to our credit profile. Funding market conditions, and the behaviour of market participants, can shift significantly over very short periods of time, resulting in extreme volatility, disruption and decreased liquidity. The main risks we face relate to reduced |

| PERFORMANCE REVIEW DIRECTORS’ REPORT 2025 INTERIM FINANCIAL REPORT OTHER INFORMATION 65 Risk factors (Continued) market confidence, market access, appetite for exposure to Westpac; increased cost of funding; and impacts from deterioration in macroeconomic conditions. Additionally, shifts in investment preferences could result in deposit withdrawals, increasing our reliance on other funding sources. These other sources may offer lower levels of liquidity at higher costs. If market conditions deteriorate due to economic, political, regulatory, or other reasons (including those idiosyncratic to Westpac), there may be a loss of confidence in bank deposits, leading to unexpected withdrawals. These events can transpire quickly and be exacerbated by information transmission on social media. This could increase funding costs, constrain our liquidity, funding and lending activities and threaten our financial solvency. In such events, even robust levels of capital may not be sufficient to safeguard Westpac against detrimental loss of funding. If our current sources of funding become insufficient, we may need to seek alternatives, subject to market conditions, our credit ratings, reputation and confidence issues, and market capacity. These alternatives may be more expensive or on unfavourable terms. If we are unable to source appropriate funding, we may be forced to reduce or suspend business activities (e.g. lending) or operate with smaller liquidity buffers. If we are unable to source funding or generate liquidity for an extended period, we may not be able to pay our debts as and when they fall due or meet other contractual obligations. These outcomes may adversely affect our financial performance, liquidity, capital resources or financial condition. We also enter into collateralised derivative obligations, which may require us to post additional collateral based on market movements. This has the potential to adversely affect our liquidity or ability to use derivatives to hedge interest rate, currency and other financial risks. We could be adversely affected by the risk of inadequate capital levels - Capital adequacy - Capital risk - Regulatory capital requirements The Group is subject to the risk of an inadequate level or composition of capital to support business activities, meet regulatory capital requirements under normal or stressed conditions, and to maintain our solvency. Even robust levels of capital may not be sufficient to ensure our ongoing sustainability in the event of a bank run, where depositors quickly withdraw funds because of concerns about bank failure. Our capital levels are determined by regulation and risk appetite and informed by stress testing. We establish buffers on regulatory requirements to maintain capital adequacy during stressed periods by considering factors such as our balance sheet, forecasts, portfolio mix, potential capital headwinds (including real estate valuations, inflation and rising interest rates) and stressed outcomes. Stress testing models and assumptions may or may not accurately predict the nature and magnitude of particular stress events. The macroeconomic environment, stressed conditions and/or regulatory framework could result in a material increase to risk weighted assets, impact our capital adequacy, trigger capital distribution constraints, threaten our financial viability and/or require a highly dilutive capital raising. Capital distribution constraints apply when an ADI’s Common Equity Tier 1 Capital (CET1) ratio falls within the prudential capital buffer range (consisting of the Capital Conservation Buffer plus any Countercyclical Capital Buffer). This could impact future dividends and distributions on Additional Tier 1 (AT1) capital instruments. If AT1 and Tier 2 capital securities we have issued convert into ordinary shares (e.g. where our CET1 ratio falls below a certain level or APRA determines we would become non-viable without conversion of capital instruments or equivalent support), existing shareholders could face significant value dilution. Additionally, APRA has announced its intention to phase out AT1 capital instruments (see further discussion in Significant Developments (pages 54-56)). Our business is substantially dependent on the Australian and New Zealand economies, and could be adversely affected by a material downturn or shock to these economies or other financial systems - Strategic risk - Macroeconomic risks - Market disruption - Domestic and international economic conditions - Geopolitical risks - Credit risk Our revenues and earnings are dependent on domestic and international economic activity, business conditions and the level of financial services our customers require. Most of our business is conducted in Australia and New Zealand so our performance is influenced by the level and cyclical nature of activity in these countries. The financial services industry and capital markets have been, and may continue to be, adversely affected by volatility, global economic conditions (including inflation and rising interest rates), external events, geopolitical instability, political developments, cyberattacks or a major systemic shock. |

| 66 WESTPAC GROUP 2025 INTERIM FINANCIAL RESULTS DIRECTORS’ REPORT Risk factors (Continued) Market and economic disruptions (or the possibility of interest rates remaining higher for longer than anticipated) could cause consumer and business spending to decrease, unemployment to rise, demand for our products and services to decline and credit losses to increase, thereby reducing our earnings. These events could undermine confidence in the financial system, reduce liquidity, impair access to funding and adversely affect our customers and counterparties. Conversely, an environment with falling interest rates could reduce margins and also impact earnings. Given Australia’s reliance on exports, a slowdown in economic growth or change in policy settings of Australia’s major trading partners, which may be caused by their foreign policies (including the adoption of protectionist trade measures such as tariffs or sanctions) could negatively impact the Australian economy. This could result in reduced demand for our products and services and affect supply chains, the level of economic activity and the ability of our borrowers to repay their loans. The nature and consequences of any such events are difficult to predict but each of these factors could adversely affect our business, prospects, financial performance or financial condition. Declines in asset markets could adversely affect our operations or profitability and an increase in impairments and provisioning could adversely affect our financial performance or financial condition - Market risk - Decline in asset values - Impairments - Credit risk Declines in Australian, New Zealand or other asset markets, including equity, bond, residential and commercial property markets, have adversely affected, and could in the future adversely affect, our operations and profitability. Declining asset prices including as a result of change in taxation policies and potential legislation to restrict rents, could also impact customers and counterparties and the value of security (including residential and commercial property) we hold. This may impact our ability to recover amounts owing to us if customers or counterparties default. It may also affect our impairment charges and provisions, in turn impacting our financial performance, financial condition and capital levels. Declining asset prices could also impact our wealth management business as its earnings partly depend on fees based on the value of securities and/or assets held or managed. We establish provisions for credit impairment based on accounting standards using current information and our expectations. If economic conditions deteriorate beyond our expectations, some customers and/or counterparties could experience higher financial stress, leading to an increase in impairments, defaults and write-offs, and higher provisioning. Changes in regulatory expectations in relation to the treatment of customers in hardship could lead to increased impairments and/or higher provisioning. Such events could adversely affect our liquidity, capital resources, financial performance or financial condition. Credit risk also arises from certain derivative, clearing and settlement contracts we enter into, and from our dealings in, and holdings of, debt securities issued by other institutions and government agencies, the financial conditions of which may be affected to varying degrees by economic conditions in global financial markets. Sovereign risk may destabilise financial markets adversely - Sovereign risk - Defaults Potential sovereign contractual defaults, sovereign debt defaults and the risk that governments will nationalise parts of their economy including assets of financial institutions (such as Westpac) could negatively impact the value of our holdings of assets. Such an event could also destabilise global financial markets, adversely affecting our liquidity, financial performance or financial condition. We could be adversely affected by the failure to maintain our credit ratings - Availability of funding - Cost of funding - Downgrade Credit ratings are independent opinions on our creditworthiness. Our credit ratings can affect the cost and availability of our funding and may be important to investors, certain institutional customers and counterparties when evaluating their investments in the Group, our products and services. A rating downgrade could be driven by a downgrade of Australia’s sovereign credit rating, a material weakening in our financial performance, or one or more of the risks identified in this section or by other events including regulatory |

| PERFORMANCE REVIEW DIRECTORS’ REPORT 2025 INTERIM FINANCIAL REPORT OTHER INFORMATION 67 Risk factors (Continued) changes or changes to the methodologies rating agencies use to determine credit ratings. A credit rating or rating outlook could be downgraded or revised where credit rating agencies believe there is a very high level of uncertainty on the impact to key rating factors from a significant event. A downgrade to our credit ratings could have an adverse effect on our cost of funds, collateral requirements, liquidity, competitive position, our access to capital markets and our financial stability. The extent and nature of these impacts would depend on various factors, including the extent of any rating change, differences across agencies (split ratings) and whether competitors or the sector are also impacted. We face intense competition in all aspects of our business - Margins - Regulatory scrutiny - Strategic risk - New entrants The financial services industry is highly competitive, with a range of firms, including retail and commercial banks, investment banks, other financial service companies, fintech companies and businesses in other industries with financial services aspirations (including those who are not subject to the same capital and regulatory requirements or who derive substantial revenue from other markets, which may allow them to operate more flexibly and with lower costs of funds). Emerging competitors are also increasingly altering the competitive environment by adopting new business models or seeking to use new technologies to disrupt existing business models. The competitive environment may also change due to increased scrutiny by regulators in the sector and other legislative reforms, which will stimulate competition, improve customer choice and may prompt increased competition from new and existing firms. Competition in the various markets in which we operate has led, and may continue to lead, to a decline in our margins or market share. Deposits fund a significant portion of our balance sheet and have been a relatively stable source of funding. If we fail to successfully compete for deposits, we may face increased funding costs, leading us to seek access to other types of funding, or result in reduced lending. Our ability to compete depends on our ability to offer products and services that meet evolving customer preferences. Failure to adapt could result in lost customers, which could negatively impact our business, prospects, financial performance or financial condition. For more detail refer to Our Operating Environment section in the 2024 Annual Report. We have suffered, and could continue to suffer, losses due to operational risk - Operational risk - Change execution - Records management - Ineffective processes and controls - Fraud and scams - Third parties - AI Operational risk is the risk of loss resulting from inadequate or failed internal processes, people and systems or from external events. It includes, among other things, model, data, operations, change execution and third party risks. While we have policies, processes and controls to manage these risks, they have not always been, or may not be, effective. Ineffective processes and controls (including those of our contractors, agents, authorised representatives and credit representatives, or inadequate supervision and oversight of their activities) have resulted in, and could continue to result in, adverse outcomes for customers, employees or other third parties. Operational breakdowns can occur if measures are implemented too quickly without sufficient validation (or not quickly enough) in response to external events, potentially leading to financial losses, customer remediation, regulatory scrutiny and intervention, fines, penalties and capital overlays and, depending on the nature of the failure, litigation, including class action proceedings. Examples of operational risks include: • Fraud and scams. We have incurred, and could in the future incur, losses from fraud and scams, including fraudulent applications for loans (including misrepresentations by customers), or from incorrect or fraudulent |

| 68 WESTPAC GROUP 2025 INTERIM FINANCIAL RESULTS DIRECTORS’ REPORT Risk factors (Continued) payments and settlements. Such losses, including the potential for additional customer compensation and financial penalties, could increase significantly due to regulatory change. This includes if the Group does not adhere to obligations set out in the Scams Prevention Framework within the Competition and Consumer Act 2010 (Cth), which was introduced by the Scams Prevention Framework Act 2025 (Cth). Fraudulent conduct can also arise from external parties seeking to access our systems or customer accounts, the use of mule accounts, the use of accounts to commit investment scams and where identification records are compromised due to third party cybersecurity events. These risks are heightened by real-time transaction capability, and we are also exposed to contagion risk from incidents affecting other institutions. If systems, procedures and protocols for preventing and managing fraud, scams or improper access to our systems and customer accounts fail, or are inadequate or ineffective, they could lead to losses which could adversely affect our customers, business, prospects, reputation, financial performance or financial condition. Regulatory and compliance requirements can impede the ability to swiftly identify or respond to a fraud or scam, or to communicate with affected parties. • Records management. A failure to adequately implement and monitor effective records management policies and processes could impact our ability to safeguard information, locate records, respond to regulatory notices, conduct remediation, and meet record retention and destruction obligations. Where there are inadequacies in implementation of the records management lifecycle in our systems or embedding records management across the Group, these risks are further heightened. Where records are retained for longer than required this could increase the impacts of cyber and privacy incidents such as data breaches. • Artificial Intelligence (AI). As AI adoption to support our customers and business increases, we may become more exposed to risks associated with the use of this technology, such as lack of transparency, inaccurate data input, unintentional bias, breaches of confidentiality and privacy obligations, inaccurate outputs and decisions or other unintended consequences that are inconsistent with our policies or values. In addition, failure or delays in adopting AI could lead to competitive disadvantages or otherwise not leveraging capability that could support management of risk or improve customer outcomes. Leveraging AI could have financial, regulatory, conduct, reputational and customer impacts. • Third party. We rely on third parties, both in Australia and overseas, to provide services to us and our customers. Failures by these third parties, including our authorised representatives and credit representatives, to deliver services as required and in accordance with law, regulation and regulatory expectations could disrupt our ability to provide products and services and adversely impact our customers, operations, financial performance or reputation. For example, we rely on third parties to provide cash transport, handling and storage services. With reduced demand for cash placing pressure on the cash-in-transit (CIT) industry, we are exposed to operational risk including loss of (or delays in accessing) significant amounts of cash held by CIT providers on our behalf (this risk is exacerbated for us as we currently provide commercial cash distribution for the industry under an arrangement with one key industry participant which terminates in July 2025), reduced availability of cash in the system generally (which could lead to a run on cash), potential increased costs (for example, to enable us/third party providers to meet regulatory requirements or satisfy orders made by a tribunal), and related consequences where we or our customers suffer loss or damage due to disruptions to CIT services. • Change execution. We face risks in delivering technology and other change programs, including the risks that a change program fails to deliver the desired outcomes, or fails to reduce, pre-empt, mitigate and manage the challenges associated with transformation delivery. This could result in business disruption and delays, technology challenges, financial loss or further regulatory scrutiny. If our technology systems or financial infrastructure do not operate correctly, this may also cause loss or damage to us or our customers. This can also arise from complexities in our systems, and the interaction between those systems. This could include, for example, where systems issues result in incorrect fees or charges being applied to customers, or other poor customer outcomes. This could potentially lead to financial losses, customer remediation, regulatory scrutiny and intervention, fines, penalties and capital overlays and, depending on the nature of the failure, litigation, including class action proceedings. • Insurance coverage. There is a risk that we will not be able to obtain and/or have not obtained appropriate insurance coverage for the risks that we may be exposed to. This could be due to lack of available or adequate insurance, an increase in the cost of insurance, or failure of the insurance underwriter. If an insurance policy is not available or does not respond to a loss, we will not have the ability to recover such loss from an insurance policy. We could suffer losses due to market volatility - Market risk - Geopolitical risks - Volatility and disruption - Credit risk Market risk is the risk of an adverse impact on the Group’s financial performance, financial position, capital and liquidity, resulting from changes in market factors, such as foreign exchange rates, commodity prices, equity prices, credit spreads and interest rates. Market risk is present in both banking book and trading book. We are exposed |
| PERFORMANCE REVIEW DIRECTORS’ REPORT 2025 INTERIM FINANCIAL REPORT OTHER INFORMATION 69 Risk factors (Continued) to market risk due to our financial markets businesses, asset and liability management, our holdings in liquid asset securities, dependence on accessing capital markets and our defined benefit plan. Changes in market factors could be driven by a variety of developments including economic disruption, geopolitical events, trade tensions, market liquidity or concerns relating to major market participants or sectors. The resulting market volatility could potentially lead to losses and may adversely affect our financial performance and capital position. As a financial intermediary, we underwrite listed and unlisted debt securities. We could suffer losses if we fail to syndicate or sell down this risk to others. This risk is more pronounced in times of heightened market volatility. Poor data quality could adversely affect our business and operations - Operational risk - Data quality - Poor customer and risk outcomes Having accurate, complete and reliable data, supported by appropriate data controls, retention and, destruction methods and access to internal frameworks and processes, is critical to the effective operation of our businesses. Data plays a key role in determining how we provide products and services to customers, the effectiveness of our systems and risk management frameworks, strategic planning and our ability to make effective decisions. Some of our businesses are, and may continue to be, affected by poor data quality and/or limited data availability due to a number of factors, including inadequacies across systems, processes and policies, or ineffectively implemented data management frameworks. This could lead to poor customer service outcomes, adverse risk management outcomes, deficient system outputs and processes. This is because data quality inadequacies render such data unreliable to assist in making informed business decisions. Deficiencies with internal systems and processes could negatively impact our decision-making in areas such as the provision of credit to a customer, and the terms on which a credit facility is provided. The production of accurate data is also critical for other functions across the Group, such as financial and other reporting (internal and external). Poor data quality and availability impacts our ability to effectively monitor and manage operations across the Group, comply with production notices, respond to regulatory notices, defend and respond to litigation and conduct remediation activities. Conflicting data retention or destruction obligations may increase such risks. Poor data and/or poor data retention/destruction methods and deficient controls that result in control gaps and weaknesses, could negatively impact our ability to meet compliance obligations (including regulatory reporting obligations). Previously, this has led to regulatory investigations or adverse findings and actions against the Group, and such risks remain if we fail to maintain an acceptable level of data quality and effective oversight practices. Our data related frameworks and processes must be continuously reviewed, and improved where required, to ensure our data quality and data management practices remain relevant, fit for purpose and sustainable. This is because outdated or unsustainable practices may lead to inefficient data management practices and/or poor quality data. Potential consequences from holding poor quality data and/or having poor data oversight and controls include adverse impacts to the Group’s ability to effectively operate our existing businesses, securing prospective business from third parties, and our reputation, financial performance and financial condition. Certain strategic decisions may have adverse effects on our business - Strategic risk - Warranties and indemnities - Divestments and acquisitions - Implementation risk We evaluate and implement strategic decisions, priorities and objectives including where we can simplify or streamline, diversify or innovate our business or products. These activities can be complex, costly and may not proceed as planned. For example, we may experience difficulties completing certain transactions, separating or integrating businesses in the scheduled timeframe or at all, disruptions to operations, diversion of management resources or higher than expected transaction costs, impacts on third parties, and there may be differing market views about a strategic choice, which may cause reputational damage. Any failure to successfully divest businesses may expose us to higher operating costs and higher inherent risks in those businesses. Decisions to retain businesses may also expose us to the higher inherent risks in those businesses. For example, our Pacific businesses face several risks including heightened operational, sovereign, financial crime and exchange control risks which could adversely affect our customers, business, prospects, reputation, financial |
| 70 WESTPAC GROUP 2025 INTERIM FINANCIAL RESULTS DIRECTORS’ REPORT Risk factors (Continued) performance or financial condition. In divesting businesses, we have given (and could in future divestments give) warranties and indemnities in favour of counterparties relating to certain pre-completion matters and certain other commitments, including in relation to transitional services. These could result in a liability to make significant payments to these counterparties while these obligations remain on foot. To manage risks related to conduct and customer redress associated with divestments, we hold additional operational risk capital pursuant to APRA’s published guidance. These contingent liabilities are described in Note 13 (pages 101-105) to the financial statements. Acquiring and investing in businesses also comes with risks and costs, including underperformance, assumption of unknown and unaccounted for liabilities, regulatory risks or overvaluation of a target business. Operational, cultural, governance, compliance and risk appetite differences between us and an acquired business may lead to longer and costlier integration. Internal factors, for example, inadequate funding, resourcing, business capabilities or operating model, or failing to identify, understand or respond effectively to changes in the external business environment, including economic, geopolitical, regulatory, consumer sentiment, technological, environmental, social and competitive factors, may hinder successful strategy implementation. This could adversely affect us, including our ability to increase or maintain market share or resulting pressure on margins and fees. These risks could negatively impact our business, growth prospects, reputation, engagement with regulators, financial performance or financial condition. Other risks • Failure to recruit and retain key executives, employees and Directors may have adverse effects on our business, prospects, reputation, financial performance or financial condition. Macro-environmental factors including low unemployment, restricted migration levels, on-shoring of work and the competitive talent market, may also have an adverse impact on attracting specialist skills for the Group. • Changes to the critical accounting assumptions and estimates (outlined in Note 1 (pages 79-80) to the financial statements) could expose the Group to losses greater than those anticipated or recognised, which could adversely affect our financial performance, financial condition and reputation. Rounding of amounts ASIC Corporations (Rounding in Financial/Directors’ Reports) Instrument 2016/191 applies to Westpac and in accordance with that Legislative Instrument all amounts have been rounded to the nearest million dollars unless otherwise stated. |
| KPMG, an Australian partnership and a member firm of the KPMG global organisation of independent member firms affiliated with KPMG International Limited, a private English company limited by guarantee. All rights reserved. The KPMG name and logo are trademarks used under license by the independent member firms of the KPMG global organisation. Liability limited by a scheme approved under Professional Standards Legislation. Lead Auditor’s Independence Declaration under Section 307C of the Corporations Act 2001 To the Directors of Westpac Banking Corporation I declare that, to the best of my knowledge and belief, in relation to the review of Westpac Banking Corporation for the half year ended 31 March 2025 there have been: i. no contraventions of the auditor independence requirements as set out in the Corporations Act 2001 in relation to the review; and ii. no contraventions of any applicable code of professional conduct in relation to the review. KPMG Kim Lawry Partner Sydney 4 May 2025 PERFORMANCE REVIEW DIRECTORS’ REPORT 2025 INTERIM FINANCIAL REPORT OTHER INFORMATION 71 |
| 72 WESTPAC GROUP 2025 INTERIM FINANCIAL RESULTS DIRECTORS’ REPORT The Directors of Westpac Banking Corporation confirm that to the best of their knowledge: (i) the interim financial statements have been prepared in accordance with AASB 134 Interim Financial Reporting and are in compliance with IAS 34 Interim Financial Reporting issued by the International Accounting Standards Board; and (ii) the Directors’ report includes a fair review of the information required by DTR 4.2.7 R of the Disclosure Guidance and Transparency Rules of the United Kingdom Financial Conduct Authority. The Directors’ report is signed in accordance with a resolution of the Board of Directors. Steven Gregg Chairman Anthony Miller Managing Director and Chief Executive Officer Sydney, Australia 4 May 2025 |
| PERFORMANCE REVIEW DIRECTORS’ REPORT 2025 INTERIM FINANCIAL REPORT OTHER INFORMATION 73 2025 INTERIM FINANCIAL REPORT Consolidated income statement Consolidated statement of comprehensive income Consolidated balance sheet Consolidated statement of changes in equity Consolidated cash flow statement NOTES TO THE CONSOLIDATED FINANCIAL STATEMENTS Note 1. Financial statements preparation Note 2. Segment reporting Note 3. Net interest income and average balance sheet and interest rates Note 4. Non-interest income Note 5. Operating expenses Note 6. Income tax Note 7. Earnings per share Note 8. Loans Note 9. Provision for expected credit losses Note 10. Credit quality Note 11. Deposits and other borrowings Note 12. Fair values of financial assets and financial liabilities Note 13. Provisions, contingent liabilities, contingent assets and credit commitments Note 14. Shareholders’ equity Note 15. Notes to the consolidated cash flow statement Note 16. Subsequent events STATUTORY STATEMENTS Directors’ declaration Independent auditor's review report to the members of Westpac Banking Corporation |

| 74 WESTPAC GROUP 2025 INTERIM FINANCIAL RESULTS CONSOLIDATED INCOME STATEMENT Westpac Banking Corporation and its controlled entities Half Year Half Year Half Year % Mov't March Sept March Mar 25 Mar 25 $m Note 2025 2024 2024 - Sept 24 - Mar 24 Interest income: Calculated using the effective interest method 3 27,107 26,881 25,858 1 5 Other 3 977 922 686 6 42 Total interest income 28,084 27,803 26,544 1 6 Interest expense 3 (18,733) (18,177) (17,417) 3 8 Net interest income 9,351 9,626 9,127 (3) 2 Non-interest income Net fees 4 840 830 842 1 - Net wealth management 4 239 223 218 7 10 Trading 4 298 341 363 (13) (18) Other 4 65 (22) 40 large 63 Total non-interest income 1,442 1,372 1,463 5 (1) Net operating income 10,793 10,998 10,590 (2) 2 Operating expenses 5 (5,698) (5,549) (5,395) 3 6 Impairment (charges)/benefits 9 (250) (175) (362) 43 (31) Profit before income tax expense 4,845 5,274 4,833 (8) - Income tax expense 6 (1,520) (1,626) (1,491) (7) 2 Profit after income tax expense 3,325 3,648 3,342 (9) (1) Net profit attributable to non-controlling interests (NCI) (8) - - - - Net profit attributable to owners of Westpac Banking Corporation (WBC) 3,317 3,648 3,342 (9) (1) Earnings per share (cents) Basic 7 96.7 105.4 95.6 (8) 1 Diluted 7 96.0 102.5 91.6 (6) 5 The above consolidated income statement should be read in conjunction with the accompanying notes. |
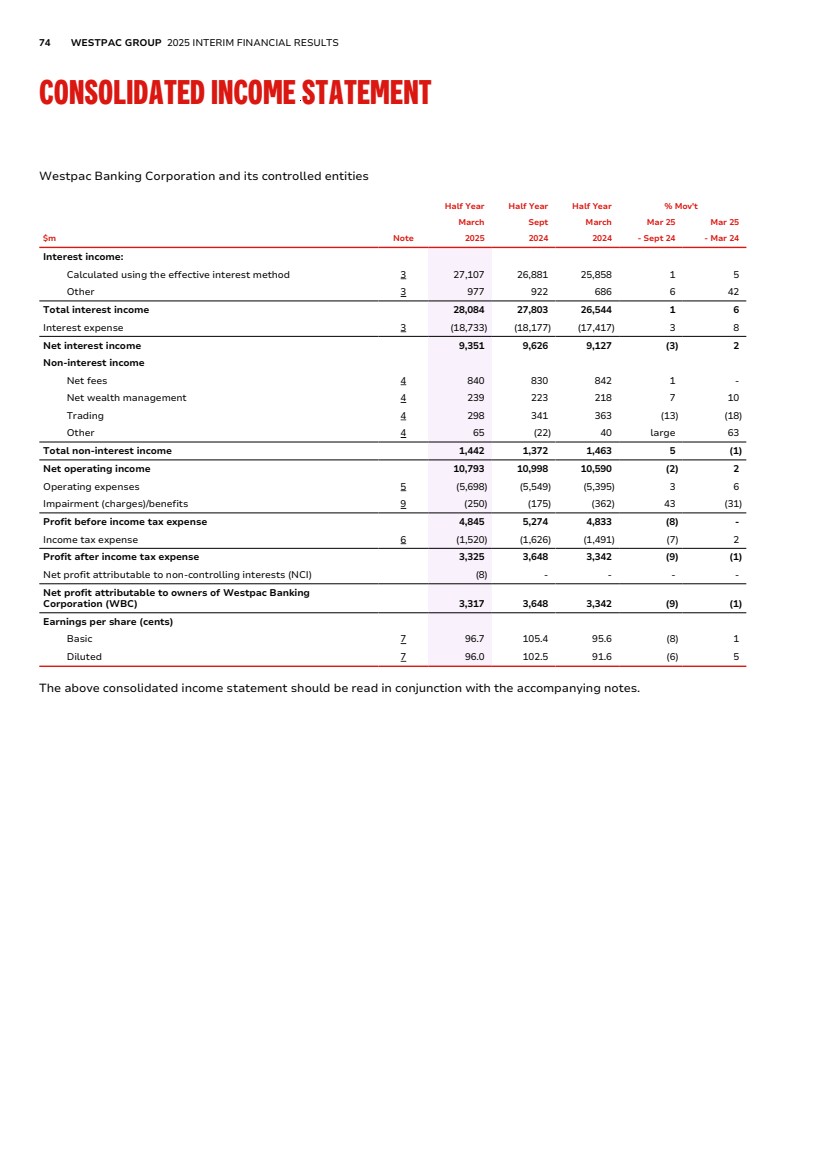
| PERFORMANCE REVIEW DIRECTORS’ REPORT 2025 INTERIM FINANCIAL REPORT OTHER INFORMATION 75 CONSOLIDATED STATEMENT OF COMPREHENSIVE INCOME Westpac Banking Corporation and its controlled entities Half Year Half Year Half Year % Mov't March Sept March Mar 25 Mar 25 $m 2025 2024 2024 - Sept 24 - Mar 24 Profit after income tax expense 3,325 3,648 3,342 (9) (1) Other comprehensive income/(expense) Items that may be reclassified subsequently to profit or loss Gains/(losses) recognised in equity on: Debt securities measured at fair value through other comprehensive income (FVOCI) (9) (557) (31) (98) (71) Cash flow hedging instruments (39) 49 452 large large Transferred to income statement: Debt securities measured at FVOCI (4) 4 1 large large Cash flow hedging instruments 214 57 20 large large Loss allowance on debt securities measured at FVOCI - - 1 - (100) Exchange differences on translation of foreign operations (net of associated hedges) 87 (138) (162) large large Income tax on items taken to or transferred from equity: Debt securities measured at FVOCI 5 167 12 (97) (58) Cash flow hedging instruments (53) (35) (147) 51 (64) Items that will not be reclassified subsequently to profit or loss Gains/(losses) on equity securities measured at FVOCI (net of tax) 31 (15) 16 large 94 Own credit adjustment on financial liabilities designated at fair value (net of tax) (20) 30 (17) large 18 Remeasurement of defined benefit obligation recognised in equity (net of tax) (10) 41 (55) large (82) Net other comprehensive income/(expense) (net of tax) 202 (397) 90 large 124 Total comprehensive income 3,527 3,251 3,432 8 3 Attributable to: Owners of WBC 3,519 3,252 3,433 8 3 NCI 8 (1) (1) large large Total comprehensive income 3,527 3,251 3,432 8 3 The above consolidated statement of comprehensive income should be read in conjunction with the accompanying notes. |
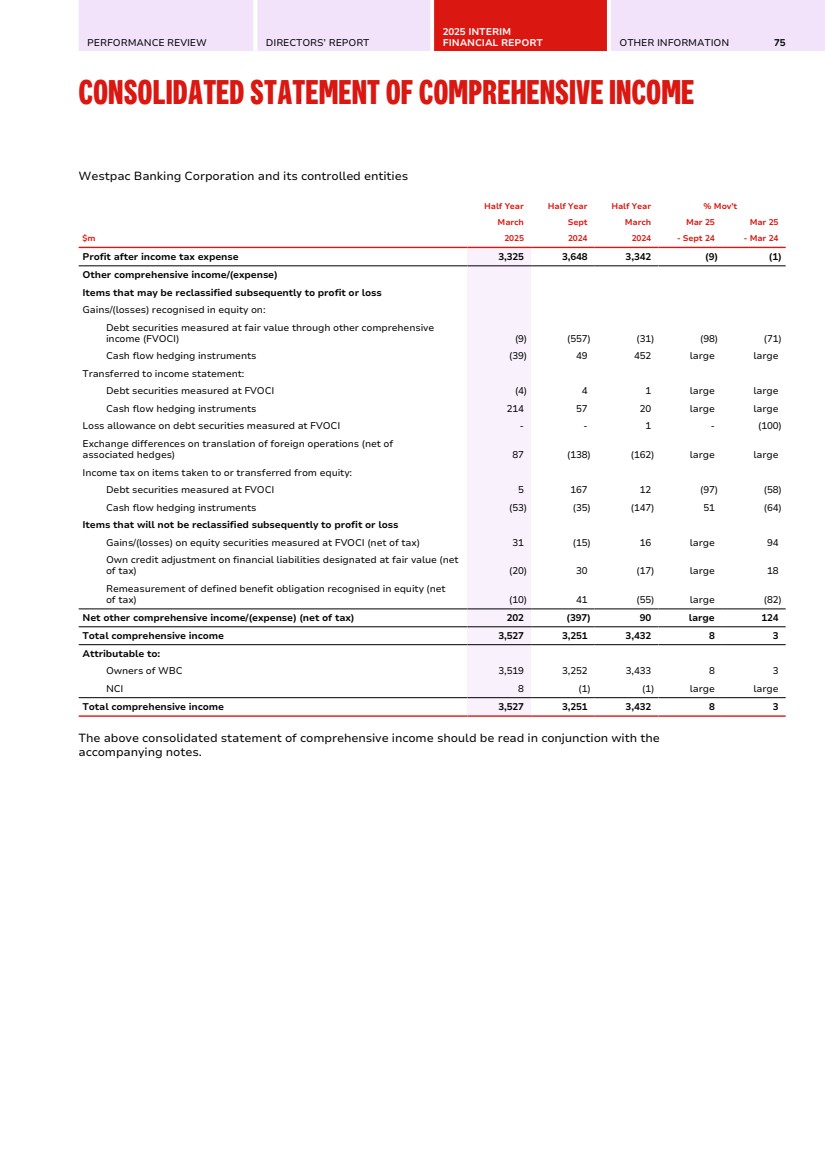
| 76 WESTPAC GROUP 2025 INTERIM FINANCIAL RESULTS CONSOLIDATED BALANCE SHEET Westpac Banking Corporation and its controlled entities As at As at As at % Mov't 31 March 30 Sept 31 March Mar 25 Mar 25 $m Note 2025 2024 2024 - Sept 24 - Mar 24 Assets Cash and balances with central banks 58,352 65,667 95,907 (11) (39) Collateral paid 6,190 6,269 4,671 (1) 33 Trading securities and financial assets measured at fair value through income statement (FVIS) 51,088 49,228 33,943 4 51 Derivative financial instruments 19,347 24,109 15,795 (20) 22 Investment securities 115,186 103,885 90,587 11 27 Loans 8 824,808 806,767 784,839 2 5 Other financial assets 7,886 5,456 11,266 45 (30) Property and equipment 2,254 2,251 2,179 - 3 Tax assets 2,095 2,160 1,999 (3) 5 Intangible assets 10,599 10,746 10,708 (1) (1) Other assets 1,088 1,006 767 8 42 Total assets 1,098,893 1,077,544 1,052,661 2 4 Liabilities Collateral received 3,738 3,078 2,534 21 48 Deposits and other borrowings 11 739,250 720,489 702,226 3 5 Other financial liabilities 44,681 38,077 54,392 17 (18) Derivative financial instruments 21,520 30,974 18,417 (31) 17 Debt issues 171,864 169,284 159,781 2 8 Tax liabilities 23 569 459 (96) (95) Provisions 13 2,254 2,505 2,414 (10) (7) Other liabilities 2,507 2,633 2,598 (5) (4) Total liabilities excluding loan capital 985,837 967,609 942,821 2 5 Loan capital 40,703 37,883 37,280 7 9 Total liabilities 1,026,540 1,005,492 980,101 2 5 Net assets 72,353 72,052 72,560 - - Shareholders’ equity Share capital: Ordinary share capital 14 37,354 37,958 38,944 (2) (4) Treasury shares 14 (820) (758) (758) 8 8 Reserves 14 2,030 1,732 2,157 17 (6) Retained profits 33,451 32,773 32,179 2 4 Total equity attributable to owners of WBC 72,015 71,705 72,522 - (1) NCI 14 338 347 38 (3) large Total shareholders' equity and NCI 72,353 72,052 72,560 - - The above consolidated balance sheet should be read in conjunction with the accompanying notes. |
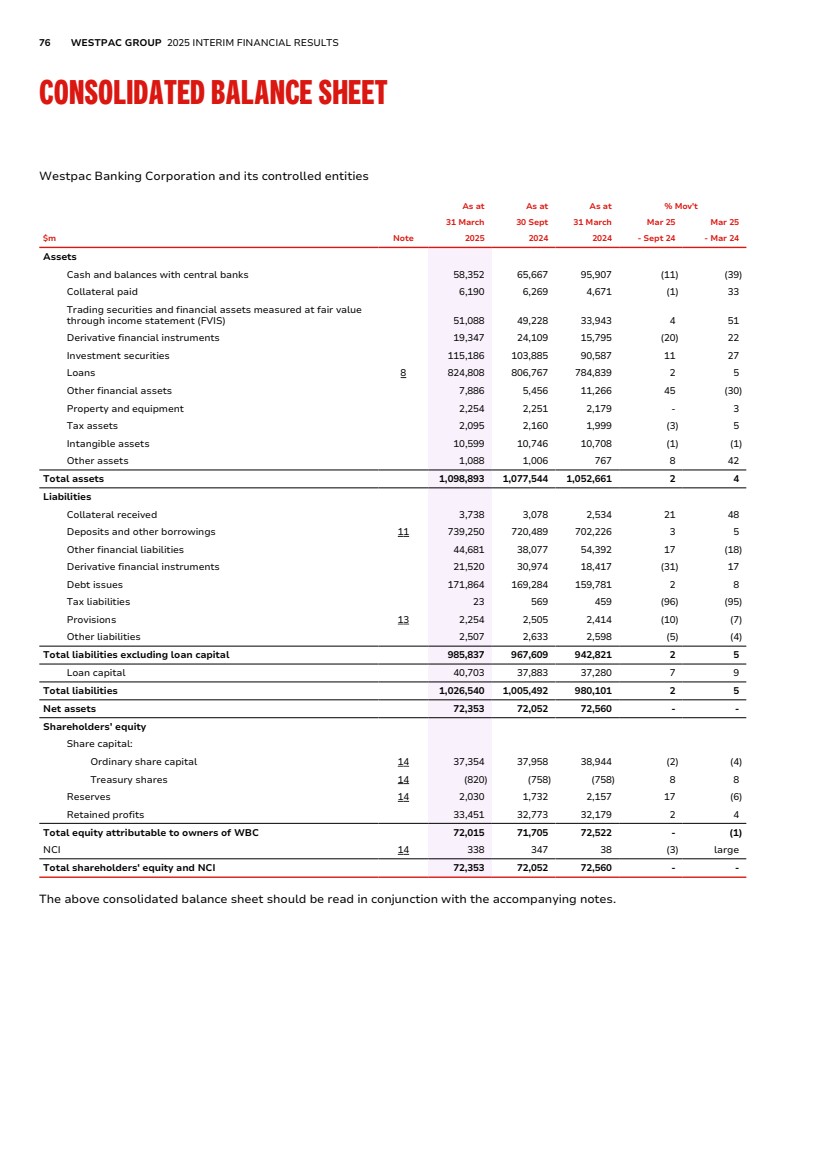
| PERFORMANCE REVIEW DIRECTORS’ REPORT 2025 INTERIM FINANCIAL REPORT OTHER INFORMATION 77 CONSOLIDATED STATEMENT OF CHANGES IN EQUITY Westpac Banking Corporation and its controlled entities $m Share capital (Note 14) Reserves (Note 14) Retained profits Total equity attributable to owners of WBC NCI Total shareholders' equity and NCI Balance as at 30 September 2023 39,124 1,935 31,436 72,495 44 72,539 Profit after income tax expense - - 3,342 3,342 - 3,342 Net other comprehensive income/(expense) - 163 (72) 91 (1) 90 Total comprehensive income/(expense) - 163 3,270 3,433 (1) 3,432 Transactions in capacity as equity holders Dividends on ordinary sharesa - - (2,527) (2,527) - (2,527) Share buybackb (849) - - (849) - (849) Other equity movements: Share-based payment arrangements - 59 - 59 - 59 Purchase of shares (33) - - (33) - (33) Net acquisition of treasury shares (56) - - (56) - (56) Other - - - - (5) (5) Total contributions and distributions (938) 59 (2,527) (3,406) (5) (3,411) Balance as at 31 March 2024 38,186 2,157 32,179 72,522 38 72,560 Profit after income tax expense - - 3,648 3,648 - 3,648 Net other comprehensive income/(expense) - (467) 71 (396) (1) (397) Total comprehensive income/(expense) - (467) 3,719 3,252 (1) 3,251 Transactions in capacity as equity holders Dividends on ordinary sharesa - - (3,125) (3,125) - (3,125) Share buybackb (963) - - (963) - (963) Other equity movements: Share-based payment arrangements - 37 - 37 - 37 Purchase of shares (23) - - (23) - (23) Net acquisition of treasury shares - - - - - - Acquisition of minority interestc - 5 - 5 (30) (25) Preference shares issuedd - - - - 339 339 Other - - - - 1 1 Total contributions and distributions (986) 42 (3,125) (4,069) 310 (3,759) Balance as at 30 September 2024 37,200 1,732 32,773 71,705 347 72,052 Profit after income tax expense - - 3,317 3,317 8 3,325 Net other comprehensive income/(expense) - 232 (30) 202 - 202 Total comprehensive income/(expense) - 232 3,287 3,519 8 3,527 Transactions in capacity as equity holders: Dividends on ordinary sharesa - - (2,614) (2,614) - (2,614) Share buybackb (581) - - (581) - (581) Other equity movements: Share-based payment arrangements - 67 - 67 - 67 Purchase of shares (21) - - (21) - (21) Net acquisition of treasury shares (64) - - (64) - (64) Other - (1) 5 4 (17) (13) Total contributions and distributions (666) 66 (2,609) (3,209) (17) (3,226) Balance as at 31 March 2025 36,534 2,030 33,451 72,015 338 72,353 a. Relates to fully franked dividends at 30%: - First Half 2025: 2024 final dividend of 76 cents per share; - Second Half 2024: 2024 interim dividend of 75 cents per share and special dividend of 15 cents per share; and - First Half 2024: 2023 final dividend of 72 cents per share. b. Westpac previously announced its intention to undertake a $3.5 billion on market buyback of WBC ordinary shares. In First Half 2025, Westpac has bought back and cancelled 17,711,952 ordinary shares. A further 497,280 shares were acquired on 31 March 2025 and cancelled on 2 April 2025 (Second Half 2024: 33,223,149, First Half 2024: 34,442,450). The ordinary shares were bought back at an average price of $31.92 (Second Half 2024: $28.99, First Half 2024: $24.65). c. During 2024, Westpac acquired 8.74% of the non-controlling interest in Westpac Bank-PNG-Limited, which raised its interest to 98.65%. d. During 2024, Westpac New Zealand Limited issued NZD 375 million (AUD 339 million) of perpetual preference shares that qualified as Additional Tier 1 capital under RBNZ's criteria. Westpac recognises this instrument as a non-controlling interest. The above consolidated statement of changes in equity should be read in conjunction with the accompanying notes. |
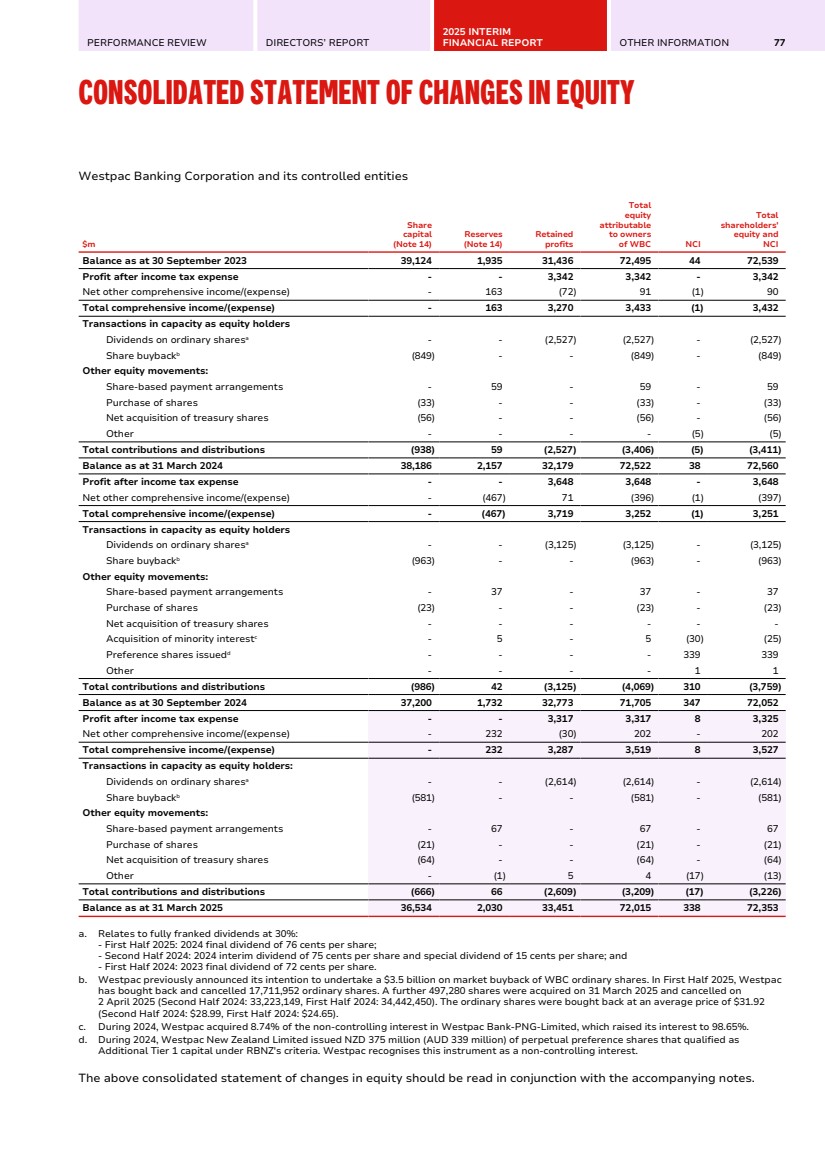
| 78 WESTPAC GROUP 2025 INTERIM FINANCIAL RESULTS CONSOLIDATED CASH FLOW STATEMENT Westpac Banking Corporation and its controlled entities Half Year Half Year Half Year % Mov't March Sept March Mar 25 Mar 25 $m Note 2025 2024 2024 - Sept 24 - Mar 24 Cash flows from operating activities Interest received 27,288 26,849 25,666 2 6 Interest paid (18,331) (17,457) (16,543) 5 11 Dividends received 1 3 - (67) - Other non-interest income received 361 2,377 1,937 (85) (81) Operating expenses paid (5,240) (4,730) (4,949) 11 6 Income tax paid (2,026) (1,557) (1,812) 30 12 Cash flows from operating activities before changes in operating assets and liabilities 2,053 5,485 4,299 (63) (52) Net (increase)/decrease in: Collateral paid 555 (1,882) (215) large large Trading securities and financial assets measured at FVIS (1,394) (15,530) (3,464) (91) (60) Derivative financial instruments 8,256 (1,149) 313 large large Loans (19,357) (22,346) (12,737) (13) 52 Other financial assets (269) (9) (339) large (21) Other assets 17 (38) 4 large large Net increase/(decrease) in: Collateral received 378 653 (971) (42) large Deposits and other borrowings 16,833 19,761 15,482 (15) 9 Other financial liabilities 4,895 (10,842) 3,758 large 30 Other liabilities 2 5 (5) (60) large Net cash provided by/(used in) operating activities 15 11,969 (25,892) 6,125 large 95 Cash flows from investing activities Proceeds from investment securities 24,663 27,979 19,645 (12) 26 Purchase of investment securities (34,850) (40,415) (32,371) (14) 8 Purchase of controlled entities and other businesses - (30) - (100) - Purchase of associates (10) (4) - 150 - Proceeds from sale of loans portfolioa 1,472 - - - - Proceeds from disposal of property and equipment 12 40 6 (70) 100 Purchase of property and equipment (142) (145) (90) (2) 58 Purchase of intangible assets (347) (453) (329) (23) 5 Net cash provided by/(used in) investing activities (9,202) (13,028) (13,139) (29) (30) Cash flows from financing activities Proceeds from debt issues (net of issue costs)b 34,106 39,606 40,639 (14) (16) Redemption of debt issuesb (42,508) (27,226) (39,874) 56 7 Payments for the principal portion of lease liabilities (200) (208) (208) (4) (4) Issue of loan capital (net of issue costs) 3,538 2,740 3,586 29 (1) Redemption of loan capital (2,474) (1,945) (12) 27 large Payment for share buyback (565) (963) (849) (41) (33) Issue of perpetual preference shares (net of issue cost) - 339 - (100) - Purchase of shares relating to share-based payment arrangements (21) (23) (33) (9) (36) Purchase of treasury shares (including RSP and EIP restricted shares) (64) - (56) - 14 Net sale/(purchase) of other treasury shares - - - - - Payment of dividends (2,614) (3,125) (2,527) (16) 3 Dividends paid to NCI (13) 1 (5) large 160 Purchase of shares from NCI - (25) - (100) - Net cash provided by/(used in) financing activitiesb (10,815) 9,171 661 large large Net increase/(decrease) in cash and balances with central banks (8,048) (29,749) (6,353) (73) 27 Effect of exchange rate changes on cash and balances with central banks 733 (491) (262) large large Cash and balances with central banks as at beginning of the period 65,667 95,907 102,522 (32) (36) Cash and balances with central banks as at end of the period 58,352 65,667 95,907 (11) (39) a. The sale of the auto finance loan portfolio to Resimac Group Limited was completed on 1 March 2025. A loss on sale of $8 million is included in Net gain/(loss) on disposal of assets in Note 4 (page 87). b. Comparatives for the First Half 2024 were revised to report short-term debt issuances and redemptions that were issued and redeemed within the same period on a gross basis. The above consolidated cash flow statement should be read in conjunction with the accompanying notes. |
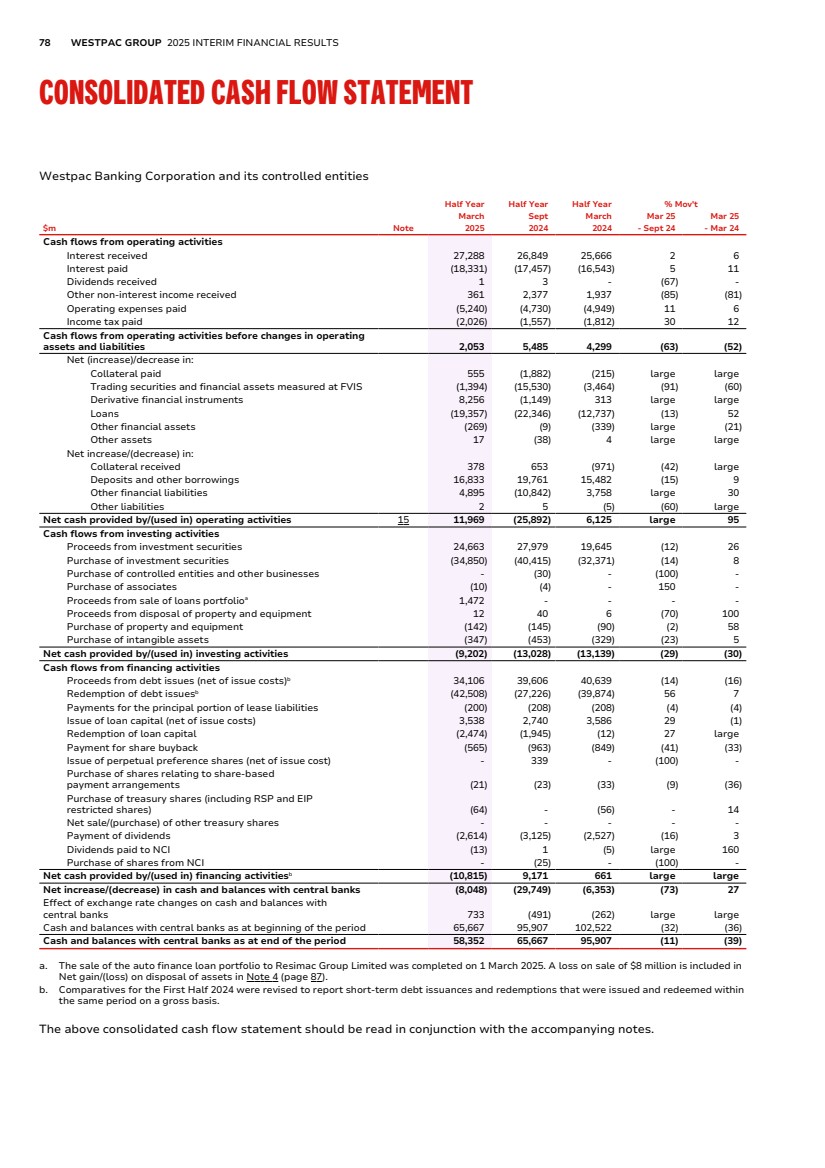
| PERFORMANCE REVIEW DIRECTORS’ REPORT 2025 INTERIM FINANCIAL REPORT OTHER INFORMATION 79 NOTES TO THE CONSOLIDATED FINANCIAL STATEMENTS Note 1. Financial statements preparation This general purpose Interim Financial Report for the half year ended 31 March 2025 has been prepared in accordance with Australian Accounting Standard AASB 134 Interim Financial Reporting and the Corporations Act 2001 (Cth) and is also compliant with International Accounting Standard IAS 34 Interim Financial Reporting. The Interim Financial Report does not include all the notes of the type normally included in an Annual Financial Report. Accordingly, this Interim Financial Report is to be read in conjunction with the Annual Financial Report for the year ended 30 September 2024 and any relevant public announcements made by Westpac during the interim reporting period in accordance with the continuous disclosure requirements of the Corporations Act 2001 (Cth) and the ASX Listing Rules. The Interim Financial Report complies with current Australian Accounting Standards (AAS) as they relate to Interim Financial reports. The Interim Financial Report was authorised for issue by the Board of Directors on 4 May 2025. All amounts have been rounded in accordance with ASIC Corporations (Rounding in Financial/Directors’ Reports) Instrument 2016/191, to the nearest million dollars, unless otherwise stated. Accounting policies The accounting policies adopted in the preparation of this Interim Financial Report are consistent with those in the Annual Financial Report for the year ended 30 September 2024. Critical accounting assumptions and estimates In preparing the Interim Financial Report, the application of the Group’s accounting policies requires the use of judgement, assumptions and estimates. The areas of judgement, assumptions and estimates in the Interim Financial Report, including the key sources of estimation uncertainty, are consistent with those in the Annual Financial Report for the year ended 30 September 2024 with the exception of the below. Geopolitical developments in the lead up to 31 March 2025, including in relation to international trade and tariff policies, have led to heightened uncertainty as to future economic forecasts and potential impacts on the Group and its customers. Responding to this heightened uncertainty, the Group has increased the weighting of the downside scenario used in the estimate of expected credit losses from 42.5% to 45% (refer to Note 9 (pages 90-94) for further details). These developments have continued following 31 March 2025, and as a result estimates of expected credit losses are subject to a higher than usual level of uncertainty. Future developments (i) Accounting standards AASB 9 Financial Instruments (AASB 9) became effective for the Group for the financial year ended 30 September 2019. When adopted, as permitted by the standard, the Group elected to continue to comply with the hedge accounting requirements under AASB 139. The Group intends to adopt the hedge accounting requirements of AASB 9 prospectively for the financial year beginning 1 October 2025. All the Group’s existing hedge accounting relationships will continue to qualify for hedge accounting. It is intended to introduce a new hedge accounting relationship under AASB 9 for our foreign currency term funding over cross currency basis risk. This will result in associated costs of hedging being reflected in a new cost of hedging reserve (COHR) rather than through the income statement. The quantum of the impact of this will be based on the valuation of the derivatives at the time. AASB 18 Presentation and Disclosure in Financial Statements (AASB 18) was issued on 7 June 2024 and will be effective for the 30 September 2028 year end unless early adopted. AASB 18 will replace AASB 101 Presentation of Financial Statements. This standard will not change the recognition and measurement of items in the financial statements, but will impact the presentation and disclosure in the financial statements, including: • new categories and subtotals in the income statement to enhance comparability; • enhancing the disclosure of management defined performance measures; and • changes to the grouping of information in the financial statements to provide more useful information. Westpac is continuing to assess the impact of adopting AASB 18. AASB 2024-2 Amendments to Australian Accounting Standards – Classification and Measurement of Financial Instruments (AASB 2024-2) was issued on 29 July 2024 and is effective for the 30 September 2027 year end unless early adopted. The amendments include: • changes to disclosures for investments in equity instruments designated at fair value through other comprehensive income and additional disclosures for financial instruments with contingent features that do not relate directly to basic lending risks and costs; |
| 80 WESTPAC GROUP 2025 INTERIM FINANCIAL RESULTS NOTES TO THE CONSOLIDATED FINANCIAL STATEMENTS Note 1. Financial statements preparation (Continued) • guidance on derecognition of financial liabilities criteria when using an electronic payments system; and • guidance on assessing contractual cash flow characteristics of financial assets with environmental, social and corporate governance (ESG) and similar features. Westpac is continuing to assess the impact of adopting AASB 2024-2. (ii) Other developments AASB S1 General Requirements for Disclosure of Sustainability-related Financial Information (AASB S1) and AASB S2 Climate-related Disclosures (AASB S2) were issued by the AASB on 20 September 2024. AASB S1 is a voluntary standard while AASB S2 is mandatory. Both standards are effective for the Group for the 30 September 2026 year end unless early adopted. These standards are Australian Sustainability Reporting Standards which are issued by the AASB and set out the sustainability-related and climate-related financial disclosures for sustainability reports and general purpose financial reports. The main features of these standards are described below. AASB S1 This Standard applies to reporting sustainability-related financial information across a range of possible sustainability topics, including climate-related financial disclosures that form part of an entity’s general-purpose financial reporting. It sets out general requirements for the presentation of those disclosures, guidelines for their structure and minimum requirements for their content (including disclosures on governance, strategy, risk management, and metrics and targets), the location of disclosures, the timing of reporting and disclosures relating to judgements, uncertainties and errors. AASB S2 This standard sets out disclosure requirements in general purpose financial reports about climate-related risks and opportunities that could reasonably be expected to affect the entity’s cash flows, access to finance or cost of capital over the short, medium or long term. The main climate-related financial disclosure requirements relate to four key areas of governance, strategy, risk management, and metrics and targets. The standard also requires disclosures on scenario analysis and greenhouse gas emissions (Scope 1, 2 and 3). General requirements such as the conceptual foundations for reporting such information, the location of disclosures, the timing of reporting and disclosures relating to judgements, uncertainties and errors are also provided. The Group is continuing to assess the impact of adopting AASB S1 and AASB S2. Comparative revisions Comparative information has been revised where appropriate to conform to changes in presentation in the current period and to enhance comparability. |

| PERFORMANCE REVIEW DIRECTORS’ REPORT 2025 INTERIM FINANCIAL REPORT OTHER INFORMATION 81 Note 2. Segment reporting Operating segments are presented on a basis consistent with information provided internally to Westpac’s key decision makers and reflect the management of the business, rather than the legal structure of Westpac. The statutory amount of the net operating income and operating expenses segment line items are separated to show the balances excluding Notable Items and the total Notable Items for each of these categories. This is consistent with the information provided internally to Westpac’s key decision makers. Notable Items are items that management believes are not reflective of Westpac’s ongoing business performance and are grouped into the following broad categories: • Unrealised fair value gains and losses on economic hedges that do not qualify for hedge accounting • Net ineffectiveness on qualifying hedges • Large items that are not reflective of the Westpac’s ordinary operations. In individual reporting periods large items may include: – Provisions for remediation, litigation, fines and penalties – The impact of asset sales and revaluations – The write-down of assets (including goodwill and capitalised software) – Restructuring costs Internal charges and transfer pricing adjustments have been reflected in the performance of each of operating segment. Inter-segment pricing is determined on an arm’s length basis. Reportable operating segments We are one of Australia’s leading providers of banking and selected financial services, operating under multiple brands, and predominantly in Australia and New Zealand, with a small presence in Europe, North America, Asia and the Pacific. We operate significant online capability supported by an extensive branch and ATM network, call centres and relationship bankers. Our operations comprise the following key segments: • Consumer provides banking products and services to customers in Australia through three lines of business consisting of mortgages, consumer finance and cash and transactional banking. • Business & Wealth comprises Business Banking for customers generally up to $200 million in exposure, Wealth Management, Private Wealth and Westpac Pacific. For part of the period the segment included our auto finance portfolio, which has been in runoff and was sold in March 2025. • Westpac Institutional Bank (WIB) delivers a broad range of financial products and services to corporate, institutional and government customers. • Westpac New Zealand provides banking, and wealth products and services for consumer, business and institutional customers in New Zealand. • Group Businesses includes Treasury, Enterprise services and other costs not directly attributable to segments including Corporate Affairs, a portion of enterprise technology costs related to UNITE in prior periods, certain customer remediation expenses and enterprise provisions. It also includes Group-wide elimination entries arising on consolidation. |
| 82 WESTPAC GROUP 2025 INTERIM FINANCIAL RESULTS NOTES TO THE CONSOLIDATED FINANCIAL STATEMENTS Note 2. Segment reporting (Continued) The following tables present the segment results for Westpac: $m Consumer Business & Wealth Westpac Institutional Bank Westpac New Zealand (A$) Group Businesses Total Notable Items (pre-tax) Income statement Half Year Mar 25 Net interest income 3,852 2,697 1,177 1,236 607 9,569 (218) 9,351 Net fee income 271 150 343 80 (4) 840 - 840 Net wealth management income - 219 - 21 (1) 239 - 239 Trading income 1 31 228 20 - 280 18 298 Other income 8 (4) 48 - 13 65 - 65 Notable Items - - - (1) (199) (200) 200 - Net operating income 4,132 3,093 1,796 1,356 416 10,793 - 10,793 Operating expenses (2,420) (1,368) (791) (665) (454) (5,698) - (5,698) Total operating expenses (2,420) (1,368) (791) (665) (454) (5,698) - (5,698) Pre-provision profit 1,712 1,725 1,005 691 (38) 5,095 - 5,095 Impairment (charges)/benefits (142) (117) 39 (30) - (250) - (250) Profit before income tax expense 1,570 1,608 1,044 661 (38) 4,845 - 4,845 Income tax (expense)/benefita (482) (490) (286) (185) (77) (1,520) - (1,520) Net profit attributable to NCI - - - - (8) (8) - (8) Net profit attributable to owners of WBC 1,088 1,118 758 476 (123) 3,317 - 3,317 Notable Items (post-tax) - - - (1) (139) (140) Balance sheet Loans 517,158 106,845 106,953 93,789 63 824,808 Deposits and other borrowings 350,968 148,242 122,303 75,473 42,264 739,250 Half Year Sept 24 Net interest income 3,861 2,722 1,150 1,217 615 9,565 61 9,626 Net fee income 262 156 318 93 1 830 - 830 Net wealth management income - 206 - 20 (3) 223 - 223 Trading income - 27 322 20 (18) 351 (10) 341 Other income 11 - (41) 2 6 (22) - (22) Notable Items - - - (2) 53 51 (51) - Net operating income 4,134 3,111 1,749 1,350 654 10,998 - 10,998 Operating expenses (2,422) (1,370) (756) (616) (385) (5,549) - (5,549) Total operating expenses (2,422) (1,370) (756) (616) (385) (5,549) - (5,549) Pre-provision profit 1,712 1,741 993 734 269 5,449 - 5,449 Impairment (charges)/benefits (104) (47) (19) (3) (2) (175) - (175) Profit before income tax expense 1,608 1,694 974 731 267 5,274 - 5,274 Income tax (expense)/benefita (482) (513) (288) (203) (140) (1,626) - (1,626) Net profit attributable to NCI - - - - - - - - Net profit attributable to owners of WBC 1,126 1,181 686 528 127 3,648 - 3,648 Notable Items (post-tax) - - - (2) 43 41 Balance sheet Loans 510,317 101,989 100,582 93,833 46 806,767 Deposits and other borrowings 334,462 144,289 119,795 74,912 47,031 720,489 a. Includes tax benefit on Notable Items of $60 million (Second Half 2024: $10 million expense). |
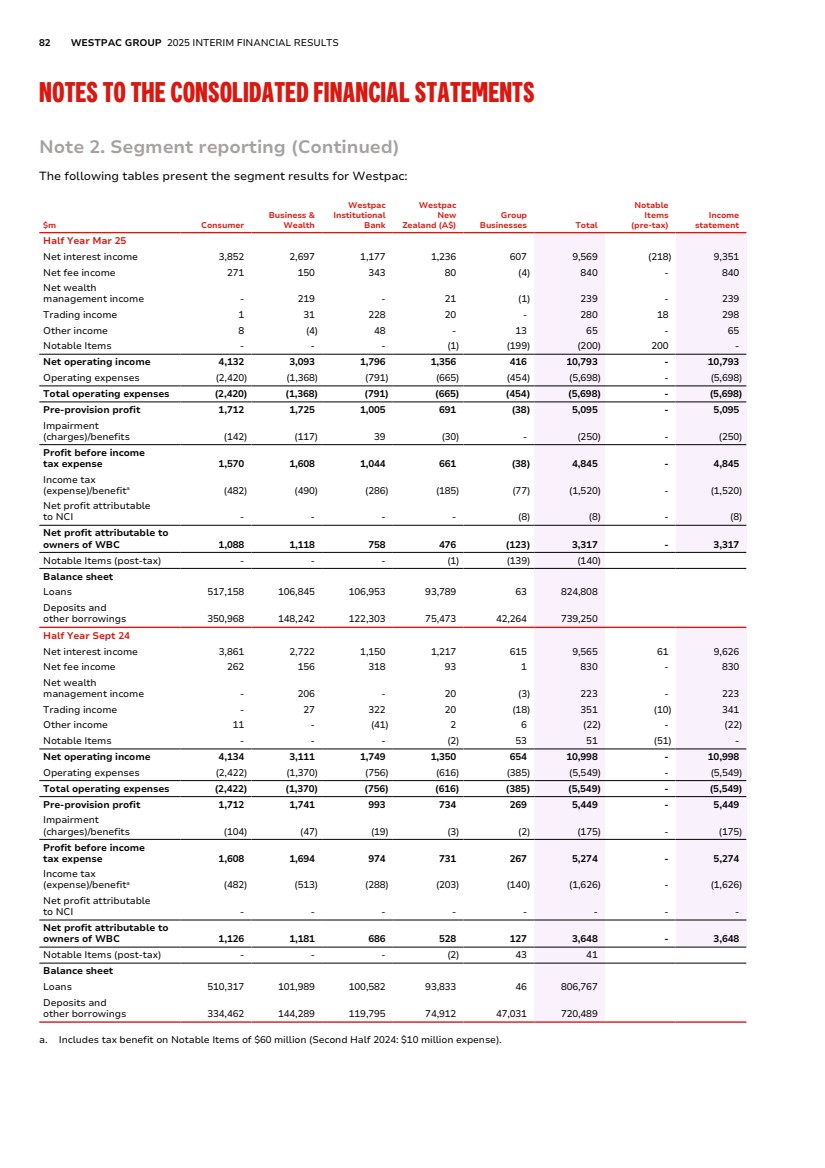
| PERFORMANCE REVIEW DIRECTORS’ REPORT 2025 INTERIM FINANCIAL REPORT OTHER INFORMATION 83 Note 2. Segment reporting (Continued) $m Consumer Business & Wealth Westpac Institutional Bank Westpac New Zealand (A$) Group Businesses Total Notable Items (pre-tax) Income statement Half Year Mar 24 Net interest income 3,771 2,616 1,090 1,171 703 9,351 (224) 9,127 Net fee income 253 185 335 86 (17) 842 - 842 Net wealth management income - 189 - 19 10 218 - 218 Trading income - 30 313 20 2 365 (2) 363 Other income 2 5 18 (3) 18 40 - 40 Notable Items - - - (6) (220) (226) 226 - Net operating income 4,026 3,025 1,756 1,287 496 10,590 - 10,590 Operating expensesa (2,365) (1,256) (709) (646) (419) (5,395) - (5,395) Total operating expenses (2,365) (1,256) (709) (646) (419) (5,395) - (5,395) Pre-provision profit 1,661 1,769 1,047 641 77 5,195 - 5,195 Impairment (charges)/benefits (144) (95) (101) (22) - (362) - (362) Profit before income tax expense 1,517 1,674 946 619 77 4,833 - 4,833 Income tax (expense)/benefitb (459) (499) (265) (174) (94) (1,491) - (1,491) Net profit attributable to NCI - - - - - - - - Net profit attributable to owners of WBC 1,058 1,175 681 445 (17) 3,342 - 3,342 Notable Items (post-tax) - - - (4) (160) (164) Balance sheet Loans 502,354 96,923 92,983 92,586 (7) 784,839 Deposits and other borrowings 321,255 140,634 115,296 74,792 50,249 702,226 a. Impairment of assets (including goodwill and other intangible assets) were insignificant for all segments except for $50 million in Consumer. b. Includes tax benefit on Notable Items of $62 million. Half Year Half Year Half Year % Mov't March Sept March Mar 25 Mar 25 $m 2025 2024 2024 - Sept 24 - Mar 24 Notable Items after tax Economic hedges (92) 35 (163) large (44) Hedge ineffectiveness (48) 6 (1) large large Total Notable Items after tax (140) 41 (164) large (15) |
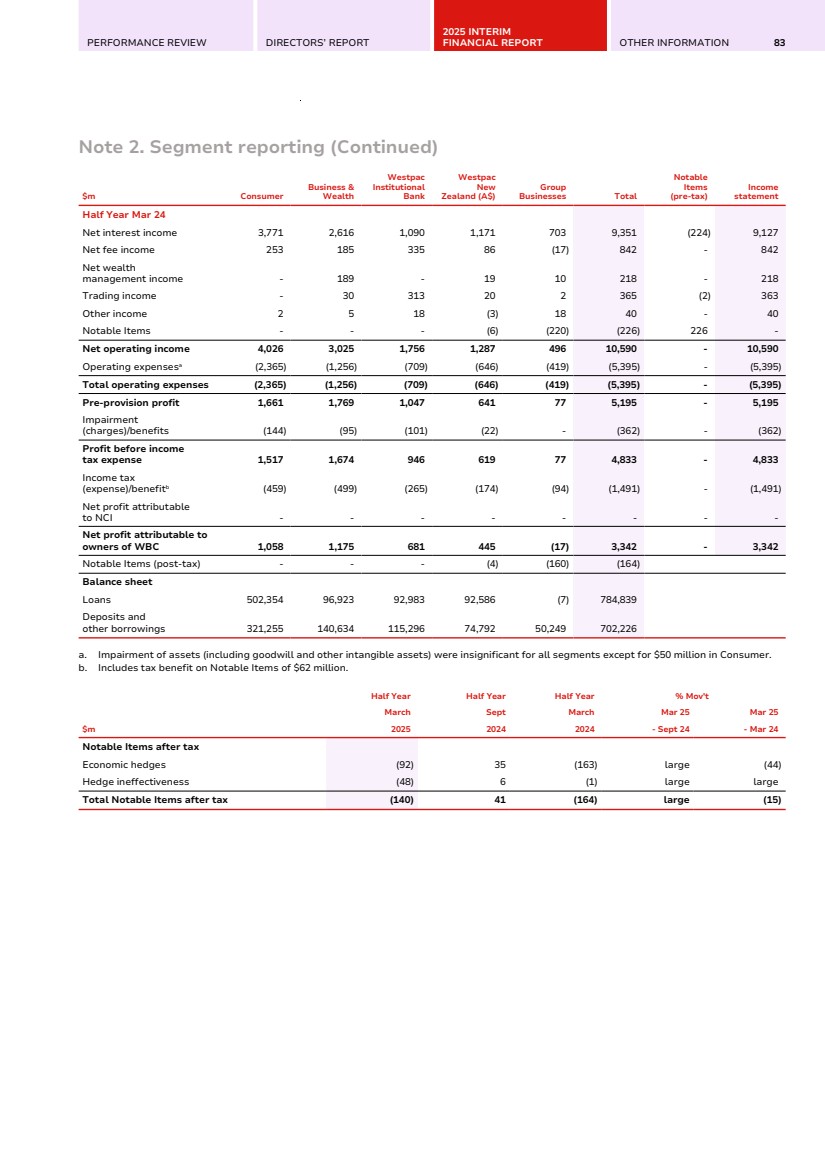
| 84 WESTPAC GROUP 2025 INTERIM FINANCIAL RESULTS NOTES TO THE CONSOLIDATED FINANCIAL STATEMENTS Note 3. Net interest income and average balance sheet and interest rates Net interest income Half Year Half Year Half Year % Mov't March Sept March Mar 25 Mar 25 $m 2025 2024 2024 - Sept 24 - Mar 24 Interest income Calculated using the effective interest method Cash and balances with central banks 1,433 1,830 2,293 (22) (38) Collateral paid 266 285 362 (7) (27) Investment securities 2,246 1,899 1,595 18 41 Loans 23,153 22,862 21,598 1 7 Other financial assets 9 5 10 80 (10) Total interest income calculated using the effective interest method 27,107 26,881 25,858 1 5 Other Net ineffectiveness on qualifying hedges (69) 9 (1) large large Trading securities and financial assets measured at FVIS 1,046 913 687 15 52 Total other 977 922 686 6 42 Total interest income 28,084 27,803 26,544 1 6 Interest expense Calculated using the effective interest method Collateral received (152) (141) (176) 8 (14) Deposits and other borrowings (11,016) (10,983) (10,285) - 7 Debt issues (3,367) (3,105) (2,989) 8 13 Loan capital (1,026) (943) (905) 9 13 Other financial liabilities (190) (125) (269) 52 (29) Total interest expense calculated using the effective interest method (15,751) (15,297) (14,624) 3 8 Other Deposits and other borrowings (1,088) (1,170) (1,219) (7) (11) Trading liabilitiesa (1,536) (1,366) (1,277) 12 20 Debt issues (124) (111) (83) 12 49 Bank levy (191) (185) (172) 3 11 Other interest expense (43) (48) (42) (10) 2 Total other (2,982) (2,880) (2,793) 4 7 Total interest expense (18,733) (18,177) (17,417) 3 8 Net interest incomeb 9,351 9,626 9,127 (3) 2 a. Includes net impact of Treasury balance sheet management activities. b. Included items relating to remediation costs recognised as a $7 million reduction to net interest income (Second Half 2024: $45 million addition, First Half 2024: $2 million addition). Refer to Note 13 (pages 101-105) for further details. |
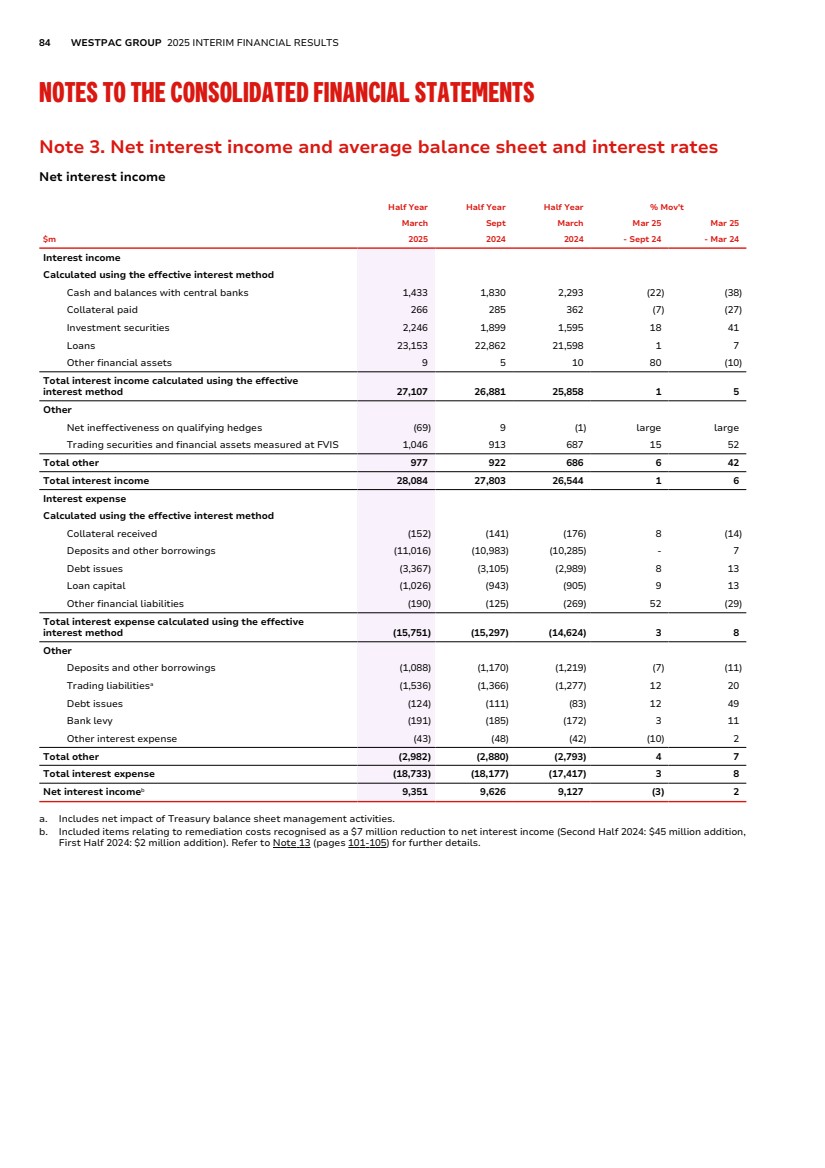
| PERFORMANCE REVIEW DIRECTORS’ REPORT 2025 INTERIM FINANCIAL REPORT OTHER INFORMATION 85 Note 3. Net interest income and average balance sheet and interest rates (Continued) Average balance sheet and interest rates Half Year March 2025 Half Year Sept 2024 Half Year March 2024 Average balance Interest income Average rate Average balance Interest income Average rate Average balance Interest income Average rate $m $m % $m $m % $m $m % Assets Interest earning assets Loans Australia 653,746 19,898 6.1 640,394 19,484 6.1 627,150 18,381 5.9 New Zealand 92,103 2,964 6.5 92,086 3,139 6.8 92,358 3,016 6.5 Other overseas 9,681 291 6.0 7,248 239 6.6 6,084 201 6.6 Housinga Australia 444,432 13,023 5.9 443,112 12,886 5.8 435,130 12,096 5.6 New Zealand 60,938 1,850 6.1 60,704 1,846 6.1 60,916 1,715 5.6 Other overseas 378 8 4.2 389 9 4.6 425 8 3.8 Personal Australia 9,834 497 10.1 10,375 514 9.9 10,993 525 9.6 New Zealand 1,059 49 9.3 1,042 48 9.2 1,084 49 9.0 Other overseas 7 - - 6 1 33.3 8 - - Business Australia 199,480 6,378 6.4 186,907 6,084 6.5 181,027 5,760 6.4 New Zealand 30,106 1,065 7.1 30,340 1,245 8.2 30,358 1,252 8.2 Other overseas 9,296 283 6.1 6,853 229 6.7 5,651 193 6.8 Trading securities and financial assets measured at FVIS Australia 37,813 830 4.4 33,267 712 4.3 23,943 511 4.3 New Zealand 5,177 113 4.4 4,888 127 5.2 4,548 124 5.5 Other overseas 4,880 103 4.2 3,455 74 4.3 2,599 52 4.0 Investment securities Australia 101,793 2,085 4.1 90,391 1,760 3.9 80,025 1,467 3.7 New Zealand 7,147 127 3.6 6,521 109 3.3 6,619 92 2.8 Other overseas 1,797 34 3.8 1,997 30 3.0 2,297 36 3.1 Other interest earning assetsb Australia 59,427 1,144 3.9 69,379 1,458 4.2 89,073 1,882 4.2 New Zealand 7,831 167 4.3 8,101 219 5.4 9,171 246 5.4 Other overseas 15,306 328 4.3 17,675 452 5.1 20,841 536 5.1 Total interest earning assets and interest income 996,701 28,084 5.7 975,402 27,803 5.7 964,708 26,544 5.5 Non-interest earning assets Derivative financial instruments 27,698 16,625 16,947 All other assetsc 79,904 73,653 67,282 Total non-interest earning assets 107,602 90,278 84,229 Total assets 1,104,303 1,065,680 1,048,937 a. Certain portions of loans are non-interest bearing and are presented below in All other assets. The non-interest bearing portion represents the impact of mortgage offset deposits which are taken into consideration when calculating interest charged on loans. b. Interest income includes net ineffectiveness on qualifying hedges. c. Includes property and equipment, intangible assets, deferred tax assets, non-interest earning loans relating to mortgage offset accounts and all other non-interest earning assets. Mortgage offset balances were $63,511 million in First Half 2025 (Second Half 2024: $58,733 million, First Half 2024: $55,324 million). |
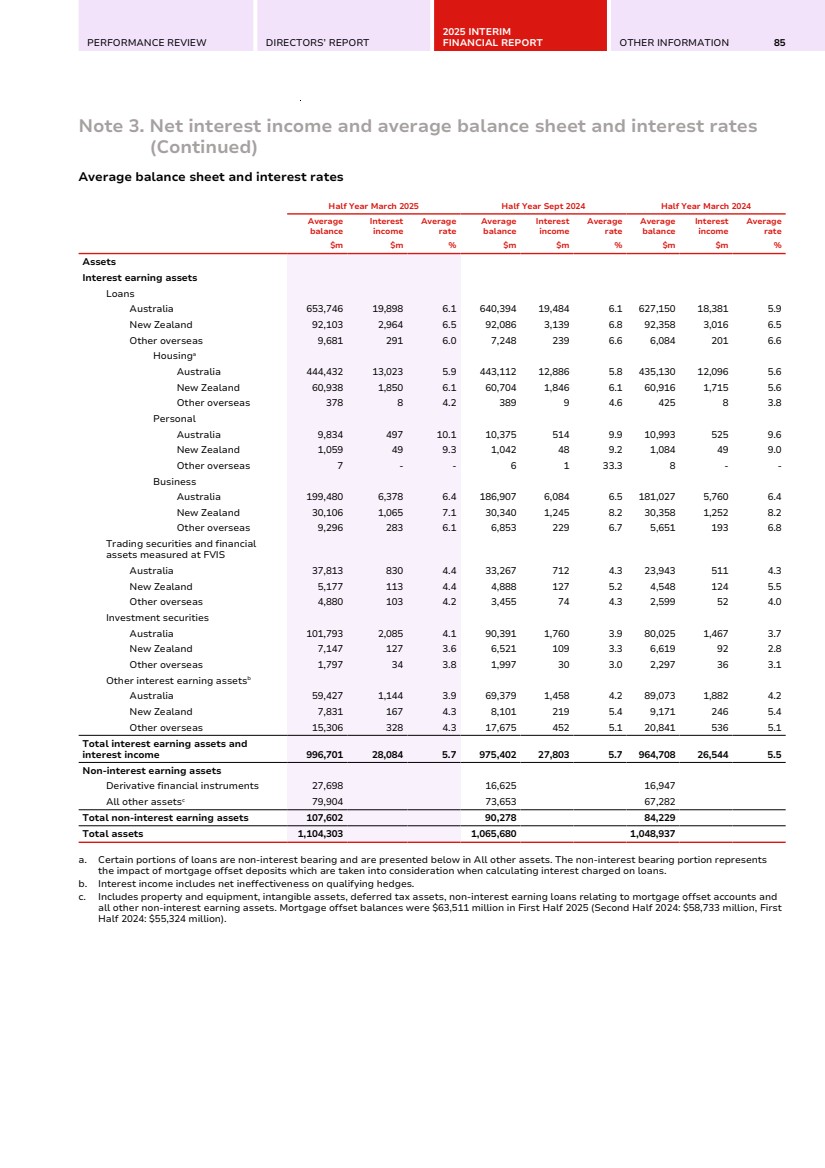
| 86 WESTPAC GROUP 2025 INTERIM FINANCIAL RESULTS NOTES TO THE CONSOLIDATED FINANCIAL STATEMENTS Note 3. Net interest income and average balance sheet and interest rates (Continued) Half Year March 2025 Half Year Sept 2024 Half Year March 2024 Average balance Interest expense Average rate Average balance Interest expense Average rate Average balance Interest expense Average rate $m $m % $m $m % $m $m % Liabilities Interest bearing liabilities Deposits and other borrowings Australia 505,994 10,259 4.1 493,900 10,069 4.1 479,763 9,344 3.9 New Zealand 64,845 1,377 4.3 64,508 1,606 5.0 65,632 1,614 4.9 Other overseas 20,312 468 4.6 18,299 478 5.2 20,413 546 5.3 Certificates of deposit Australia 30,915 708 4.6 33,317 757 4.5 33,879 752 4.4 New Zealand 1,794 42 4.7 2,236 64 5.7 2,612 77 5.9 Other overseas 13,416 336 5.0 12,294 348 5.7 13,440 388 5.8 Transactions Australia 118,434 2,094 3.5 118,828 2,181 3.7 119,919 1,931 3.2 New Zealand 9,100 140 3.1 8,901 204 4.6 8,771 200 4.6 Other overseas 893 7 1.6 826 7 1.7 820 6 1.5 Savings Australia 204,173 3,871 3.8 194,017 3,665 3.8 184,793 3,342 3.6 New Zealand 18,007 234 2.6 18,200 310 3.4 18,730 325 3.5 Other overseas 1,089 12 2.2 999 13 2.6 993 12 2.4 Term Australia 152,472 3,586 4.7 147,738 3,466 4.7 141,172 3,319 4.7 New Zealand 35,944 961 5.4 35,171 1,028 5.8 35,519 1,012 5.7 Other overseas 4,914 113 4.6 4,180 110 5.3 5,160 140 5.4 Repurchase agreements Australia 15,987 406 5.1 19,604 397 4.1 24,476 295 2.4 New Zealand 2,887 61 4.2 3,730 100 5.4 4,906 134 5.5 Other overseas 1,224 27 4.4 29 1 6.9 357 10 5.6 Loan capital Australia 39,746 940 4.7 38,323 857 4.5 36,135 819 4.5 New Zealand 3,026 86 5.7 2,961 86 5.8 3,005 86 5.7 Other overseas - - - - - - - - - Other interest bearing liabilitiesa Australia 174,487 4,545 5.2 167,090 4,148 5.0 162,354 4,222 5.2 New Zealand 22,050 564 5.1 20,761 436 4.2 19,507 332 3.4 Other overseas 479 - - 681 (1) (0.3) 1,225 15 2.4 Total interest bearing liabilities and interest expense 851,037 18,733 4.4 829,886 18,177 4.4 817,773 17,417 4.3 Non-interest bearing liabilities Deposits and other borrowings Australia 131,884 124,168 120,371 New Zealand 10,545 10,540 11,242 Other overseas 1,206 1,341 1,325 Derivative financial instruments 28,812 20,618 22,208 All other liabilities 9,891 7,913 4,134 Total non-interest bearing liabilities 182,338 164,580 159,280 Total liabilities 1,033,375 994,466 977,053 Shareholders' equity 70,584 71,145 71,841 NCI 344 69 43 Total equity 70,928 71,214 71,884 Total liabilities and equity 1,104,303 1,065,680 1,048,937 a. Interest expense includes the net impact of Treasury balance sheet management activities and the bank levy. |
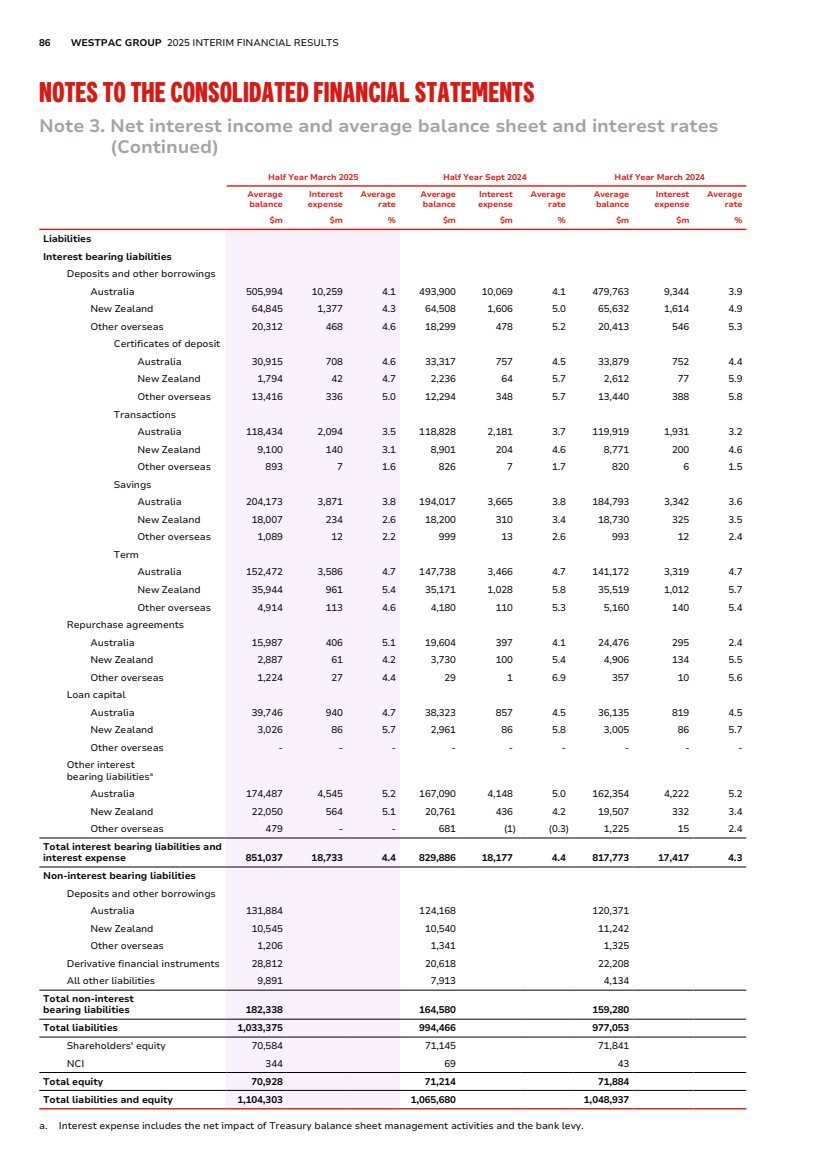
| PERFORMANCE REVIEW DIRECTORS’ REPORT 2025 INTERIM FINANCIAL REPORT OTHER INFORMATION 87 Note 4. Non-interest income Half Year Half Year Half Year % Mov't March Sept March Mar 25 Mar 25 $m 2025 2024 2024 - Sept 24 - Mar 24 Net fees Facility fees 394 387 376 2 5 Transaction fees 536 556 562 (4) (5) Other non-risk fee income 81 58 77 40 5 Fee income 1,011 1,001 1,015 1 - Credit card loyalty programs (69) (62) (72) 11 (4) Transaction fee related expenses (102) (109) (101) (6) 1 Fee expenses (171) (171) (173) - (1) Net fees 840 830 842 1 - Net wealth management 239 223 218 7 10 Trading 298 341 363 (13) (18) Other Dividends received from other entities 1 2 1 (50) - Net gain/(loss) on disposal of assets (1) 9 (3) large (67) Net gain/(loss) on hedging of overseas operations (1) (1) - - - Net gain/(loss) on derivatives held for risk management purposesa 2 2 5 - (60) Net gain/(loss) on financial instruments measured at fair value 44 (42) 18 large 144 Other 20 8 19 150 5 Total other 65 (22) 40 large 63 Total non-interest incomeb 1,442 1,372 1,463 5 (1) a. Income from derivatives held for risk management purposes reflects the impact of economic hedges of earnings. b. Includes items relating to remediation costs recognised as a $14 million reduction to non-interest income (Second Half 2024: $39 million reduction, First Half 2024: $5 million reduction). Refer to Note 13 (pages 101-105) for further details. |
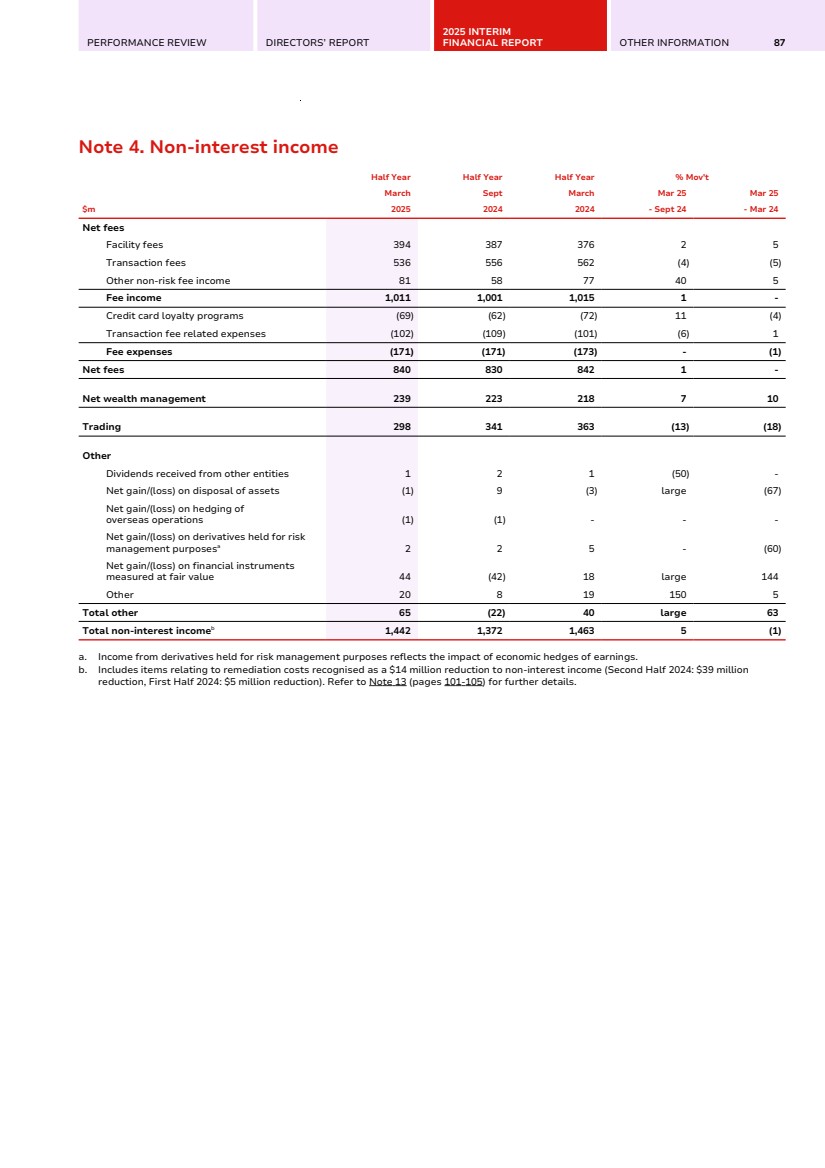
| 88 WESTPAC GROUP 2025 INTERIM FINANCIAL RESULTS NOTES TO THE CONSOLIDATED FINANCIAL STATEMENTS Note 5. Operating expenses Half Year Half Year Half Year % Mov't March Sept March Mar 25 Mar 25 $m 2025 2024 2024 - Sept 24 - Mar 24 Staff Employee remuneration, entitlements and on-costs 2,716 2,593 2,567 5 6 Superannuation 304 269 282 13 8 Share-based payments 54 52 45 4 20 Restructuring costs 41 54 37 (24) 11 Total staff 3,115 2,968 2,931 5 6 Occupancy Operating lease rentals 61 51 65 20 (6) Depreciation and impairment of property and equipment 210 232 223 (9) (6) Other 47 65 64 (28) (27) Total occupancy 318 348 352 (9) (10) Technology Amortisation and impairment of software assets 485 447 461 9 5 Depreciation and impairment of IT equipment 56 55 70 2 (20) Technology services 484 472 399 3 21 Software maintenance and licences 415 420 350 (1) 19 Telecommunications 40 47 43 (15) (7) Total technology 1,480 1,441 1,323 3 12 Other Professional and processing services 338 389 409 (13) (17) Postage and stationery 70 69 61 1 15 Advertising 91 91 85 - 7 Non-lending losses 123 69 42 78 193 Amortisation and impairment of other intangible assets and deferred expenditure 1 1 33 - (97) Other expenses 162 173 159 (6) 2 Total other 785 792 789 (1) (1) Total operating expensesa 5,698 5,549 5,395 3 6 a. Included items relating to remediation costs recognised as a $1 million addition to operating expenses (Second Half 2024: $9 million reduction, First Half 2024: $10 million addition). Refer to Note 13 (pages 101-105) for further details. |
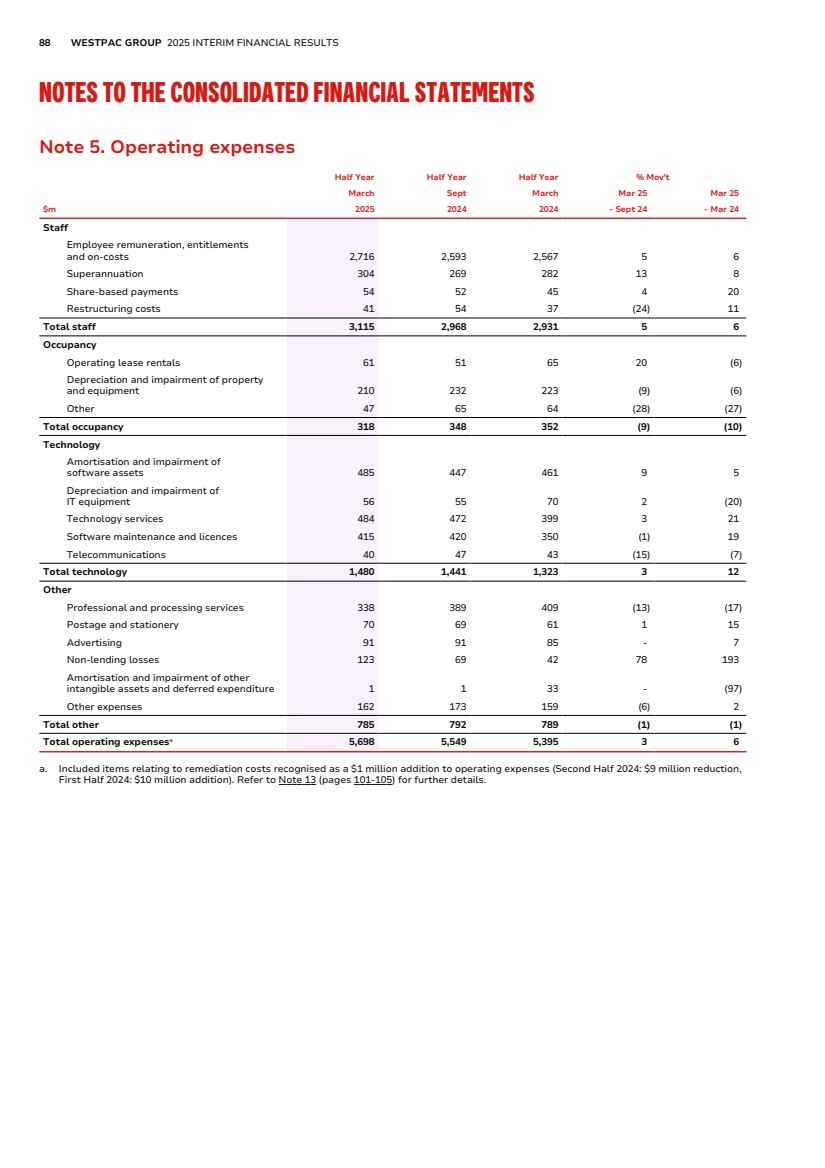
| PERFORMANCE REVIEW DIRECTORS’ REPORT 2025 INTERIM FINANCIAL REPORT OTHER INFORMATION 89 Note 6. Income tax The following table reconciles income tax expense to the profit before income tax: Half Year Half Year Half Year % Mov't March Sept March Mar 25 Mar 25 $m 2025 2024 2024 - Sept 24 - Mar 24 Profit before income tax 4,845 5,274 4,833 (8) - Tax at the Australian company tax rate of 30% 1,454 1,582 1,450 (8) - The effect of amounts which are not deductible/ (assessable) in calculating taxable income: Hybrid capital distributions 67 71 68 (6) (1) Other non-assessable items - (1) (3) (100) (100) Other non-deductible items 16 15 10 7 60 Adjustment for overseas tax rates (12) (11) (16) 9 (25) Income tax (over)/under provided in prior periods 13 (19) (1) large large Other items (18) (11) (17) 64 6 Total income tax expensea 1,520 1,626 1,491 (7) 2 Effective income tax rate 31.37% 30.83% 30.85% 54 bps 52 bps a. As the bank levy is not a levy on income, it is not included in income tax. It is included in interest expense in Note 3 (pages 84-86). International Tax Reform – Pillar Two Model Rules Pillar Two introduces new ‘top-up’ taxes for multinational enterprises (MNEs) within the scope of the rules to ensure that these MNEs pay a minimum effective rate of tax of 15% on profits in all jurisdictions. Pillar Two legislation has been enacted or substantively enacted in certain jurisdictions in which Westpac operates and became effective for the Group for the financial year beginning 1 October 2024. The Group does not have Pillar Two top-up tax obligations as at 31 March 2025 and has applied the mandatory temporary exception from recognising and disclosing Pillar Two deferred taxes under AASB 112. Note 7. Earnings per share Basic earnings per share (EPS) is calculated by dividing the net profit attributable to owners of WBC by the weighted average number of ordinary shares on issue during the period. These numbers are adjusted for treasury shares and dividends related to treasury shares. Diluted EPS is calculated by adjusting the basic EPS by assuming all dilutive potential ordinary shares are converted. Half Year March 2025 Half Year Sept 2024 Half Year March 2024 Basic Diluted Basic Diluted Basic Diluted Net profit attributable to owners of WBC ($m) 3,317 3,317 3,648 3,648 3,342 3,342 Adjustment for restricted share dividendsa (3) - (5) - (2) - Adjustment for potential dilution: Distributions to convertible loan capital holdersb - 229 - 241 - 235 Adjusted net profit attributable to owners of WBC 3,314 3,546 3,643 3,889 3,340 3,577 Weighted average number of ordinary shares (# m) Weighted average number of ordinary shares on issue 3,433 3,433 3,462 3,462 3,499 3,499 Treasury shares (including RSP and EIP restricted shares)a (5) (5) (5) (5) (5) (5) Adjustment for potential dilution: Share-based payments - 5 - 2 - 3 Convertible loan capitalb - 262 - 335 - 408 Adjusted weighted average number of ordinary shares 3,428 3,695 3,457 3,794 3,494 3,905 Earnings per ordinary share (cents) 96.7 96.0 105.4 102.5 95.6 91.6 a. Some shares under the RSP and EIP restricted shares have not vested and are not outstanding ordinary shares but do receive dividends. These RSP and EIP dividends are deducted to show the profit attributable to ordinary shareholders. b. The Group has issued convertible loan capital which may convert into ordinary shares in the future. These convertible loan capital instruments are potentially dilutive instruments, and diluted EPS is therefore calculated as if the instruments had been converted at the beginning of the respective period or, if later, the instruments’ issue date. |
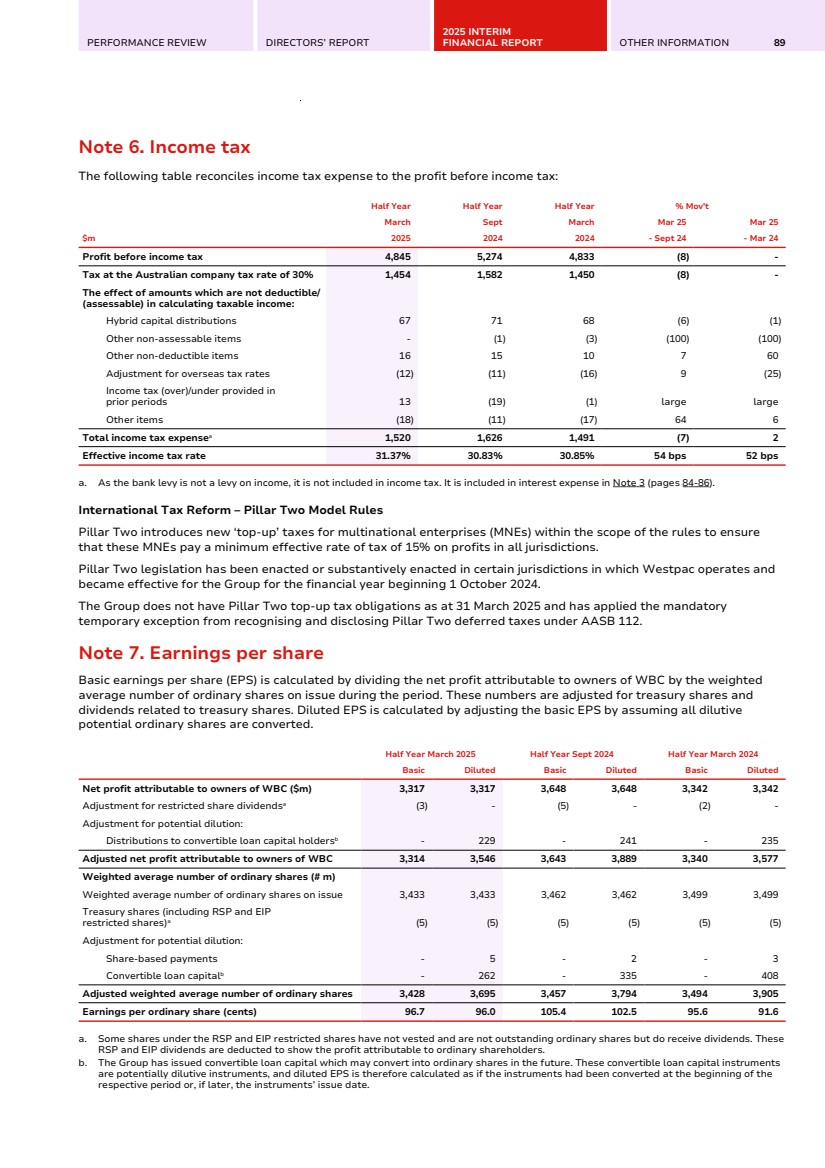
| 90 WESTPAC GROUP 2025 INTERIM FINANCIAL RESULTS NOTES TO THE CONSOLIDATED FINANCIAL STATEMENTS Note 8. Loans As at As at As at % Mov't 31 March 30 Sept 31 March Mar 25 Mar 25 $m 2025 2024 2024 - Sept 24 - Mar 24 Australia Housing 510,182 503,271 495,058 1 3 Personal 9,365 10,174 10,863 (8) (14) Business 204,642 195,483 183,883 5 11 Total Australia 724,189 708,928 689,804 2 5 New Zealand Housing 63,191 62,484 61,859 1 2 Personal 1,068 1,058 1,081 1 (1) Business 30,413 31,055 30,428 (2) - Total New Zealand 94,672 94,597 93,368 - 1 Total other overseas 10,525 7,810 6,249 35 68 Gross loans 829,386 811,335 789,421 2 5 Provision for ECL on loans (Note 9) (4,578) (4,568) (4,582) - - Total loansa,b 824,808 806,767 784,839 2 5 a. Total loans included Australian securitised residential loans of $6,066 million as at 31 March 2025 (30 September 2024: $5,185 million, 31 March 2024: $5,821 million). The level of securitised loans excludes loans where Westpac is the holder of related debt securities. b. Total loans included assets pledged for the covered bond programs of $41,845 million as at 31 March 2025 (30 September 2024: $42,228 million, 31 March 2024: $43,779 million). Note 9. Provision for expected credit losses Loans and credit commitments The following table shows the provision for ECL on loans and credit commitments by stage: As at As at As at % Mov't 31 March 30 Sept 31 March Mar 25 Mar 25 $m 2025 2024 2024 - Sept 24 - Mar 24 Performing - Stage 1 873 761 712 15 23 Performing - Stage 2 2,410 2,594 2,713 (7) (11) Non-performing - Stage 3 1,779 1,729 1,696 3 5 Total provision for ECL on loans and credit commitments 5,062 5,084 5,121 - (1) Presented as: Provision for ECL on loans (Note 8) 4,578 4,568 4,582 - - Provision for ECL on credit commitments (Note 13) 484 516 539 (6) (10) Total provision for ECL on loans and credit commitments 5,062 5,084 5,121 - (1) Of which: Individually assessed provisions 611 536 461 14 33 Collectively assessed provisions 4,451 4,548 4,660 (2) (4) Total provision for ECL on loans and credit commitments 5,062 5,084 5,121 - (1) Gross loans and credit commitments 1,047,142 1,023,446 999,705 2 5 Coverage ratio on loans (%) 0.55 0.56 0.58 (1 bps) (3 bps) Coverage ratio on loans and credit commitments (%) 0.48 0.50 0.51 (2 bps) (3 bps) Movement in provision for ECL on loans and credit commitments The reconciliation of the provision for ECL tables for loans and credit commitments has been determined by an aggregation of monthly movements over the period. The key line items in the reconciliation represent the following: • "Transfers between stages” represents transfers between Stage 1, Stage 2 and Stage 3 prior to remeasurement of the provision for ECL; |

| PERFORMANCE REVIEW DIRECTORS’ REPORT 2025 INTERIM FINANCIAL REPORT OTHER INFORMATION 91 Note 9. Provision for expected credit losses (Continued) • “Business activity during the period” represents new accounts originated during the period net of those that were de-recognised due to final repayments during the period; • “Net remeasurement of provision for ECL” represents the impact on the provision for ECL due to changes in credit quality during the period (including transfers between stages), changes in portfolio overlays, changes due to forward-looking economic scenarios and partial repayments and additional draw-downs on existing facilities over the period; and • “Write-offs” represents a reduction in the provision for ECL as a result of de-recognition of exposures where there is no reasonable expectation of full recovery. Performing Non-performing $m Stage 1 Stage 2 Stage 3 Total Balance as at 30 September 2023 706 2,808 1,416 4,930 Transfers to Stage 1a 568 (530) (38) - Transfers to Stage 2a (172) 393 (221) - Transfers to Stage 3a (2) (312) 314 - Business activity during the perioda 140 (140) (79) (79) Net remeasurement of provision for ECLa (526) 498 557 529 Write-offs - - (277) (277) Exchange rate and other adjustments (2) (4) 24 18 Balance as at 31 March 2024 712 2,713 1,696 5,121 Transfers to Stage 1 654 (635) (19) - Transfers to Stage 2 (143) 429 (286) - Transfers to Stage 3 (1) (296) 297 - Business activity during the period 163 (188) (214) (239) Net remeasurement of provision for ECL (623) 572 566 515 Write-offs - - (343) (343) Exchange rate and other adjustments (1) (1) 32 30 Balance as at 30 September 2024 761 2,594 1,729 5,084 Transfers to Stage 1 684 (641) (43) - Transfers to Stage 2 (97) 419 (322) - Transfers to Stage 3 (2) (310) 312 - Business activity during the period 152 (181) (133) (162) Net remeasurement of provision for ECL (627) 566 590 529 Write-offs - - (364) (364) Exchange rate and other adjustments 2 (37) 10 (25) Balance as at 31 March 2025 873 2,410 1,779 5,062 a. The attribution of amounts disclosed in the movement schedule were revised in Second Half 2024 to better reflect the nature of the changes in the provision for ECL. Comparatives have been revised to align with current period presentation. The following table provides further details of the provision for ECL on loans and credit commitments by class and stage: Performing Non-performing $m Stage 1 Stage 2 Stage 3 Total Housing 163 926 633 1,722 Personal 83 252 105 440 Business 466 1,535 958 2,959 Balance as at 31 March 2024 712 2,713 1,696 5,121 Housing 169 897 639 1,705 Personal 77 234 99 410 Business 515 1,463 991 2,969 Balance as at 30 September 2024 761 2,594 1,729 5,084 Housing 199 886 631 1,716 Personal 81 236 91 408 Business 593 1,288 1,057 2,938 Balance as at 31 March 2025 873 2,410 1,779 5,062 |
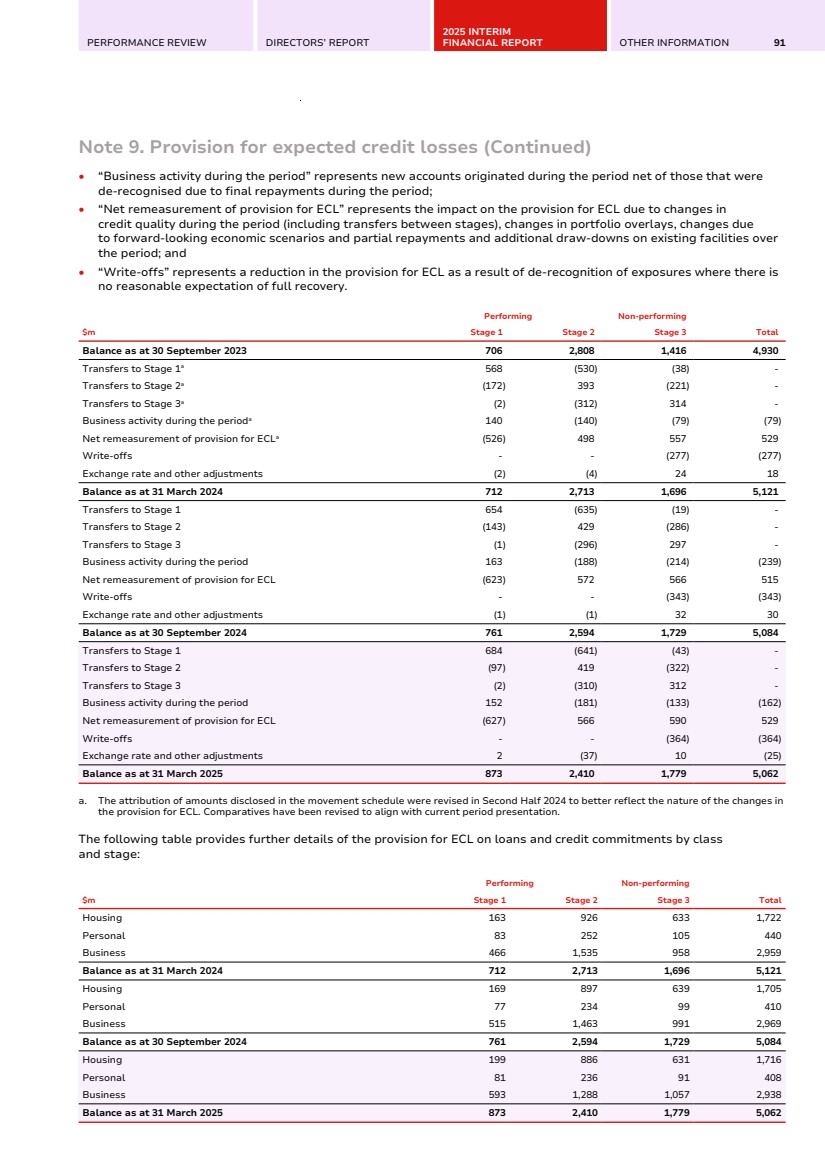
| 92 WESTPAC GROUP 2025 INTERIM FINANCIAL RESULTS NOTES TO THE CONSOLIDATED FINANCIAL STATEMENTS Note 9. Provision for expected credit losses (Continued) Impact of overlays on the provision for ECL on loans and credit commitments The following table attributes the provision for ECL on loans and credit commitments between modelled ECL and portfolio overlays. Portfolio overlays are used to capture areas of potential risk and uncertainty in the portfolio, that are not captured in the underlying modelled ECL. As at As at As at 31 March 30 Sept 31 March $m 2025 2024 2024 Individually assessed provisions 611 536 461 Modelled provision for ECL on loans and credit commitments 4,321 4,369 4,400 Overlays 130 179 260 Total provision for ECL on loans and credit commitments 5,062 5,084 5,121 Details of changes related to forward-looking economic inputs and portfolio overlays are provided below. Modelled provision for ECL on loans and credit commitments The modelled provision for ECL on loans and credit commitments is a probability weighted estimate based on three scenarios which together represent the Group’s view of the forward-looking distribution of potential loss outcomes. Changes in the modelled provision for ECL are reflected through the “net remeasurement of provision for ECL” line item. Overlays are used to capture potential risk and uncertainty in the portfolio that are not captured in the underlying modelled ECL. The base case scenario uses the following Westpac Economics forecasts: Key economic assumptions for base case scenario 31 March 2025 30 September 2024 31 March 2024 Annual GDP: Australia Forecast growth of 2.2% for calendar year 2025 and 2.2% for calendar year 2026 Forecast growth of 1.5% for calendar year 2024 and 2.4% for calendar year 2025 Forecast growth of 1.6% for calendar year 2024 and 2.5% for calendar year 2025 New Zealand Forecast growth of 2.5% for calendar year 2025 and 3.0% for calendar year 2026 Forecast growth of 0.1% for calendar year 2024 and 2.0% for calendar year 2025 Forecast growth of 0.8% for calendar year 2024 and 2.4% for calendar year 2025 Commercial property index, Australia Forecast price increase of 2.0% for calendar year 2025 and 3.3% for calendar year 2026 Forecast price contraction of 11.5% for calendar year 2024 and 1.3% for calendar year 2025 Forecast price contraction of 8.0% for calendar year 2024 and growth of 1.4% for calendar year 2025 Residential property prices: Australia Forecast price growth of 3.0% for calendar year 2025 and 7.0% for calendar year 2026 Forecast price growth of 5.7% for calendar year 2024 and 4.0% for calendar year 2025 Forecast price growth of 6.0% for calendar year 2024 and 4.0% for calendar year 2025 New Zealand Forecast price growth of 7.2% for calendar year 2025 and 5.1% for calendar year 2026 Forecast price growth of 0.7% for calendar year 2024 and 6.4% for calendar year 2025 Forecast price growth of 5.9% for calendar year 2024 and 6.7% for calendar year 2025 Cash rate, Australia Forecast cash rate of 3.35% at December 2025 and 3.35% at December 2026 Forecast cash rate of 4.35% at December 2024 and 3.35% at December 2025 Forecast cash rate of 3.85% at December 2024 and 3.10% at December 2025 Unemployment rate: Australia Forecast rate of 4.5% at December 2025 and 4.5% at December 2026 Forecast rate of 4.3% at December 2024 and 4.6% at December 2025 Forecast rate of 4.5% at December 2024 and 4.6% at December 2025 New Zealand Forecast rate of 5.3% at December 2025 and 4.6% at December 2026 Forecast rate of 5.3% at December 2024 and 5.6% at December 2025 Forecast rate of 5.1% at December 2024 and 5.2% at December 2025 The downside scenario is a more severe scenario with expected credit losses higher than the base case. This scenario assumes a recession with a combination of negative GDP growth, declines in commercial and residential property prices and an increase in the unemployment rate, which simultaneously impact expected credit losses across all portfolios from the reporting date. The assumptions used in this scenario and relativities to the base case will be monitored having regard to the emerging economic conditions and updated where necessary. The upside scenario represents a modest improvement to the base case. The following sensitivity table shows the reported provision for ECL on loans and credit commitments based on the probability weighted scenarios and what the provision for ECL on loans and credit commitments would be assuming a 100% weighting to the base case scenario and to the downside scenario (with all other assumptions held constant). |
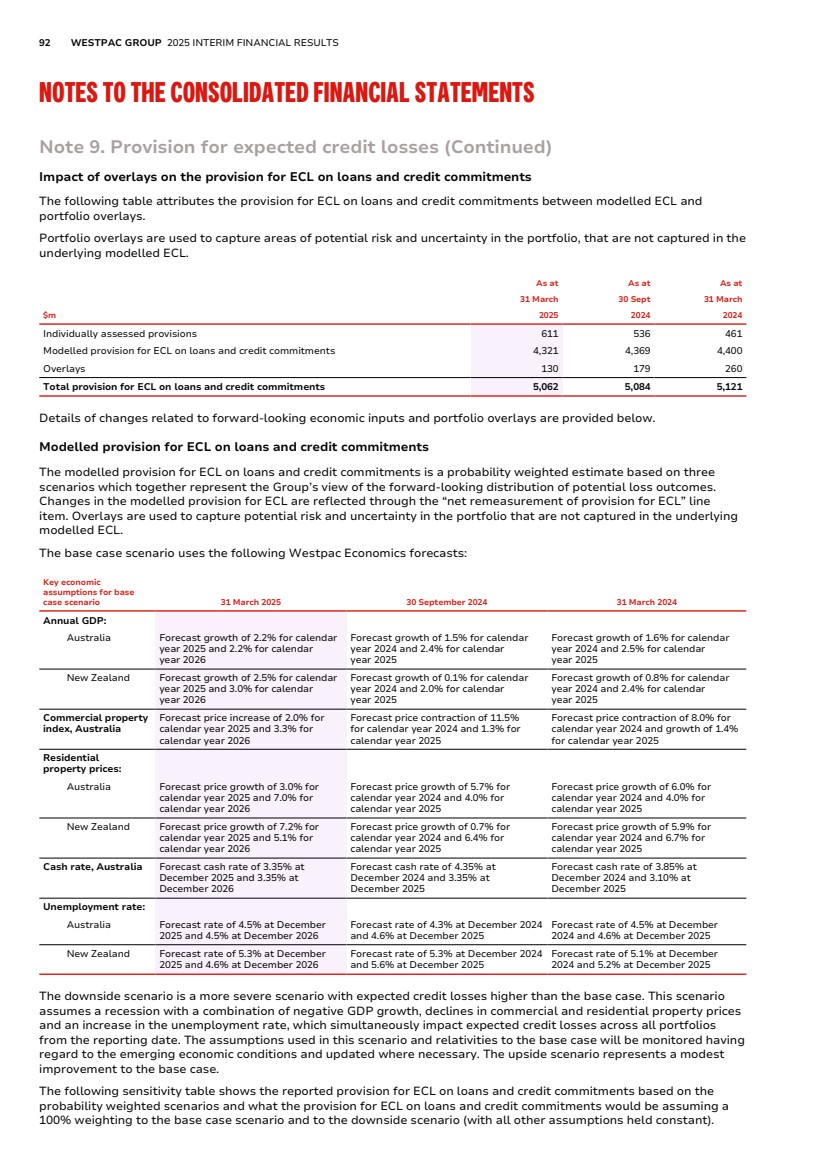
| PERFORMANCE REVIEW DIRECTORS’ REPORT 2025 INTERIM FINANCIAL REPORT OTHER INFORMATION 93 Note 9. Provision for expected credit losses (Continued) As at As at As at 31 March 30 Sept 31 March $m 2025 2024 2024 Reported probability-weighted ECL 5,062 5,084 5,121 100% base case ECL 3,315 3,559 3,737 100% downside ECL 7,235 7,195 7,047 If 1% of Stage 1 loans and credit commitments (calculated on a 12 month ECL) were transferred to Stage 2 (calculated on a lifetime ECL), the provision for ECL on loans and credit commitments would increase by $102 million (30 September 2024: $93 million, 31 March 2024: $89 million) for the Group. This estimate applies the average modelled provision coverage ratio by stage to the transfer of loans and credit commitments. The following table discloses the economic weights applied by the Group. In March 2025, the downside scenario weight was increased by 2.5% and base case weight decreased by the same value, reflecting greater uncertainty in international trading relations and geopolitical instability: As at As at As at 31 March 30 Sept 31 March Scenario weightings (%) 2025 2024 2024 Upside 5.0 5.0 5.0 Base 50.0 52.5 52.5 Downside 45.0 42.5 42.5 The Group’s definition of default is aligned to the regulatory definition of default applied in the calculation of credit risk weighted assets. Portfolio overlays Portfolio overlays are used to address areas of risk, including significant uncertainties that are not captured in the underlying modelled ECL. Determination of portfolio overlays requires expert judgement and is thoroughly documented and subject to comprehensive internal governance and oversight. Overlays are continually reassessed and if the risk is judged to have changed (increased or decreased), or is subsequently captured in the modelled ECL, the overlay will be released or remeasured. Westpac’s total portfolio overlays as at 31 March 2025 were $130 million (30 September 2024: $179 million; 31 March 2024: $260 million) and comprise: • $70 million for the expected impact of extreme weather events on customers (30 September 2024: $70 million; 31 March 2024: $70 million); • $41 million for non-retail credit exposures (30 September 2024: $32 million; 31 March 2024: $31 million). Current period overlays primarily relate to geographical areas experiencing higher stress not included in modelled outcomes; and • $19 million for retail credit exposures (30 September 2024: $77 million; 31 March 2024: $159 million). Current period overlays relate to geographical areas experiencing higher stress and other risks not included in modelled outcomes. Changes in portfolio overlays are reflected through the “net remeasurement of provision for ECL” line item. Total provision for ECL As at As at As at 31 March 30 Sept 31 March $m 2025 2024 2024 Provision for ECL on loans and credit commitments 5,062 5,084 5,121 Provision for ECL on debt securities at amortised costa 4 6 8 Provision for ECL on debt securities at FVOCIb 6 6 6 Total provision for ECL 5,072 5,096 5,135 a. Provision for ECL on debt securities at amortised cost is presented as part of investment securities. b. Provision for ECL on debt securities at FVOCI forms part of equity reserves. |
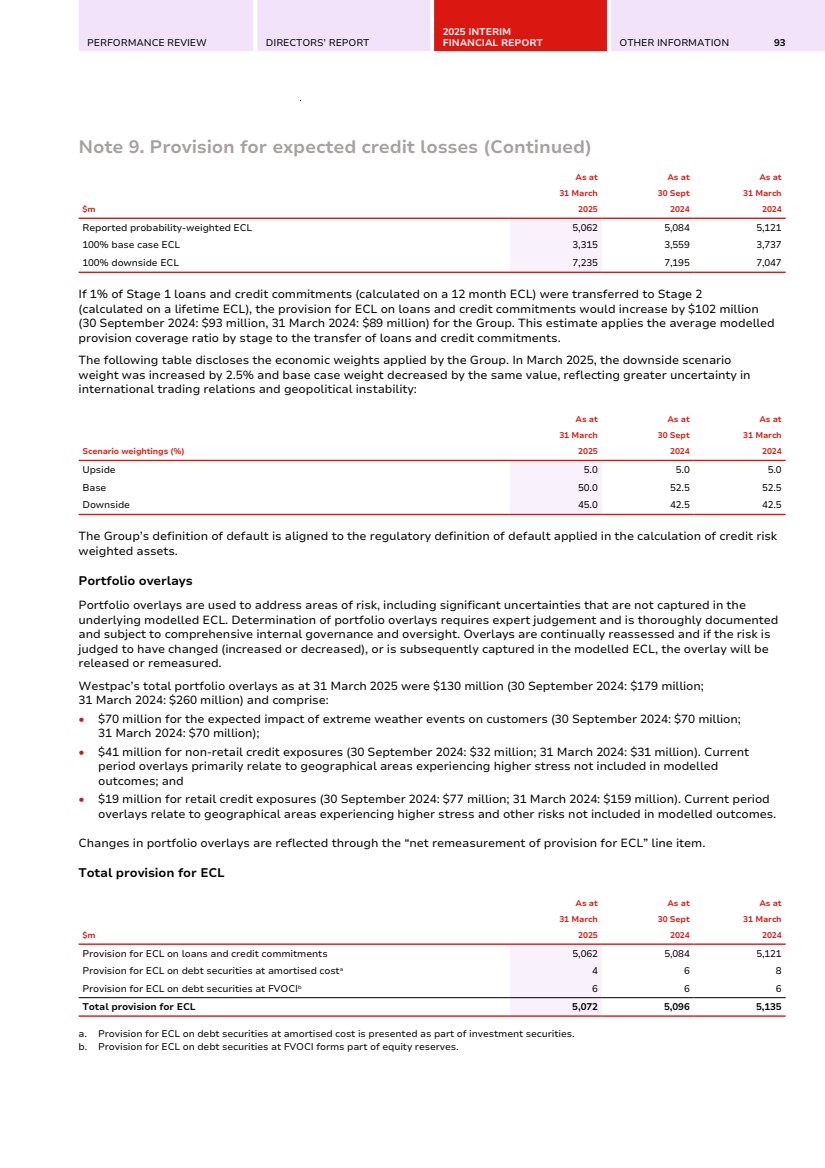
| 94 WESTPAC GROUP 2025 INTERIM FINANCIAL RESULTS NOTES TO THE CONSOLIDATED FINANCIAL STATEMENTS Note 9. Provision for expected credit losses (Continued) Reconciliation of impairment charges Half Year Half Year Half Year March Sept March $m 2025 2024 2024 Loans and credit commitments: Business activity during the perioda (162) (239) (79) Net remeasurement of the provision for ECLa 529 515 529 Impairment charges for debt securities at amortised cost (2) (1) 1 Impairment charges for debt securities at FVOCI - - 1 Recoveries (115) (100) (90) Impairment charges/(benefits) 250 175 362 a. The attribution of amounts disclosed in the movement schedule were revised in Second Half 2024 to better reflect the nature of the changes in the provision for ECL. Comparatives have been revised to align with current period presentation. Note 10. Credit quality Credit risk ratings system The principal objective of the credit risk rating system is to reliably assess the credit risk to which Westpac is exposed. Westpac has two main approaches to this assessment. Transaction-managed customers Transaction-managed customers are generally customers with business lending exposures. They are individually assigned a Customer Risk Grade (CRG), corresponding to their expected probability of default (PD). Each facility is assigned a loss given default (LGD). Westpac’s risk rating system has a tiered scale of risk grades for both non-defaulted customers and defaulted customers. Non-defaulted CRGs are mapped to Moody’s Ratings, and S&P Global Ratings (S&P) external senior unsecured ratings. The table below shows Westpac’s high level CRGs for transaction-managed portfolios mapped to Westpac’s credit quality disclosure categories and to their corresponding external rating. Transaction-managed Financial statement disclosure Westpac CRG Moody’s Rating S&P Rating Strong A Aaa – Aa3 AAA – AA– B A1 – A3 A+ – A– C Baa1 – Baa3 BBB+ – BBB– Good/satisfactory D Ba1 – B1 BB+ – B+ Westpac Rating Weak E Watchlist F Special Mention G Substandard/Default H Doubtful/Default |
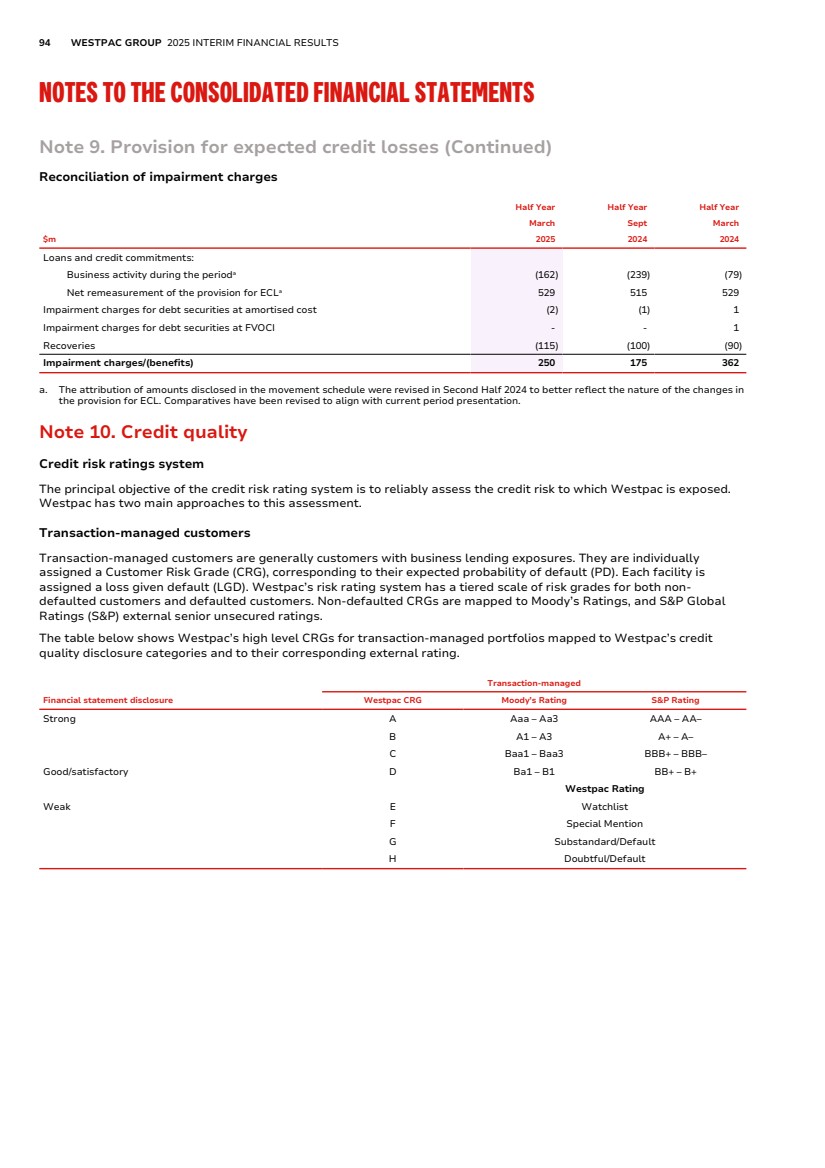
| PERFORMANCE REVIEW DIRECTORS’ REPORT 2025 INTERIM FINANCIAL REPORT OTHER INFORMATION 95 Note 10. Credit quality (Continued) Program-managed portfolio The program-managed portfolio generally includes retail products such as mortgages, personal lending (including credit cards) as well as certain small to medium sized enterprise lending. These credit exposures are grouped into pools of similar risk based on the analysis of characteristics that have historically predicted the likelihood of default, and a PD is assigned relative to the credit exposure's pool. The exposure is then assigned to strong, satisfactory or weak by benchmarking that PD against transaction-managed exposures, which are in turn mapped to external ratings per the above table. In addition, any program-managed exposures that are one or more days past due are classified as weak. The following table shows the credit quality of loans and undrawn credit commitments. As at 31 March 2025 As at 30 September 2024 As at 31 March 2024 $m Stage 1 Stage 2 Stage 3 Total Stage 1 Stage 2 Stage 3 Total Stage 1 Stage 2 Stage 3 Total Loans - housing Strong 320,124 26,370 - 346,494 311,054 24,975 - 336,029 299,274 26,816 - 326,090 Good/ satisfactory 160,217 42,624 - 202,841 159,016 45,242 - 204,258 160,286 47,093 - 207,379 Weak 2,232 15,745 6,399 24,376 2,512 16,389 6,893 25,794 2,168 15,203 6,423 23,794 Total loans - housing 482,573 84,739 6,399 573,711 472,582 86,606 6,893 566,081 461,728 89,112 6,423 557,263 Loans - personal Strong 3,903 113 - 4,016 4,104 104 - 4,208 4,216 100 - 4,316 Good/ satisfactory 4,777 822 - 5,599 5,254 825 - 6,079 5,642 882 - 6,524 Weak 139 522 164 825 191 570 190 951 253 661 197 1,111 Total loans - personal 8,819 1,457 164 10,440 9,549 1,499 190 11,238 10,111 1,643 197 11,951 Loans - business Strong 96,033 11,885 - 107,918 81,696 19,387 - 101,083 72,541 21,771 - 94,312 Good/ satisfactory 88,240 39,354 - 127,594 75,873 47,282 - 123,155 66,215 50,872 - 117,087 Weak 230 6,057 3,436 9,723 200 6,347 3,231 9,778 187 5,454 3,167 8,808 Total loans - business 184,503 57,296 3,436 245,235 157,769 73,016 3,231 234,016 138,943 78,097 3,167 220,207 Undrawn credit commitments Strong 147,752 11,194 - 158,946 140,786 14,341 - 155,127 135,663 16,733 - 152,396 Good/ satisfactory 43,903 12,550 - 56,453 40,271 14,186 - 54,457 40,622 14,848 - 55,470 Weak 180 1,693 484 2,357 218 1,868 441 2,527 221 1,767 430 2,418 Total undrawn credit commitments 191,835 25,437 484 217,756 181,275 30,395 441 212,111 176,506 33,348 430 210,284 Total strong 567,812 49,562 - 617,374 537,640 58,807 - 596,447 511,694 65,420 - 577,114 Total good/satisfactory 297,137 95,350 - 392,487 280,414 107,535 - 387,949 272,765 113,695 - 386,460 Total weak 2,781 24,017 10,483 37,281 3,121 25,174 10,755 39,050 2,829 23,085 10,217 36,131 Total loans and undrawn credit commitments 867,730 168,929 10,483 1,047,142 821,175 191,516 10,755 1,023,446 787,288 202,200 10,217 999,705 |
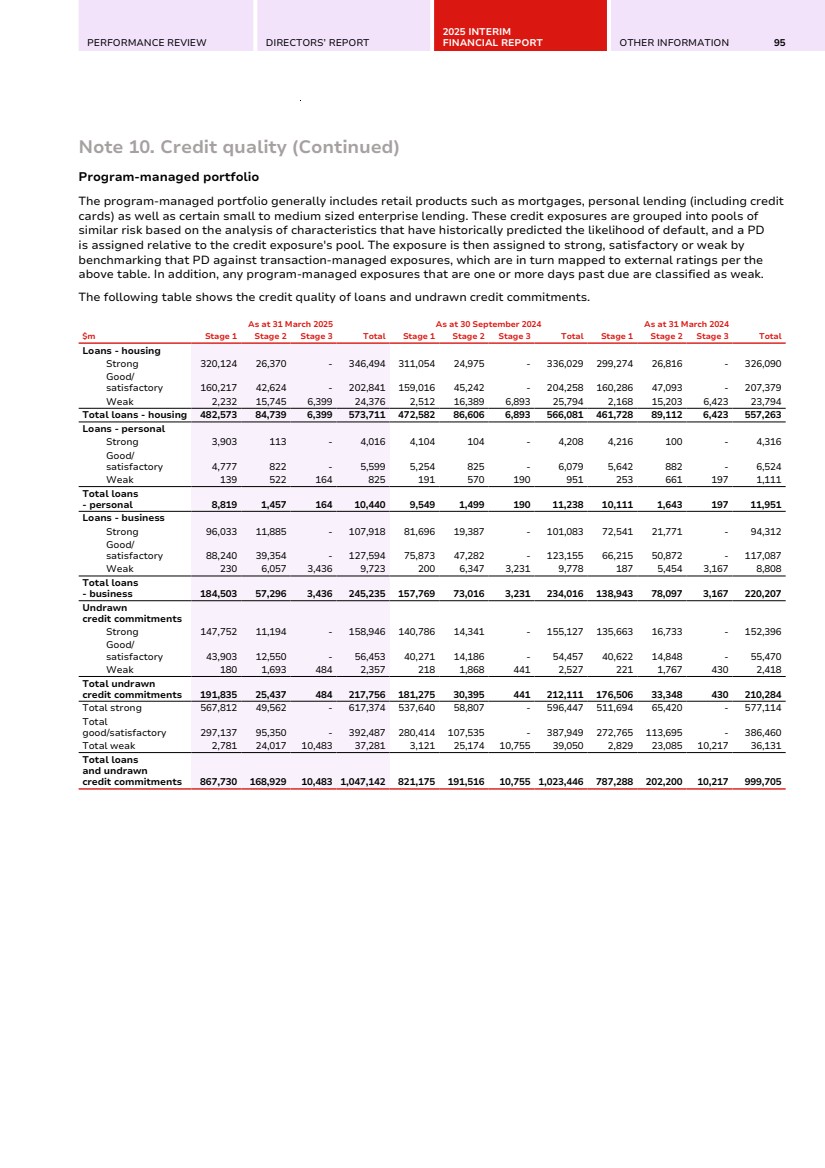
| 96 WESTPAC GROUP 2025 INTERIM FINANCIAL RESULTS NOTES TO THE CONSOLIDATED FINANCIAL STATEMENTS Note 11. Deposits and other borrowings As at As at As at % Mov't 31 March 30 Sept 31 March Mar 25 Mar 25 $m 2025 2024 2024 - Sept 24 - Mar 24 Australia Certificates of deposit 27,777 33,215 35,727 (16) (22) Non-interest bearing, repayable at call 133,046 128,705 121,313 3 10 Other interest bearing - transactions 113,433 110,393 114,120 3 (1) Other interest bearing - savings 209,035 197,415 186,945 6 12 Other interest bearing term 158,944 157,282 148,110 1 7 Total Australia 642,235 627,010 606,215 2 6 New Zealand Certificates of deposit 1,887 1,711 2,414 10 (22) Non-interest bearing, repayable at call 10,934 10,287 10,940 6 - Other interest bearing - transactions 8,556 8,815 8,385 (3) 2 Other interest bearing - savings 18,793 17,854 18,456 5 2 Other interest bearing term 35,303 36,245 34,597 (3) 2 Total New Zealand 75,473 74,912 74,792 1 1 Other overseas Certificates of deposit 12,824 11,948 13,139 7 (2) Non-interest bearing, repayable at call 1,145 1,193 1,323 (4) (13) Other interest bearing - transactions 1,107 736 849 50 30 Other interest bearing - savings 1,101 987 990 12 11 Other interest bearing term 5,365 3,703 4,918 45 9 Total other overseas 21,542 18,567 21,219 16 2 Total deposits and other borrowings 739,250 720,489 702,226 3 5 Note 12. Fair values of financial assets and financial liabilities Fair Valuation Control Framework Westpac uses a Fair Valuation Control Framework where the fair value is either determined or validated by a function independent of the transaction. This framework formalises the policies and procedures used to achieve compliance with relevant accounting, industry and regulatory standards. The framework includes specific controls relating to: • The revaluation of financial instruments; • Independent price verification; • Fair value adjustments; and • Financial reporting. A key element of the framework is the Revaluation Committee, comprising senior valuation specialists from within Westpac. The Revaluation Committee reviews the application of the agreed policies and procedures to assess that a fair value measurement basis has been applied. The method of determining fair value differs depending on the information available. |
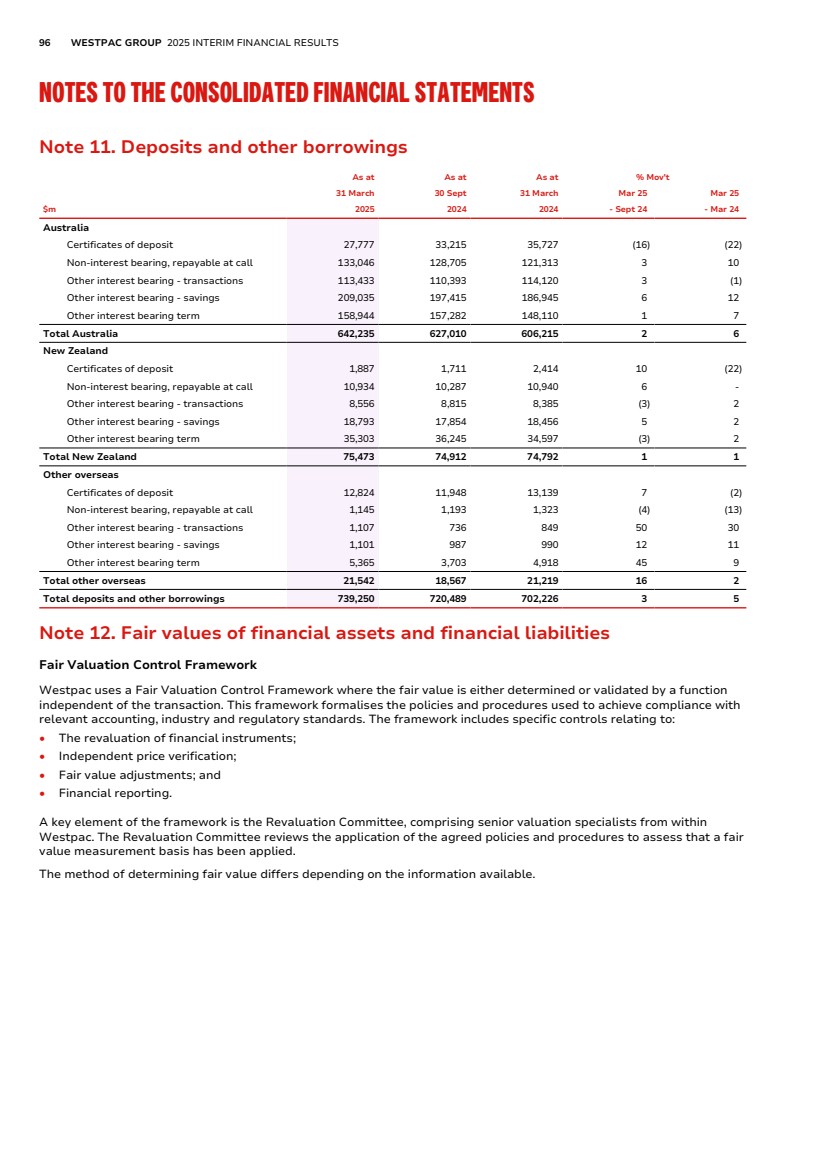
| PERFORMANCE REVIEW DIRECTORS’ REPORT 2025 INTERIM FINANCIAL REPORT OTHER INFORMATION 97 Note 12. Fair values of financial assets and financial liabilities (Continued) Fair value hierarchy A financial instrument’s categorisation within the valuation hierarchy is based on the lowest level input that is significant to the fair value measurement. Westpac categorises all fair value instruments according to the hierarchy described below. Valuation techniques Westpac applies market accepted valuation techniques in determining the fair valuation of over the counter (OTC) derivatives. This includes CVA and FVA, which incorporate credit risk and funding costs and benefits that arise primarily in relation to uncollateralised derivative positions, respectively. The specific valuation techniques, the observability of the inputs used in valuation models and the subsequent classification for each significant product category are outlined as follows: Level 1 instruments (Level 1) The fair value of financial instruments traded in active markets is based on recent unadjusted quoted prices. These prices are based on actual arm’s length basis transactions. The valuation of Level 1 instruments require little or no management judgement. Instrument Balance sheet category Includes Valuation Exchange traded products Derivatives Exchange traded interest rate futures and options and commodity and carbon futures All these instruments are traded in liquid, active markets where prices are readily observable. No modelling or assumptions are used in the valuation. FX products Derivatives FX spot and futures contracts Equity products Derivatives Trading securities and financial assets measured at FVIS Other financial liabilities Listed equities and equity indices Debt instruments Trading securities and financial assets measured at FVIS Investment securities Other financial liabilities Australian Commonwealth and New Zealand government bonds Level 2 instruments (Level 2) The fair value for financial instruments that are not actively traded is determined using valuation techniques which maximise the use of observable market prices. Valuation techniques include: • The use of market standard discounting methodologies; • Option pricing models; and • Other valuation techniques widely used and accepted by market participants. Instrument Balance sheet category Includes Valuation Interest rate products Derivatives Interest rate and inflation swaps, swaptions, caps, floors, collars and other non-vanilla interest rate derivatives Industry standard valuation models are used to calculate the expected future value of payments by product, which is discounted back to a present value. The model’s interest rate inputs are benchmark and actively quoted interest rates in the swap, bond and futures markets. Interest rate volatilities are sourced from brokers and consensus data providers. If consensus prices are not available, these are classified as Level 3 instruments. FX products Derivatives FX swaps, FX forward contracts, FX options and other non-vanilla FX derivatives Derived from market observable inputs or consensus pricing providers using industry standard models. If consensus prices are not available, these are classified as Level 3 instruments. Other credit products Derivatives Single name and index credit default swaps Valued using an industry standard model that incorporates the credit spread as its principal input. Credit spreads are obtained from consensus data providers. If consensus prices are not available, these are classified as Level 3 instruments. |
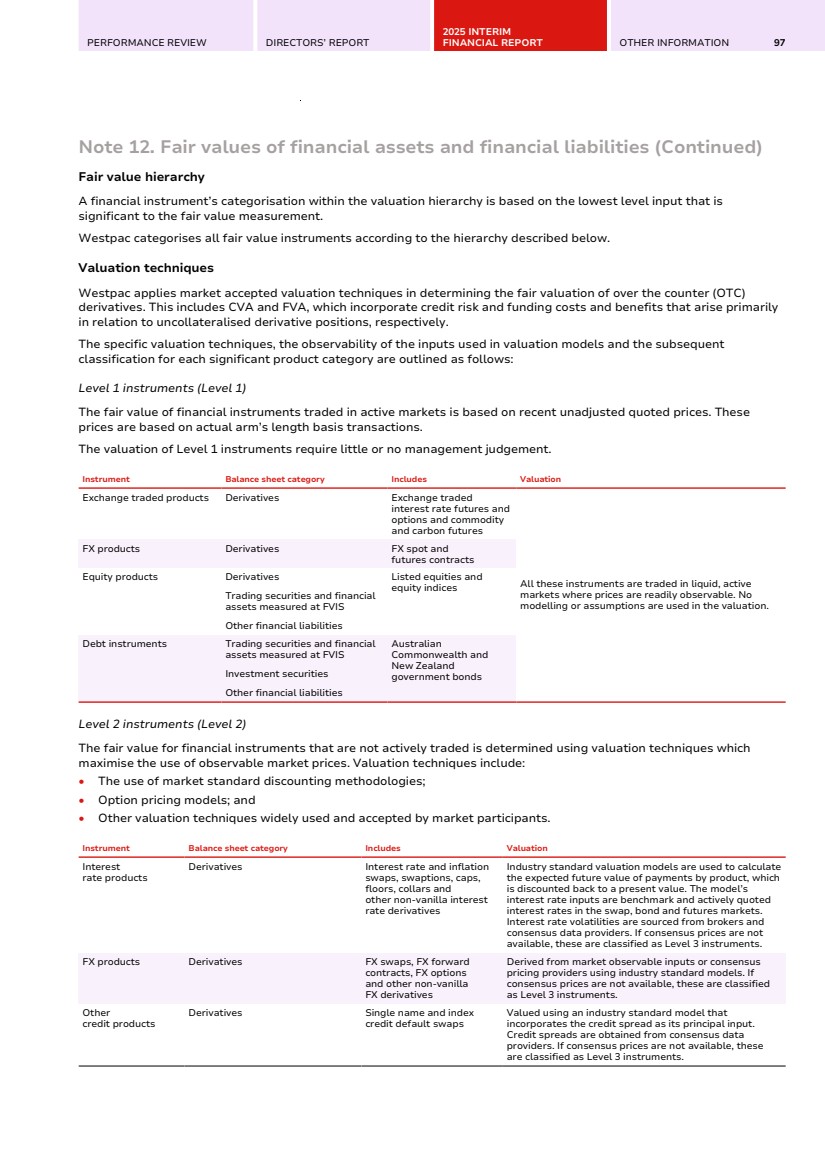
| 98 WESTPAC GROUP 2025 INTERIM FINANCIAL RESULTS NOTES TO THE CONSOLIDATED FINANCIAL STATEMENTS Note 12. Fair values of financial assets and financial liabilities (Continued) Instrument Balance sheet category Includes Valuation Commodity products Derivatives Commodity and carbon derivatives Valued using industry standard models. The models calculate the expected future value of deliveries and payments and discount them back to a present value. The model inputs include forward curves, volatilities implied from market observable inputs, discount curves and underlying spot and futures prices. The significant inputs are market observable or available through a consensus data service. If consensus prices are not available, these are classified as Level 3 instruments. Equity products Derivatives Exchange traded equity options, OTC equity options and equity warrants Due to low liquidity, exchange traded equity options are Level 2. Valued using industry standard models based on observable parameters such as stock prices, dividends, volatilities and interest rates. Asset backed debt instruments Trading securities and financial assets measured at FVIS Investment securities Australian residential mortgage backed securities (RMBS) and other asset backed securities (ABS) Valued using an industry approach to value floating rate debt with prepayment features. Australian RMBS are valued using prices sourced from a consensus data provider. If consensus prices are not available, these are classified as Level 3 instruments. Non-asset backed debt instruments Trading securities and financial assets measured at FVIS Investment securities Other financial liabilities State and other government bonds, corporate bonds and commercial paper Repurchase agreements and reverse repurchase agreements over non-asset backed debt securities Valued using observable market prices, which are sourced from independent pricing services, broker quotes or inter-dealer prices. If prices are not available from these sources, these are classified as Level 3 instruments. Loans at fair value Loans Fixed rate bills and syndicated loans Discounted cash flow approach, using a discount rate which reflects the terms of the instrument and the timing of cash flows, adjusted for creditworthiness, or expected sale amount. Certificates of deposit Deposits and other borrowings Certificates of deposit Discounted cash flow using market rates offered for deposits of similar remaining maturities. Debt issues at fair value Debt issues Debt issues Discounted cash flows, using a discount rate which reflects the terms of the instrument and the timing of cash flows adjusted for market observable changes in Westpac’s implied credit worthiness. Level 3 instruments (Level 3) Financial instruments valued where at least one input that could have a significant effect on the instrument’s valuation is not based on observable market data due to illiquidity or complexity of the product. These inputs are generally derived and extrapolated from other relevant market data and calibrated against current market trends and historical transactions. These valuations are calculated using a high degree of management judgement. Instrument Balance sheet category Includes Valuation Debt instruments Trading securities and financial assets measured at FVIS Investment securities Certain debt securities with low observability, usually issued via private placement These securities are evaluated by an independent pricing service or based on third party revaluations. Due to their illiquidity and/or complexity these are classified as Level 3 assets. Equity instruments Investment securities Strategic equity investments Valued using valuation techniques appropriate to the instrument, including the use of recent arm’s length transactions where available, discounted cash flow approach or reference to the net assets of the entity. Due to their illiquidity, complexity and/or use of unobservable inputs into valuation models, they are classified as Level 3 assets. |
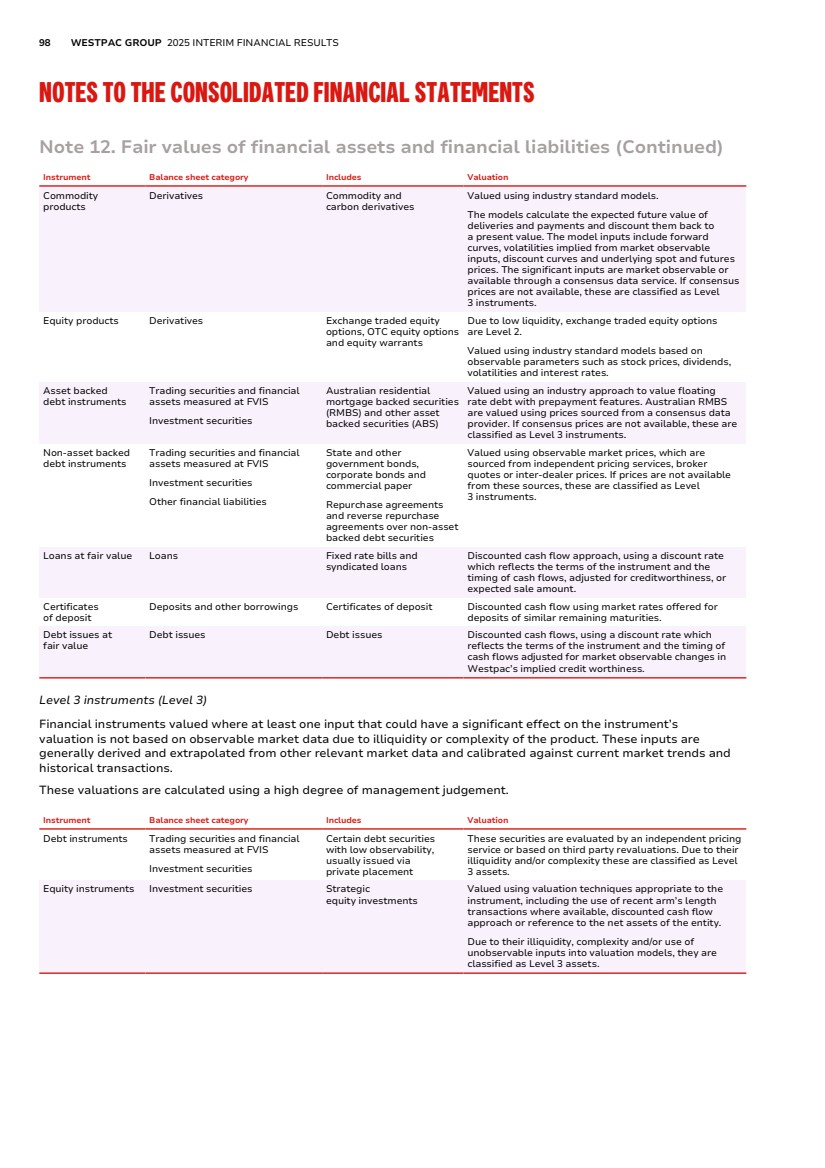
| PERFORMANCE REVIEW DIRECTORS’ REPORT 2025 INTERIM FINANCIAL REPORT OTHER INFORMATION 99 Note 12. Fair values of financial assets and financial liabilities (Continued) The following table summarises the attribution of financial instruments measured at fair value to the fair value hierarchy. $m Level 1 Level 2 Level 3 Total As at 31 March 2025 Financial assets measured at fair value on a recurring basis Trading securities and financial assets measured at FVIS 17,797 33,290 1 51,088 Derivative financial instruments 20 19,321 6 19,347 Investment securities 23,030 90,601 487 114,118 Loans - 17 14 31 Total financial assets measured at fair value on a recurring basis 40,847 143,229 508 184,584 Financial liabilities measured at fair value on a recurring basis Deposits and other borrowings - 42,485 - 42,485 Other financial liabilities 1,696 20,457 - 22,153 Derivative financial instruments 11 21,503 6 21,520 Debt issues - 4,439 - 4,439 Total financial liabilities measured at fair value on a recurring basis 1,707 88,884 6 90,597 As at 30 September 2024 Financial assets measured at fair value on a recurring basis Trading securities and financial assets measured at FVIS 15,522 33,700 6 49,228 Derivative financial instruments 13 24,089 7 24,109 Investment securities 14,117 88,155 447 102,719 Loans - 210 15 225 Total financial assets measured at fair value on a recurring basis 29,652 146,154 475 176,281 Financial liabilities measured at fair value on a recurring basis Deposits and other borrowings - 46,878 - 46,878 Other financial liabilities 891 18,428 - 19,319 Derivative financial instruments 14 30,955 5 30,974 Debt issues - 5,385 - 5,385 Total financial liabilities measured at fair value on a recurring basis 905 101,646 5 102,556 As at 31 March 2024 Financial assets measured at fair value on a recurring basis Trading securities and financial assets measured at FVIS 5,069 28,866 8 33,943 Derivative financial instruments 24 15,748 23 15,795 Investment securities 5,030 83,897 460 89,387 Loans - - 14 14 Total financial assets measured at fair value on a recurring basis 10,123 128,511 505 139,139 Financial liabilities measured at fair value on a recurring basis Deposits and other borrowings - 51,273 - 51,273 Other financial liabilities 2,040 18,236 - 20,276 Derivative financial instruments 11 18,312 94 18,417 Debt issues - 3,406 - 3,406 Total financial liabilities measured at fair value on a recurring basis 2,051 91,227 94 93,372 |
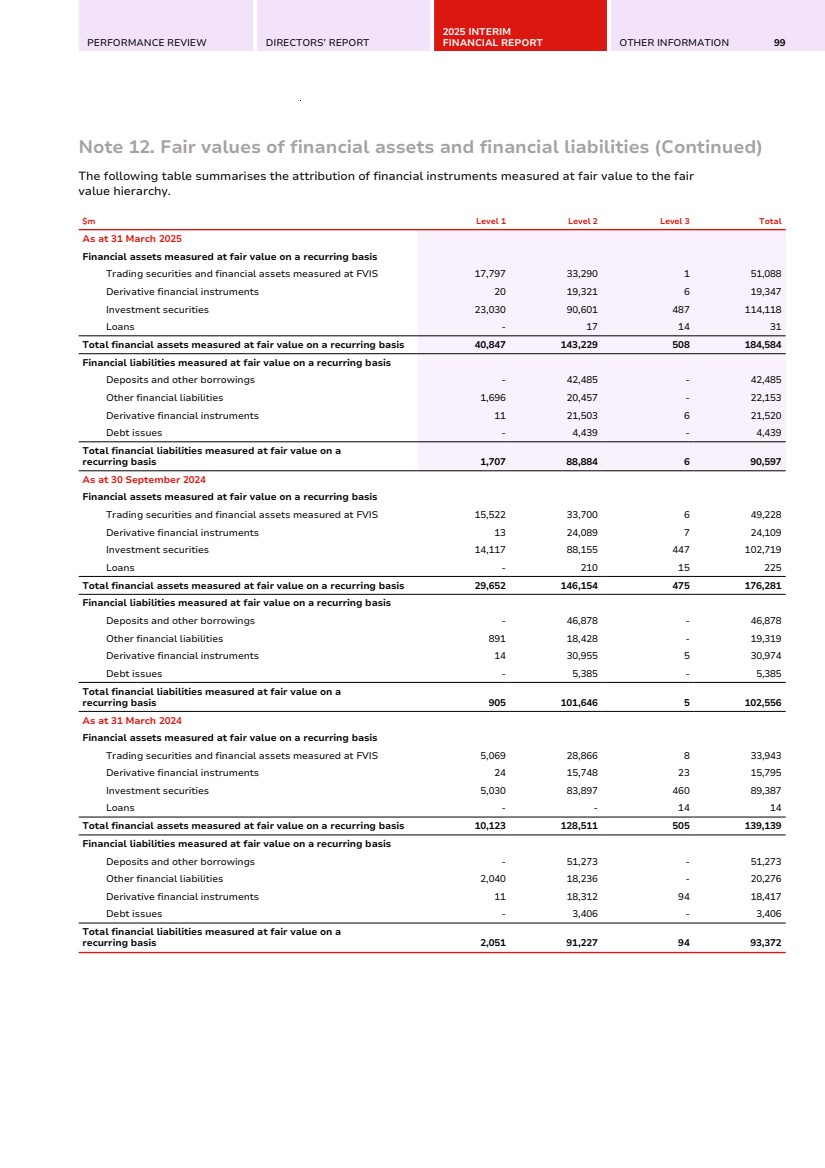
| 100 WESTPAC GROUP 2025 INTERIM FINANCIAL RESULTS NOTES TO THE CONSOLIDATED FINANCIAL STATEMENTS Note 12. Fair values of financial assets and financial liabilities (Continued) Reconciliation of non-market observables The following table summarises the changes in financial instruments measured at fair value derived from non-market observable valuation techniques (Level 3). Half Year March 2025 $m Trading securities and financial assets measured at FVIS Investment Securities Derivative and other assets Total Level 3 assets Derivative liabilities Total Level 3 liabilities Balance as at beginning of period 6 447 22 475 5 5 Gains/(losses) on assets / (gains)/losses on liabilities recognised in: Income statement - - (1) (1) 10 10 Other comprehensive income - 28 - 28 - - Acquisitions and issues 4 1 3 8 10 10 Disposals and settlements (9) (1) (4) (14) (3) (3) Transfer into or out of non-market observables - 8 - 8 (16) (16) Foreign currency translation impacts - 4 - 4 - - Balance as at end of period 1 487 20 508 6 6 Unrealised gains/(losses) recognised in the income statement for financial instrument held as at end of period - - 1 1 1 1 Transfers into and out of Level 3 have occurred due to changes in observability in the significant inputs into the valuation models used to determine the fair value of the related financial instruments. Transfers in and transfers out are reported using the end of period fair values. Significant unobservable inputs Sensitivities to reasonably possible changes in non-market observable valuation assumptions would not have a material impact on Westpac's reported results. Day one profit or loss The closing balance of unrecognised day one profit was nil as at 31 March 2025 (30 September 2024: $1 million, 31 March 2024: nil). |
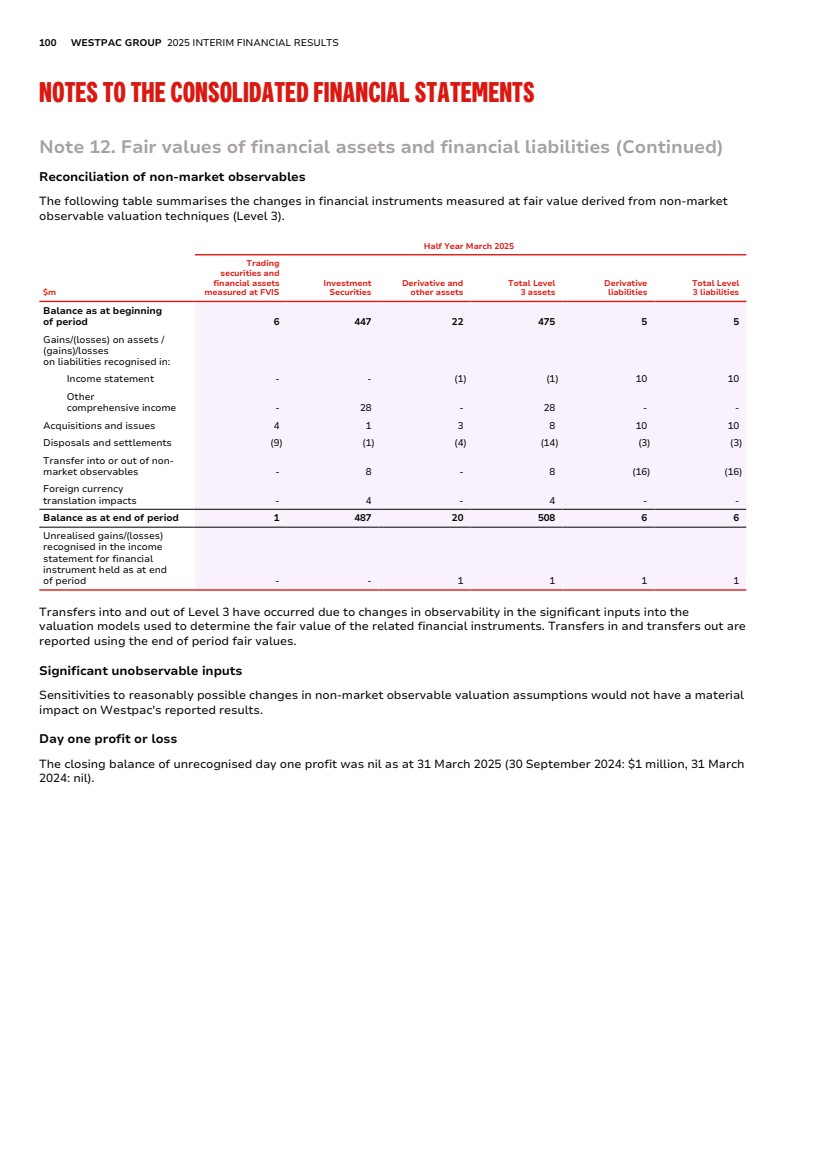
| PERFORMANCE REVIEW DIRECTORS’ REPORT 2025 INTERIM FINANCIAL REPORT OTHER INFORMATION 101 Note 12. Fair values of financial assets and financial liabilities (Continued) Financial instruments not measured at fair value The following table summarises the estimated fair value of financial instruments not measured at fair value for the Group. As at 31 March 2025 As at 30 Sept 2024 As at 31 March 2024 $m Carrying amount Fair value Carrying amount Fair value Carrying amount Fair value Financial assets not measured at fair value Cash and balances with central banks 58,352 58,352 65,667 65,667 95,907 95,907 Collateral paid 6,190 6,190 6,269 6,269 4,671 4,671 Investment securities 1,068 1,068 1,166 1,166 1,200 1,200 Loans 824,777 824,775 806,542 805,776 784,825 782,246 Other financial assets 7,886 7,886 5,456 5,456 11,266 11,266 Total financial assets not measured at fair value 898,273 898,271 885,100 884,334 897,869 895,290 Financial liabilities not measured at fair value Collateral received 3,738 3,738 3,078 3,078 2,534 2,534 Deposits and other borrowings 696,765 697,583 673,611 674,384 650,953 651,550 Other financial liabilities 22,528 22,528 18,758 18,758 34,116 34,116 Debt issuesa 167,425 168,065 163,899 164,505 156,375 156,705 Loan capitala 40,703 42,171 37,883 39,390 37,280 38,544 Total financial liabilities not measured at fair value 931,159 934,085 897,229 900,115 881,258 883,449 a. The estimated fair values of debt issues and loan capital include the impact of changes in Westpac’s credit spreads since origination. A detailed description of how fair value is derived for financial instruments not measured at fair value is disclosed in Note 22 of the 2024 Annual Report. Note 13. Provisions, contingent liabilities, contingent assets and credit commitments Provisions are recognised for present obligations arising from past events where a payment (or other economic transfer) is likely to be necessary to settle the obligation and can be reliably estimated. Provisions raised by the Group are set out in the table in the “Provisions” section below. Where it is not probable there will be an outflow of economic resources or where a liability cannot be reliably estimated a contingent liability may exist. Provisions As at 31 March 2025 $m Long service leave Annual leave and other employee benefits Provision for impairment on credit commitments Lease restoration obligations Restructuring and other provisions Litigation, non-lending losses and remediation provisions Total Balance as at beginning of period 477 899 516 163 210 240 2,505 Additions 46 581 15 3 77 128 850 Utilisation (21) (864) - (5) (62) (60) (1,012) Reversal of unutilised provisions (11) (2) (47) - (20) (9) (89) Balance as at end of period 491 614 484 161 205 299 2,254 |
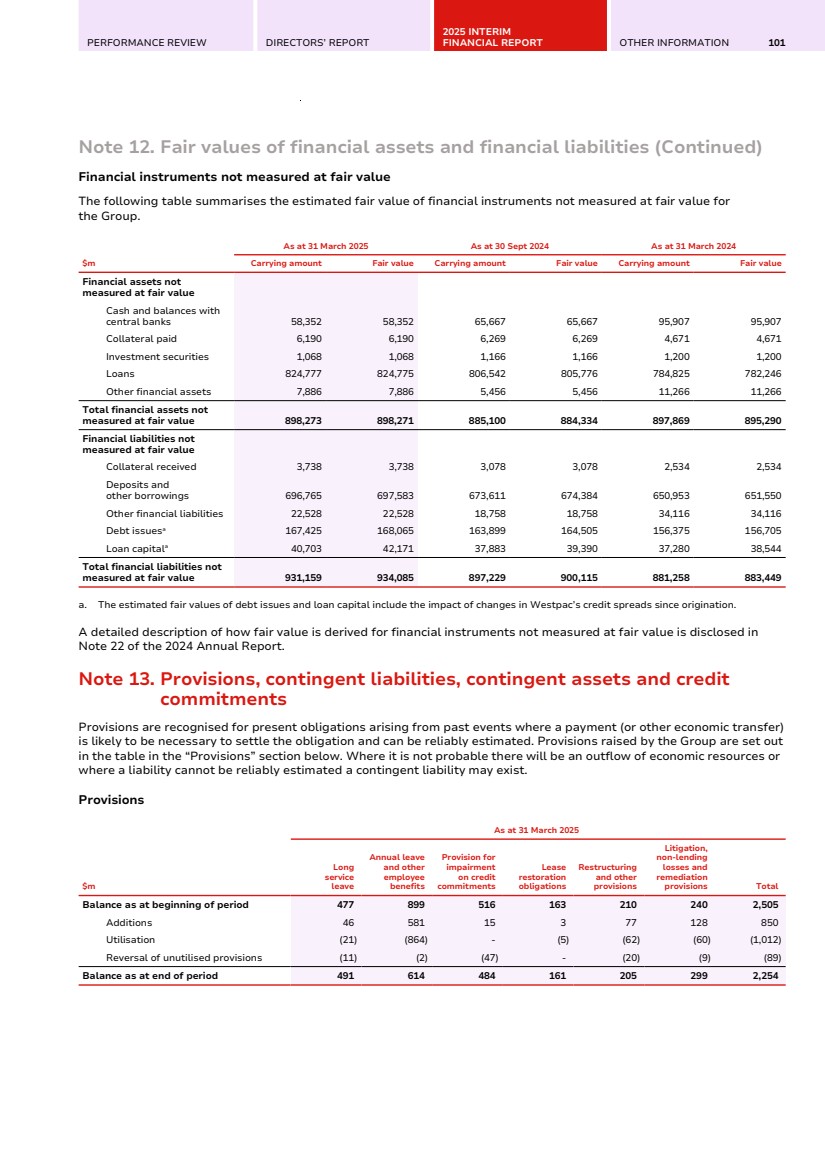
| 102 WESTPAC GROUP 2025 INTERIM FINANCIAL RESULTS NOTES TO THE CONSOLIDATED FINANCIAL STATEMENTS Note 13. Provisions, contingent liabilities, contingent assets and credit commitments (Continued) Litigation, non-lending losses and remediation provisions As at 31 March 2025, these provisions included estimates of: • Customer refunds associated with matters of potential historical misconduct; • Costs of completing remediation programs; and • Potential non-lending losses and costs connected with certain litigation and regulatory investigations. It is possible that the final outcome could be below or above the provision, if the actual outcome differs from the assumptions used in estimating the provision. Remediation processes may change over time as further facts emerge and such changes could result in a change to the final exposure. Certain litigation and regulatory matters As at 31 March 2025, the Group held provisions in respect of potential non-lending losses and costs connected with certain litigation and regulatory matters, including: • Civil penalty proceedings commenced by ASIC against Westpac on 4 September 2023, alleging contraventions under the National Credit Code (Credit Code) and National Consumer Credit Protection Act 2009 (Cth). The proceedings relate to system and operational failures and allege that Westpac did not respond to 277 online hardship applications between 2015 and 2023 within the time-frames required under the Credit Code. Westpac self-reported the incidents to ASIC and has remediated impacted customers. ASIC also alleges that Westpac failed to do all things necessary to ensure that credit activities were engaged in efficiently, honestly and fairly. The proceeding has been listed for a final hearing on liability and penalty on 26 May 2025; • A class action commenced against Westpac and St.George Finance Limited (SGF) on 15 July 2020, in the Supreme Court of Victoria in relation to flex commissions paid to auto dealers from 1 March 2013 to 31 October 2018. It was alleged that Westpac and SGF are liable for the unfair conduct of dealers acting as credit representatives and engaged in misleading or deceptive conduct. This proceeding was one of several class actions commenced against lenders in the auto finance industry. Westpac and SGF settled the class action on 14 March 2025 without admission of liability, subject to Court approval. The settlement amount of $130 million is included in the 31 March 2025 provisions. Westpac has not paid such flex commissions since 2018; and • An enforcement investigation by ASIC into Westpac and RAMS Financial Group Pty Limited (RFG) relating to conduct of RAMS authorised credit representatives (including RAMS franchisees) in connection with the provision of home loan products from 1 January 2019 to 1 September 2023. The current focus of ASIC’s investigation is on general conduct obligations, prohibitions on conducting business with unaccredited loan referrers and unlicensed persons, conflicts of interest and giving misleading information. There remains uncertainty as to the expense that may be associated with these matters, including the approach that the relevant counterparty or Courts may take in relation to these matters, and the Court’s assessment of applicable fines, penalties, loss or damages. It is possible that the actual aggregate expense to Westpac associated with a Court determined resolution of these matters may be higher or lower than the provision. Restructuring provisions Westpac carries restructuring provisions for committed business restructures and branch closures. The provisions held primarily relate to separation costs and redundancies. Lease restoration obligations The lease restoration provision reflects an estimate of the cost of making good leasehold premises at the end of Westpac’s property leases. Contingent liabilities Contingent liabilities are possible obligations whose existence will be confirmed only by uncertain future events and present obligations where the transfer of economic resources is not probable or cannot be reliably measured. Contingent liabilities are not recognised on the balance sheet but are disclosed unless the outflow of economic resource is remote. Regulatory investigations, reviews and inquiries Domestic regulators, statutory authorities and other bodies, such as ASIC, the ACCC, APRA, AUSTRAC, BCCC, AFCA, the OAIC, the ATO and the Fair Work Ombudsman (FWO), as well as certain international regulators and other bodies such as the Reserve Bank of New Zealand, New Zealand Financial Markets Authority, New Zealand Commerce Commission, BPNG and its Financial Analysis & Supervision Unit, and the SEC, from time to time conduct investigations, reviews or inquiries (some of which may be industry wide). These activities can cover a range of matters (including potential contraventions and non-compliance) that involve, or may in the future, involve the Group. |
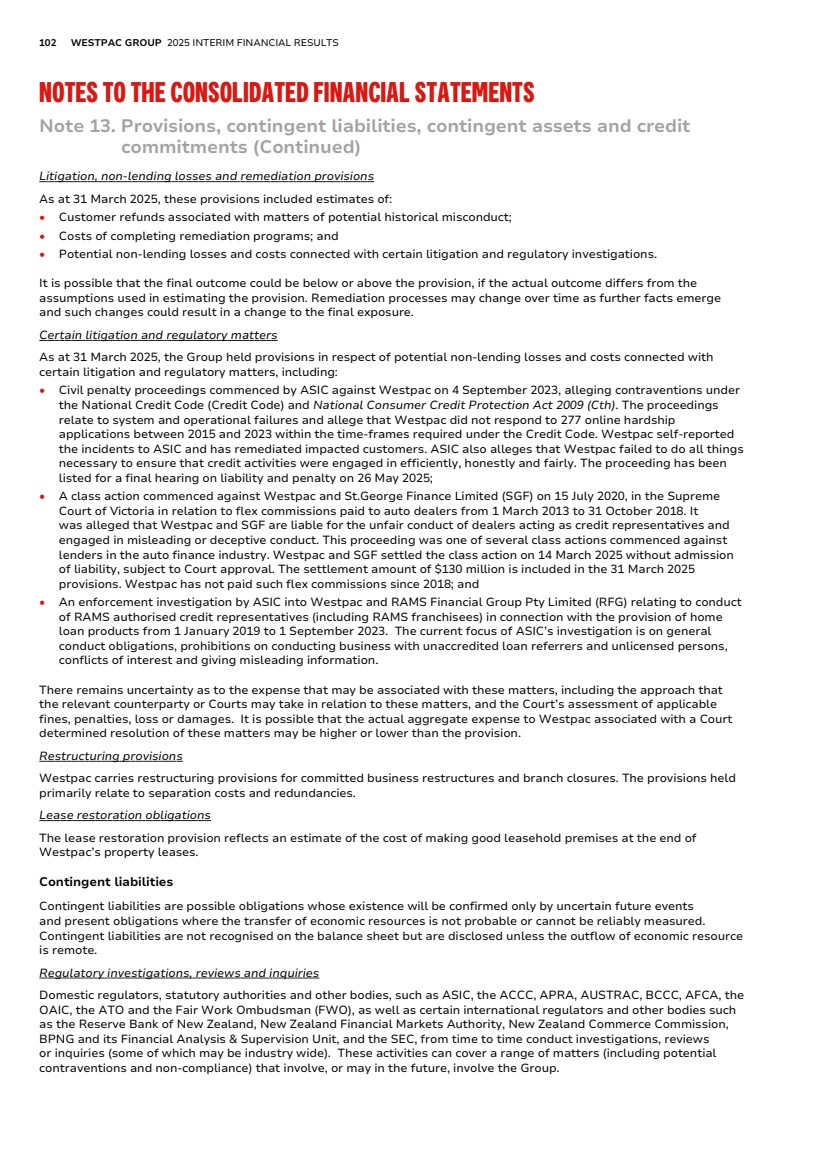
| PERFORMANCE REVIEW DIRECTORS’ REPORT 2025 INTERIM FINANCIAL REPORT OTHER INFORMATION 103 Note 13. Provisions, contingent liabilities, contingent assets and credit commitments (Continued) These currently include: • Engagement with the ATO in relation to the remediation and uplift of Westpac’s Common Reporting Standard (CRS) reporting; • Investigation by the FWO in relation to Westpac’s self-disclosed remediation program regarding employee pay-related entitlements. Westpac considers enforcement action against it likely, and could include an Enforceable Undertaking; and • Regulatory investigations, reviews or inquiries into other areas such as risk governance, AML/CTF Program, including Transaction Monitoring Program and associated processes and procedures, compliance with industry codes, consumer lending conduct, compliance with lending obligations, consumer credit contracts banking products, hardship processes, and Consumer Data Rights. It is uncertain what (if any) actions will result following the conclusion of these investigations or matters. No provisions have yet been made in relation to any financial liability that might arise, or costs that may be incurred in the event proceedings are pursued in relation to the matters outlined above. Such investigations, reviews or inquiries, or risk-based decisions taken by Westpac regarding relevant businesses, have previously resulted, and/or may in the future result in litigation (including class action proceedings and criminal proceedings), significant fines and penalties, infringement notices, enforcement action including enforceable undertakings, requirement to undertake a review, referral to the relevant Commonwealth or State Director of Public Prosecutions for consideration for criminal prosecution, imposition of capital or liquidity requirements, licence revocation, suspension or variation, customer remediation or other sanctions or actions being taken by regulators or other parties. Investigations have in some instances resulted, and could in the future result, in findings of a significant number of breaches of obligations. This in turn could lead to significant financial and other penalties. Prior penalties and contraventions by Westpac in relation to similar issues can also affect penalties that may be imposed. Reliance on third parties and any contributing actions of third parties may not mitigate penalties. Litigation There are ongoing Court proceedings, claims and possible claims against the Group. Contingent liabilities exist in respect of actual and potential claims and proceedings, including those listed below. Class actions In addition to the class action litigation noted under Provisions, above: • Westpac is defending a class action proceeding which was commenced in December 2019 in the Federal Court of Australia on behalf of certain investors who acquired an interest in Westpac securities between 16 December 2013 and 19 November 2019. The proceeding involves allegations relating to market disclosure issues connected to Westpac’s monitoring of financial crime over the relevant period and matters which were the subject of the AUSTRAC civil proceedings. The damages sought on behalf of members of the class have not yet been specified. However, in the course of a procedural hearing in August 2022, the applicant indicated that a preliminary estimate of the losses that may be alleged in respect of a subset of potential group members exceeded $1 billion. While it remains unclear how the applicant will ultimately formulate their estimate of alleged damages claimed on behalf of group members, it is possible that the claim may be higher (or lower) than the amount referred to above. Given the time period and the nature of the claims alleged to be in question, along with the reduction in our market capitalisation at the time of the commencement of the AUSTRAC civil proceedings, it is likely that any total alleged damages (when, and if, ultimately articulated by the applicant) will be significant. Westpac continues to deny both that its disclosure was inappropriate and, as such, that any group member has incurred damage. The matter has not yet been set down for a hearing; and • Disputes have been raised by franchisees who were exited by RFG, including the commencement of a class action in May 2024. Following a strategic review by Westpac of the RAMS business, RFG closed the RAMS business to new home loan applications from 6 August 2024. |
| 104 WESTPAC GROUP 2025 INTERIM FINANCIAL RESULTS NOTES TO THE CONSOLIDATED FINANCIAL STATEMENTS Note 13. Provisions, contingent liabilities, contingent assets and credit commitments (Continued) Internal reviews and remediation As in prior periods, Westpac is continuing to undertake a number of reviews to identify and resolve issues that have the potential to impact our customers, employees, other stakeholders and reputation. These internal reviews continue to identify issues in respect of which we are taking, or will take, action including so that our customers and employees (as applicable) are not disadvantaged from certain past practices, including by making compensation/remediation payments and providing refunds where appropriate. These issues include, among other things, consumer lending conduct; compliance with lending obligations; hardship processes; sufficiency of training, policies, processes and procedures; AML/CTF Program, including Transaction Monitoring Program and associated processes and procedures; product disclosure; destruction and retention of personal information; and impacts from inadequate product governance, including the way some product terms and conditions are operationalised. By undertaking these reviews, we can also improve our processes and controls, including those of our contractors, agents, and authorised credit representatives. An assessment of the Group’s likely loss has been made on a case-by-case basis for the purpose of the financial statements but cannot always be reliably estimated. Even where Westpac has remediated or compensated customers, employees or issues, there can still be the risk of regulators challenging the basis, scope or pace of remediation, taking enforcement action (including seeking enforceable undertakings and contrition payments), or imposing fines/penalties or other sanctions, including civil or criminal prosecutions. Contingent liabilities may exist in respect of actual or potential claims or proceedings (which could be brought by customers, employees/unions, regulators or criminal prosecutors), compensation/remediation payments and/or refunds identified as part of these reviews. Contingent levies The Group is subject to a number of regulatory levies, which may be imposed at the discretion of the relevant regulating body. These include levies that fund the Financial Claims Scheme and the Compensation Scheme of Last Resort. Exposures to third parties relating to divested businesses The Group has potential exposures relating to warranties, indemnities and other commitments it has provided to third parties in connection with various divestments of entities, businesses and assets. The warranties, indemnities and other commitments cover a range of matters, conduct and risks. We have made payments under these indemnities and are in discussions with one or more parties in relation to claims made, and potential claims, under these arrangements. Provisions have been raised for matters where a present obligation exists, and a probable settlement can be reliably estimated. Contingent tax risk Tax and regulatory authorities in Australia and in other jurisdictions review, in the normal course of business, the direct and indirect taxation treatment of transactions (both historical and present-day transactions) undertaken by the Group. The Group also responds to various notices and requests for information it receives from tax and regulatory authorities. These reviews, notices and requests may result in additional tax liabilities (including interest and penalties). Westpac has assessed these and other taxation matters arising in Australia and elsewhere, including seeking independent advice. Clearing and settlement obligations Westpac is subject to the rules governing clearing and settlement activities under which loss sharing arrangements may arise. This includes the requirements of central clearing houses where the Group has made contributions to a default fund. In the event of a default of another clearing member, the Group could be required to make additional default fund contributions. Parent entity guarantees and undertakings to subsidiaries Consistent with 2024, Westpac Banking Corporation, as the parent entity of Westpac, makes the following guarantees and undertakings to its subsidiaries: • Letters of comfort for certain subsidiaries which recognise that Westpac has a responsibility that those subsidiaries continue to meet their obligations; and • Guarantees to certain wholly owned subsidiaries which are Australian financial services or credit licensees to comply with legislative requirements. All but two guarantees are capped at $20 million per year (with an automatic reinstatement for another $20 million) and two specific guarantees are capped at $2 million (with an automatic reinstatement for another $2 million). |
| PERFORMANCE REVIEW DIRECTORS’ REPORT 2025 INTERIM FINANCIAL REPORT OTHER INFORMATION 105 Note 13. Provisions, contingent liabilities, contingent assets and credit commitments (Continued) Contingent assets Undrawn credit commitments Westpac enters into various arrangements with customers that constitute contingent assets. If a specified contingent event occurs, these commitments will be called upon and recognised on the balance sheet as loans. Any associated cash outflows expose Westpac to liquidity risk, while the resulting receivable exposes Westpac to credit risk should the counterparty fail to repay amounts owed as they become due. Westpac’s maximum exposure to credit losses is the contractual or notional amount of the arrangement, noting that some credit commitments can be cancelled by Westpac at any time, and a significant portion are expected to expire without being drawn upon. As a result, notional amounts do not necessarily reflect future cash requirements. Westpac applies the same credit policies when entering into these arrangements as it does for on balance sheet instruments. Refer to Note 11 and Note 21 of the 2024 Annual Report for further details of credit risk and liquidity risk management, respectively. Undrawn credit commitments, excluding derivatives, are disclosed in the below table: • Financial guarantees, letters of credit and other credit substitutes support the financial obligations of customers to third parties. Utilisation of these contracts is generally dependent on the creditworthiness of the customer. The Group may hold cash as collateral for certain financial guarantees issued; • Performance-related contingencies support the non-monetary obligations of customers to third parties, where payment will generally need to be made if a customer fails to fulfil a non-monetary contractual obligation to that third party; • Remaining commitments to extend credit mainly comprises various forms of credit facilities. As at As at As at % Mov't 31 March 30 Sept 31 March Mar 25 Mar 25 $m 2025 2024 2024 - Sept 24 - Mar 24 Undrawn credit commitmentsa Financial guarantees, letters of credit and other credit substitutes 15,795 15,220 14,747 4 7 Performance-related contingencies 6,300 5,393 4,835 17 30 Remaining commitments to extend creditb 195,661 191,498 190,702 2 3 Total undrawn credit commitments 217,756 212,111 210,284 3 4 a. The composition of undrawn credit commitments has been revised to better reflect the nature of the types of commitments provided. Comparatives have been revised to align with current period presentation. b. In addition to the commitments disclosed above, $6.6 billion of credit exposures as at 31 March 2025 (30 September 2024: $6.0 billion, 31 March 2024: $6.8 billion) were offered and accepted but still revocable. These represent part of Westpac Group's maximum exposure to credit risk. |
| 106 WESTPAC GROUP 2025 INTERIM FINANCIAL RESULTS NOTES TO THE CONSOLIDATED FINANCIAL STATEMENTS Note 14. Shareholders’ equity As at As at As at 31 March 30 Sept 31 March $m 2025 2024 2024 Share capital Ordinary share capital, fully paid 37,354 37,958 38,944 Treasury sharesa (820) (758) (758) Total share capital 36,534 37,200 38,186 Non-controlling interest Perpetual Preference Shares (PPS) 336 339 - Otherb 2 8 38 Total non-controlling interests 338 347 38 a. 31 March 2025: 5,312,508 unvested RSP and EIP treasury shares held (30 September 2024: 6,173,874, 31 March 2024: 5,645,501). b. Westpac acquired 8.74% of the non-controlling interest in Westpac Bank-PNG-Limited during Second Half 2024. Perpetual Preference Shares (PPS) Westpac New Zealand Limited (WNZL), a wholly-owned subsidiary of Westpac, has NZD375 million of PPS with external investors. The PPS is recognised as a non-controlling interests to the Group at the amount paid up per share, net of directly attributable issue costs (NZD6 million). Discretionary distributions on PPS are recognised in equity when paid. Ordinary Shares Westpac does not have authorised capital and the ordinary shares have no par value. Ordinary shares entitle the holder to participate in dividends and, in the event of Westpac winding up, to a share of the proceeds in proportion to the number of and amounts paid on the shares held. Each ordinary share entitles the holder to one vote, either in person or by proxy, at a shareholder meeting. Reconciliation of movement in number of ordinary shares Half Year Half Year Half Year March Sept March Number 2025 2024 2024 Balance as at beginning of period 3,441,411,361 3,474,634,510 3,509,076,960 Share buybacka (17,711,952) (33,223,149) (34,442,450) Balance as at end of period 3,423,699,409 3,441,411,361 3,474,634,510 a. Westpac previously announced its intention to undertake a $3.5 billion on market buyback of WBC ordinary shares. In First Half 2025, Westpac has bought back and cancelled 17,711,952 ordinary shares. A further 497,280 shares were acquired on 31 March 2025 and cancelled on 2 April 2025 (Second Half 2024: 33,223,149, First Half 2024: 34,442,450). The ordinary shares were bought back at an average price of $31.92 (Second Half 2024: $28.99, First Half 2024: $24.65). Ordinary shares purchased on market Half Year March 2025 Average price Number ($) For share-based payment arrangements: Employee share plan (ESP) 807,480 31.77 Westpac Equity Incentive Plan (EIP) – Restricted Sharesa 1,782,131 32.32 Westpac Performance Plan (WPP) - share rights exercised 10,221 32.82 Westpac EIP - Unhurdled share rights exercised 13,812 33.65 Westpac on-market share purchase for future share rights exercises and restricted shares allocationsb 312,154 31.35 Net number of ordinary shares purchased on market 2,925,798 a. Ordinary shares allocated to employees under the EIP as Restricted Shares are classified as treasury shares until the shares vest. b. Unallocated shares in the Westpac Employee Equity Plans Trust that are classified as treasury shares. |
| PERFORMANCE REVIEW DIRECTORS’ REPORT 2025 INTERIM FINANCIAL REPORT OTHER INFORMATION 107 Note 14. Shareholders’ equity (Continued) Reconciliation of movement in reserves Half Year Half Year Half Year March Sept March $m 2025 2024 2024 Debt securities at FVOCI reserve Balance as at beginning of period (568) (182) (165) Net gains/(losses) from changes in fair value (13) (557) (34) Income tax effect 3 168 12 Transferred to income statement (4) 4 1 Income tax effect 2 (1) - Loss allowance on debt securities measured at FVOCI - - 1 Other 4 - 3 Balance as at end of period (576) (568) (182) Equity securities at FVOCI reserve Balance as at beginning of period 127 142 126 Net gains/(losses) from changes in fair value 29 (16) 14 Exchange differences on translation 3 1 - Income tax effect (1) - 2 Balance as at end of period 158 127 142 Share-based payment reserve Balance as at beginning of period 2,079 2,042 1,983 Share-based payment expense 67 37 59 Balance as at end of period 2,146 2,079 2,042 Cash flow hedge reserve Balance as at beginning of period 548 477 152 Net gains/(losses) from changes in fair value (39) 49 452 Income tax effect 11 (18) (140) Transferred to income statement 214 57 20 Income tax effect (64) (17) (7) Balance as at end of period 670 548 477 Foreign currency translation reserve Balance as at beginning of period (438) (300) (138) Exchange differences on translation of foreign operations 128 (154) (174) Gains/(losses) on net investment hedges (41) 16 12 Balance as at end of period (351) (438) (300) Other reserves Balance as at beginning of period (16) (22) (23) Transactions with owners (1) 6 1 Balance as at end of period (17) (16) (22) Total reserves 2,030 1,732 2,157 |
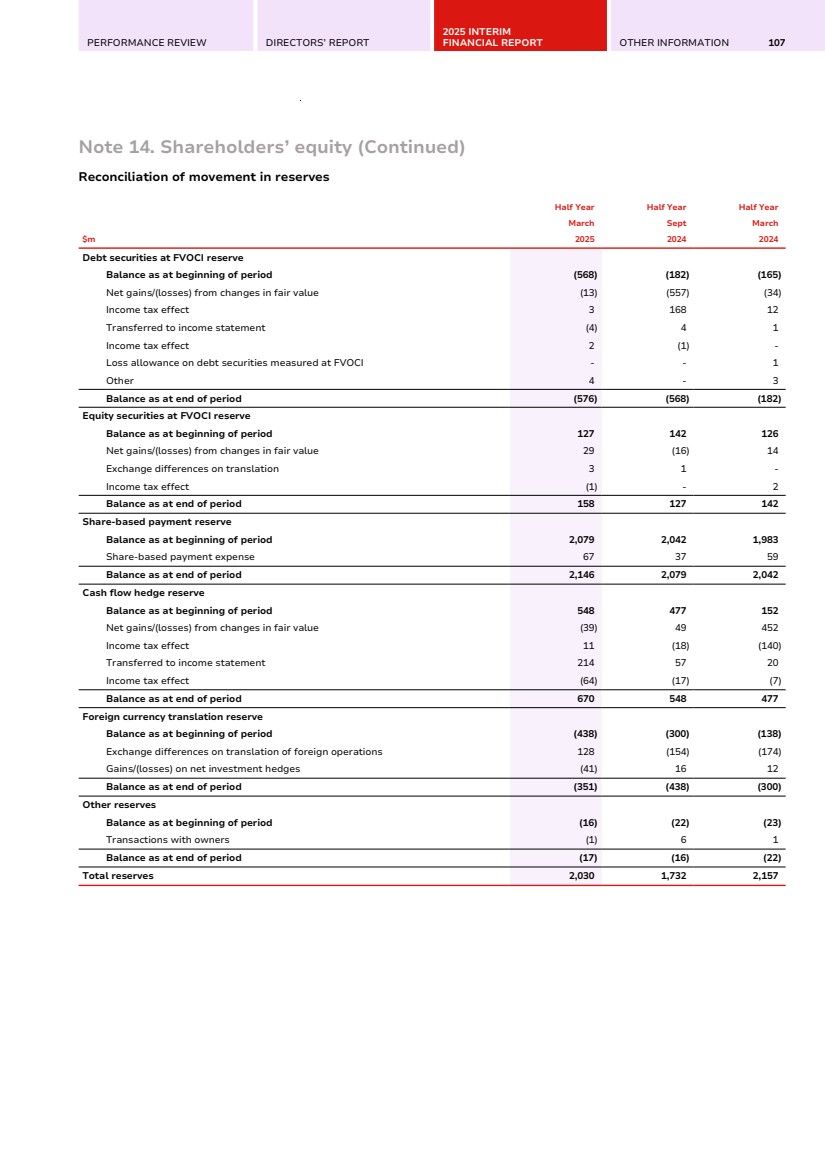
| 108 WESTPAC GROUP 2025 INTERIM FINANCIAL RESULTS NOTES TO THE CONSOLIDATED FINANCIAL STATEMENTS Note 15. Notes to the consolidated cash flow statement Reconciliation of net cash provided by/(used in) operating activities to profit after income tax expense for the period is set out below: Half Year Half Year Half Year % Mov't March Sept March Mar 25 Mar 25 $m 2025 2024 2024 - Sept 24 - Mar 24 Profit after income tax expense 3,325 3,648 3,342 (9) (1) Adjustments: Depreciation, amortisation and impairment 752 735 787 2 (4) Impairment charges/(benefits) 365 275 452 33 (19) Net decrease/(increase) in current and deferred tax (506) 69 (321) large 58 (Increase)/decrease in accrued interest receivable (91) 60 (287) large (68) (Decrease)/increase in accrued interest payable 115 266 536 (57) (79) (Decrease)/increase in provisions (251) 91 (363) large (31) Unrealised (gain)/loss in trading income (846) 1,081 534 large large Other non-cash items (810) (740) (381) 9 113 Cash flows from operating activities before changes in operating assets and liabilities 2,053 5,485 4,299 (63) (52) Net (increase)/decrease in: Collateral paid 555 (1,882) (215) large large Trading securities and financial assets measured at FVIS (1,394) (15,530) (3,464) (91) (60) Derivative financial instruments 8,256 (1,149) 313 large large Loans (19,357) (22,346) (12,737) (13) 52 Other financial assets (269) (9) (339) large (21) Other assets 17 (38) 4 large large Net increase/(decrease) in: Collateral received 378 653 (971) (42) large Deposits and other borrowings 16,833 19,761 15,482 (15) 9 Other financial liabilities 4,895 (10,842) 3,758 large 30 Other liabilities 2 5 (5) (60) large Net cash provided by/(used in) operating activities 11,969 (25,892) 6,125 large 95 |

| PERFORMANCE REVIEW DIRECTORS’ REPORT 2025 INTERIM FINANCIAL REPORT OTHER INFORMATION 109 Note 15. Notes to the consolidated cash flow statement (Continued) Non-cash financing activities Half Year Half Year Half Year % Mov't March Sept March Mar 25 Mar 25 $m 2025 2024 2024 - Sept 24 - Mar 24 Increase in lease liabilities 149 231 168 (35) (11) Restricted cash Certain of our foreign operations are required to maintain reserves or minimum balances with central banks in their respective countries of operation, totalling $285 million (30 September 2024: $311 million, 31 March 2024: $295 million) which are included in cash and balances with central banks. Note 16. Subsequent events Since 31 March 2025, the Board has determined to pay a fully franked interim ordinary dividend of 76 cents per fully paid ordinary share. The dividend is expected to be $2,602 million. The dividend is not recognised as a liability at 31 March 2025. The proposed payment date of the dividend is 27 June 2025. The Board has determined to satisfy the DRP for the 2025 interim ordinary dividend by arranging for the purchase of shares in the market by a third party. The market price used to determine the number of shares to be provided to DRP participants will be set over the 17 trading days commencing 14 May 2025 and will not include a discount. No other matters have arisen since the half year ended 31 March 2025, which are not otherwise dealt with in this 2025 Interim Financial Report, that have significantly affected or may significantly affect the operations of Westpac, the results of its operations or the state of affairs of Westpac in subsequent periods. |
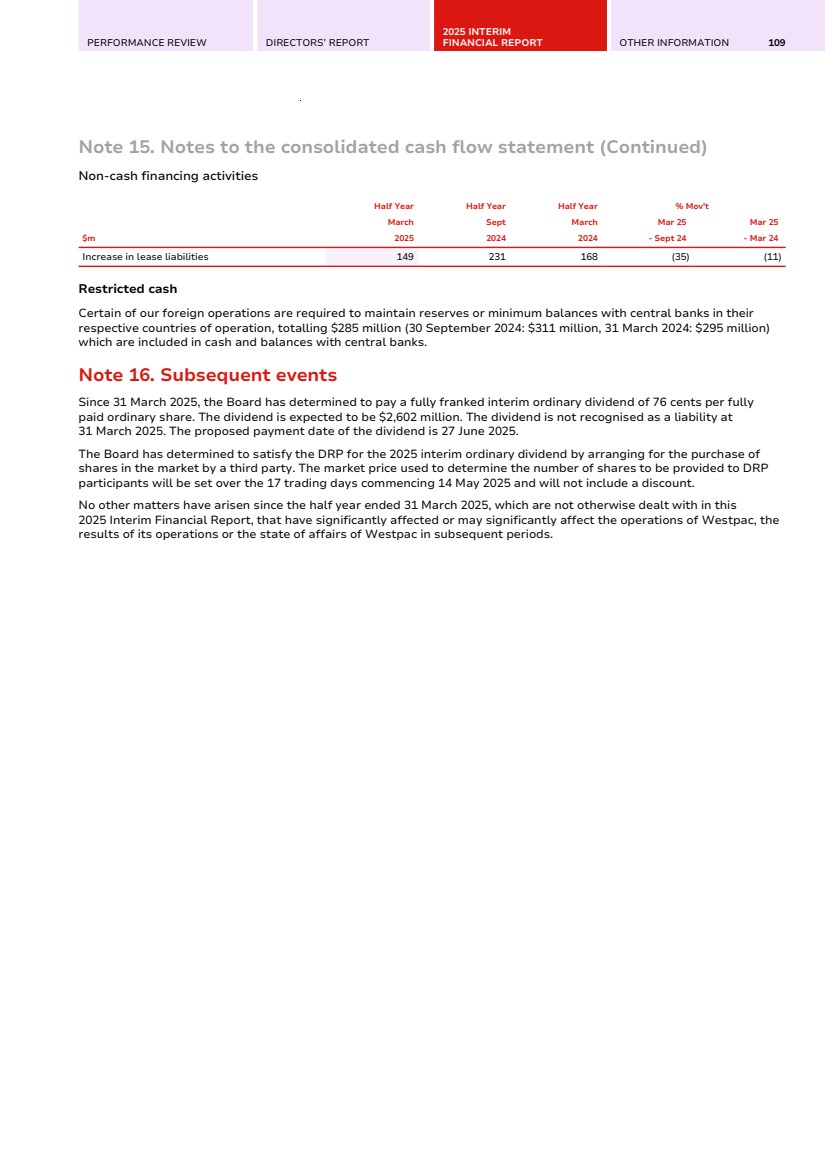
| 110 WESTPAC GROUP 2025 INTERIM FINANCIAL RESULTS STATUTORY STATEMENTS Directors’ declaration In the Directors’ opinion (i) the interim financial statements and notes set out on pages 73- 109 are in accordance with the Corporations Act 2001, including that they: (a) comply with Australian Accounting Standards, the Corporations Regulations 2001 and other mandatory professional reporting requirements; and (b) give a true and fair view of the Group’s financial position as at 31 March 2025 and of its performance for the six months ended 31 March 2025; and (ii) there are reasonable grounds to believe that Westpac will be able to pay its debts as and when they become due and payable. This declaration is made in accordance with a resolution of the Directors. For and on behalf of the Board Steven Gregg Chairman Anthony Miller Managing Director and Chief Executive Officer Sydney, Australia 4 May 2025 |
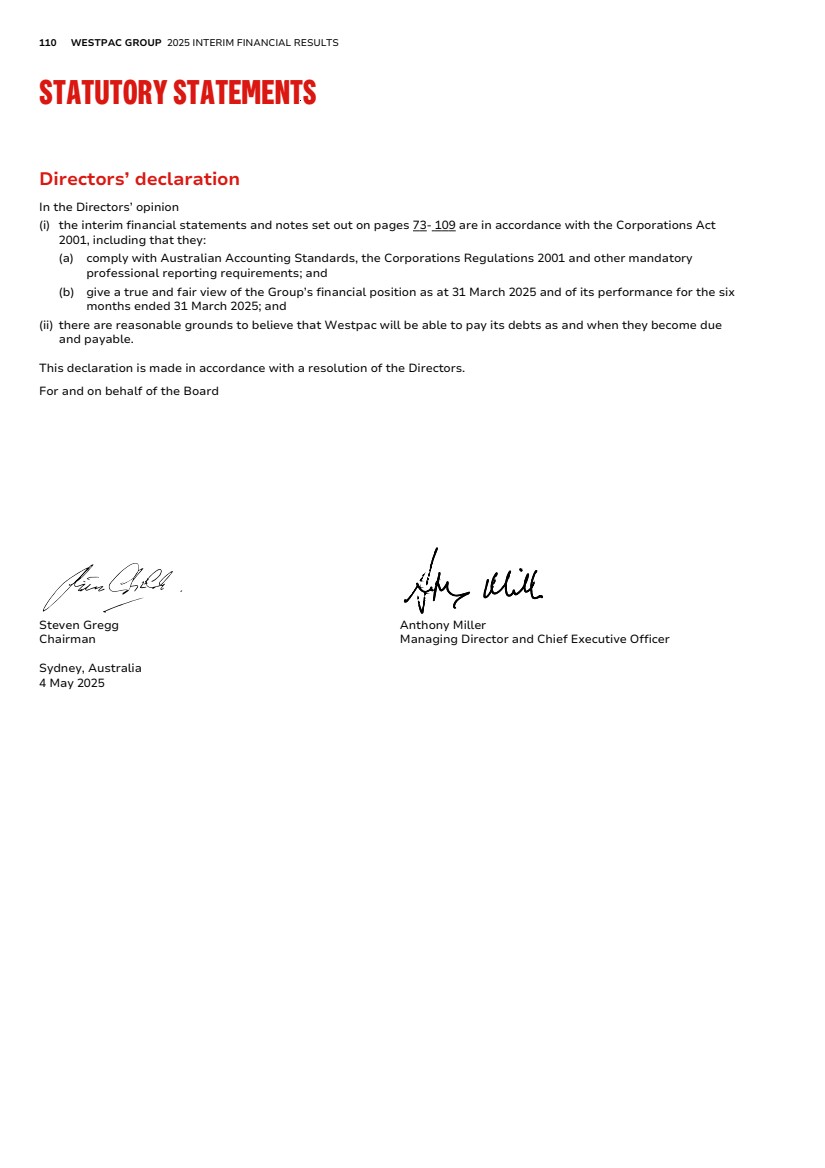
| KPMG, an Australian partnership and a member firm of the KPMG global organisation of independent member firms affiliated with KPMG International Limited, a private English company limited by guarantee. All rights reserved. The KPMG name and logo are trademarks used under license by the independent member firms of the KPMG global organisation. Liability limited by a scheme approved under Professional Standards Legislation. Independent Auditor’s Review Report To the shareholders of Westpac Banking Corporation Conclusion We have reviewed the accompanying Interim Financial Report of Westpac Banking Corporation. Based on our review, which is not an audit, we have not become aware of any matter that makes us believe that the Interim Financial Report of Westpac Banking Corporation does not comply with the Corporations Act 2001, including: • giving a true and fair view of the Group’s financial position as at 31 March 2025 and of its performance for the half year ended on that date; and • complying with Australian Accounting Standard AASB 134 Interim Financial Reporting and the Corporations Regulations 2001 . The Interim Financial Report comprises: • Consolidated balance sheet as at 31 March 2025 • Consolidated income statement, Consolidated statement of comprehensive income, Consolidated statement of changes in equity and Consolidated cash flow statement for the half year ended on that date • Notes 1 to 16 comprising material accounting policies and other explanatory information • The Directors’ Declaration. The Group comprises Westpac Banking Corporation (the Company) and the entities it controlled at the half year’s end or from time to time during the half year. Basis for Conclusion We conducted our review in accordance with ASRE 2410 Review of a Financial Report Performed by the Independent Auditor of the Entity and ISRE 2410 Review of Interim Financial Information performed by the Independent Auditor of the Entity. Our responsibilities are further described in the Auditor’s Responsibilities for the Review of the Financial Report section of our report. We are independent of the Group in accordance with the auditor independence requirements of the Corporations Act 2001 and the ethical requirements of the Accounting Professional and Ethical Standards Board’s APES 110 Code of Ethics for Professional Accountants (including Independence Standards) (the Code) that are relevant to our audit of the annual financial report in Australia. We have also fulfilled our other ethical responsibilities in accordance with these requirements. PERFORMANCE REVIEW DIRECTORS’ REPORT 2025 INTERIM FINANCIAL REPORT OTHER INFORMATION 111 |
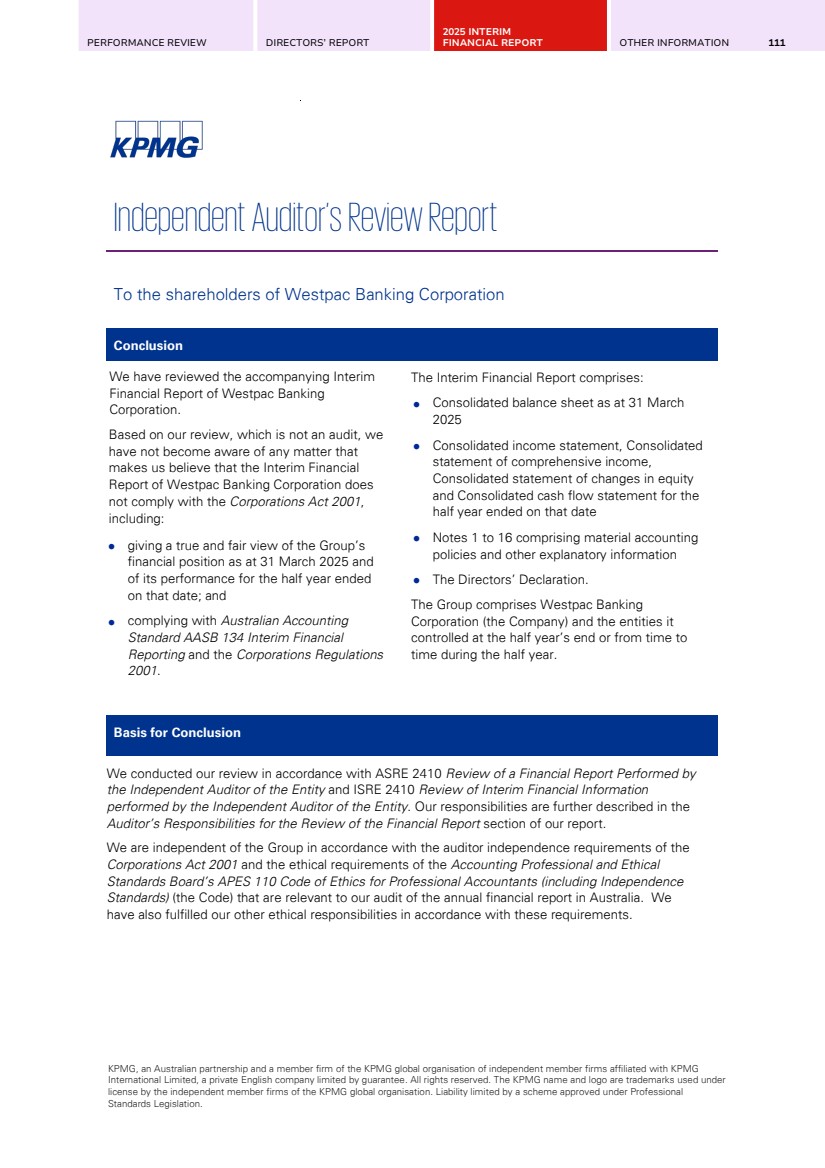
| Responsibilities of the Directors for the Interim Financial Report The Directors of the Company are responsible for: • the preparation of the Interim Financial Report that gives a true and fair view in accordance with Australian Accounting Standards and the Corporations Act 2001 • such internal control as the Directors determine is necessary to enable the preparation of the Interim Financial Report that gives a true and fair view and is free from material misstatement, whether due to fraud or error. Auditor’s Responsibilities for the Review of the Interim Financial Report Our responsibility is to express a conclusion on the Interim Financial Report based on our review. ASRE 2410 and ISRE 2410 require us to conclude whether we have become aware of any matter that makes us believe that the Interim Financial Report does not comply with the Corporations Act 2001 including giving a true and fair view of the Group’s financial position as at 31 March 2025 and its performance for the half year ended on that date, and complying with Australian Accounting Standard AASB 134 Interim Financial Reporting and the Corporations Regulations 2001. A review of an interim period financial report consists of making enquiries, primarily of persons responsible for financial and accounting matters, and applying analytical and other review procedures. A review is substantially less in scope than an audit conducted in accordance with Australian Auditing Standards and consequently does not enable us to obtain assurance that we would become aware of all significant matters that might be identified in an audit. Accordingly, we do not express an audit opinion. KPMG Kim Lawry Partner Sydney 4 May 2025 112 WESTPAC GROUP 2025 INTERIM FINANCIAL RESULTS STATUTORY STATEMENTS |
| PERFORMANCE REVIEW DIRECTORS’ REPORT 2025 INTERIM FINANCIAL REPORT OTHER INFORMATION 113 OTHER INFORMATION OTHER INFORMATION Disclosure regarding forward-looking statements References to websites and other reports Credit ratings Dividend reinvestment plan Information on related entities Financial calendar and Share Registry details Exchange Rates Additional information for Non-AAS financial measures GLOSSARY |

| 114 WESTPAC GROUP 2025 INTERIM FINANCIAL RESULTS OTHER INFORMATION Disclosure regarding forward-looking statements This Results Announcement contains statements that constitute ‘forward-looking statements’ within the meaning of Section 21E of the US Securities Exchange Act of 1934. Forward-looking statements are statements that are not historical facts. Forward-looking statements appear in a number of places in this Results Announcement and include statements regarding our current intent, belief or expectations with respect to our business and operations, macro and micro economic and market conditions, results of operations and financial condition and performance, capital adequacy and liquidity and risk management, including, without limitation, future loan loss provisions and financial support to certain borrowers, forecasted economic indicators and performance metric outcomes, indicative drivers, climate- and other sustainability-related statements, commitments, targets, projections and metrics, and other estimated and proxy data. Words such as ‘will’, ‘may’, ‘expect’, ‘intend’, ‘seek’, ‘would’, ‘should’, ‘could’, ‘continue’, ‘plan’, ‘estimate’, ‘anticipate’, ‘believe’, ‘probability’, ‘indicative’, ‘risk’, ‘aim’, ‘outlook’, ‘forecast’, ‘assumption’, ‘projection’, ‘target’, ‘goal’, ‘guidance’, ‘objective’, ‘ambition’ or other similar words, are used to identify forward-looking statements. These statements reflect our current views on future events and are subject to change, certain known and unknown risks, uncertainties and assumptions and other factors which are, in many instances, beyond our control (and the control of our officers, employees, agents, and advisors), and have been made based on management’s and/or the Board's current expectations or beliefs concerning future developments and their potential effect upon Westpac. Forward-looking statements may also be made, verbally or in writing, by members of Westpac’s management or Board in connection with this Results Announcement. Such statements are subject to the same limitations, uncertainties, assumptions and disclaimers set out in this document. There can be no assurance that future developments or performance will align with our expectations or that the effect of future developments on us will be those anticipated. Actual results could differ materially from those we expect or which are expressed or implied in forward-looking statements, depending on various factors including, but not limited to: • information security breaches, including cyberattacks • geopolitical events, conflicts, trade tensions (including the adoption of protectionist trade measures (including tariffs) or sanctions) or other changes in countries in which Westpac, its customers or suppliers operate • the effect of, and changes in, laws, regulations, policies, supervisory activities, regulator expectations and industry codes of practice • actual or alleged failure to comply with laws, regulations or regulatory policy • the effectiveness of our risk management, including our framework, policies, processes, practices, governance, accountability and culture • the reliability and security of Westpac’s technology and risks associated with changes to technology systems that we use or are used in connection with our business • climate-related risks (including physical, transition and liability risks) that may arise from changing climate patterns, and risks associated with the transition to a lower carbon economy (including Westpac’s ambition to become a net-zero, climate resilient bank) or risks from legal and regulatory action, or risks from other sustainability factors such as human rights and natural capital • the failure to comply with financial crime obligations (including anti-money laundering and counter-terrorism financing laws, anti-bribery and corruption laws, sanctions laws and tax transparency laws) • internal and external events which may adversely impact our reputation • litigation and other legal proceedings and regulator investigations and enforcement actions (including the liability of Westpac to pay significant monetary settlements and legal costs in order to resolve a dispute) • adverse funding market conditions including market volatility, disruptions and decreased liquidity • inadequate capital levels • material downturn or shock to the economies of Australia or New Zealand, or a slowdown in economic growth or change in policy settings of Australia’s major trading partners • declines in asset markets or an increase in impairments and provisioning • sovereign risks • failure to maintain our credit ratings • the effects of market competition and competition regulatory policy impacting the areas in which we operate • operational risks resulting from inadequate or failed internal processes, people and systems or from external events • market risk resulting from changes in market factors, such as foreign exchange rates, commodity prices, equity prices, credit spreads and interest rates • poor data quality, data availability, data controls, data retention or data destruction • evaluation and implementation of strategic decisions, priorities and objectives including to simplify, streamline, diversify, innovate, separate, divest, retain, acquire, invest and integrate • failure to recruit and retain key executives, employees and Directors |
| PERFORMANCE REVIEW DIRECTORS’ REPORT 2025 INTERIM FINANCIAL REPORT OTHER INFORMATION 115 Disclosure regarding forward-looking statements (Continued) • changes to our critical accounting assumptions and estimates; and • various other factors including those beyond Westpac’s control. The above list is not exhaustive. For certain other factors that may impact on forward-looking statements made by Westpac, refer to Risk Management (page 40) of the 2024 Annual Report and Risk Factors (pages 57-70) in this Results Announcement. When relying on forward-looking statements to make decisions with respect to Westpac, investors and others relying on information in this Results Announcement should carefully consider the foregoing factors and other uncertainties and events. Except as required by law, we assume no obligation to revise or update any forward-looking statements in this Results Announcement, whether from new information, future events, conditions, or otherwise, after the date of this Results Announcement. Further important information regarding climate change and sustainability-related statements This Results Announcement contains forward-looking statements and other representations relating to ESG topics, including but not limited to climate change, net zero, climate resilience, natural capital, emissions intensity, human rights and other sustainability-related statements, commitments, targets, projections, scenarios, risk and opportunity assessments, pathways, forecasts, estimated projections and other proxy data. These are subject to known and unknown risks, and there are significant uncertainties, limitations, risks and assumptions in the metrics and modelling on which these statements rely. In particular, the metrics, methodologies and data relating to climate and sustainability are rapidly evolving and maturing, including variations in approaches and common standards in estimating and calculating emissions, and uncertainty around future climate- and sustainability-related policy and legislation. There are inherent limits in the current scientific understanding of climate change and its impacts. Some material contained in this Results Announcement may include information including, without limitation, methodologies, modelling, scenarios, reports, benchmarks, tools and data, derived from publicly available or government or industry sources that have not been independently verified. No representation or warranty is made as to the accuracy, completeness or reliability of such information. There is a risk that the estimates, judgements, assumptions, views, models, scenarios or projections used by Westpac may turn out to be incorrect. These risks may cause actual outcomes, including the ability to meet commitments and targets, to differ materially from those expressed or implied in this Results Announcement. The climate- and sustainability-related forward-looking statements made in this Results Announcement are not guarantees or predictions of future performance and Westpac gives no representation, warranty or assurance (including as to the quality, accuracy or completeness of these statements), nor guarantee that the occurrence of the events expressed or implied in any forward-looking statement will occur. There are usually differences between forecast and actual results because events and actual circumstances frequently do not occur as forecast and these differences may be material. Westpac will continue to review and develop its approach to ESG as this subject area matures. References to websites and other reports Information contained in or accessible through the websites or other reports mentioned in this Results Announcement does not form part of this Results Announcement unless we specifically state that it is incorporated by reference and forms part of this Results Announcement. All references in this Results Announcement to websites are inactive textual references and are for information only. Credit ratings1 Rating agency Short Term Long Term Outlook Fitch Ratings F1+ AA- Stable Moody's Ratings P-1 Aa2 Stable S&P Global Ratings A-1+ AA- Stable 1. As at 31 March 2025. |
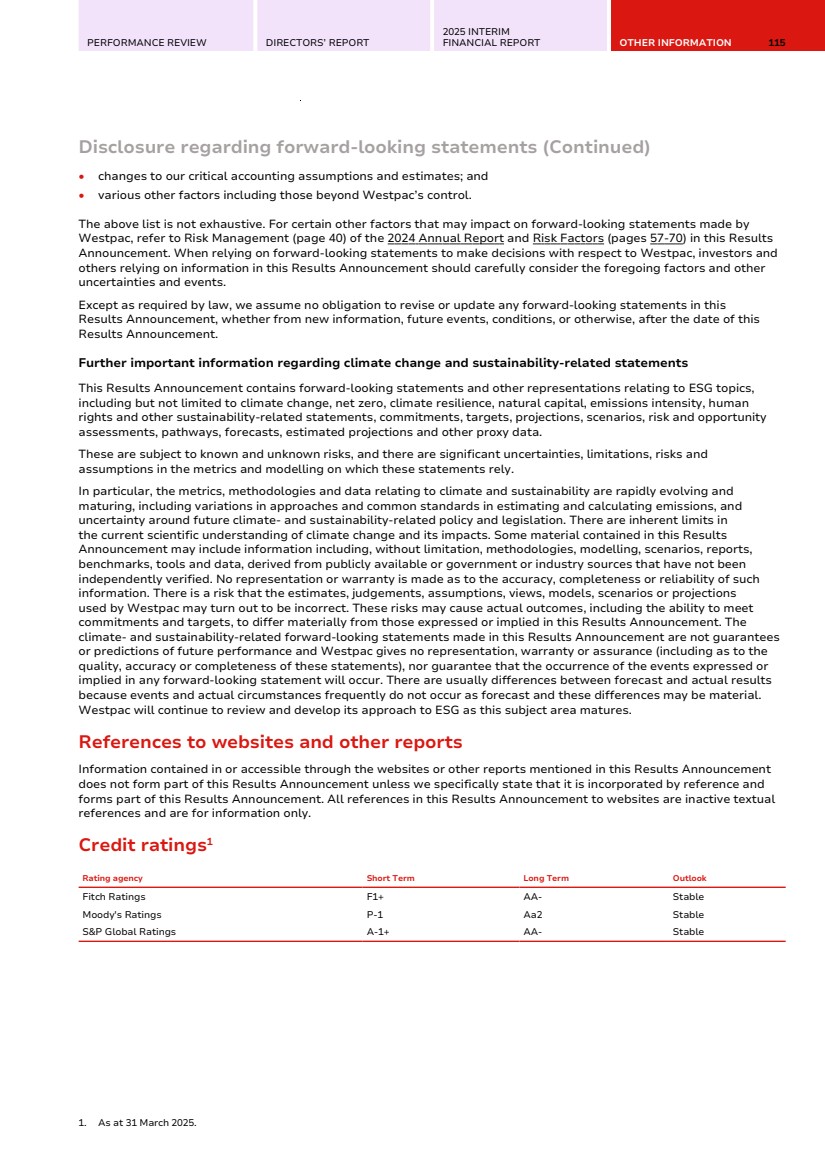
| 116 WESTPAC GROUP 2025 INTERIM FINANCIAL RESULTS OTHER INFORMATION Dividend reinvestment plan The Board has determined a fully franked 2025 interim ordinary dividend of 76 cents per share to be paid on 27 June 2025 to shareholders on the register at the record date of 9 May 2025. Westpac operates a DRP that is available to holders of fully paid ordinary shares who are resident in, or whose address on the register of shareholders is in Australia or New Zealand. Shareholders can choose to receive their 2025 interim ordinary dividend as cash or reinvest it in additional shares under the DRP. As noted in Capital and Dividends (pages 28-32), the Board has made certain determinations in relation to the DRP, including that the DRP will apply for the 2025 interim ordinary dividend and will be satisfied by arranging for the purchase of shares in the market by a third party. The market price used to determine the number of shares to be provided to DRP participants will be set over the 17 trading days commencing 14 May 2025 and will not include a discount. Shareholders who wish to commence participation in the DRP, or to vary their current participation election, must do so by 5.00pm (Sydney time) on 12 May 2025 Shareholders can provide these instructions: • Online for shareholders with holdings that have a market value of less than $1,000,000 within their MUFG Corporate Markets portfolio, by logging into or creating a Portfolio via the Westpac share registry’s website at au.investorcentre.mpms.mufg.com and electing the DRP or amending their existing instructions online; or • By completing and returning a DRP application or variation form to Westpac’s share registry. Registry contact details are listed in Section Financial calendar and Share Registry details (pages 117-120). Information on related entities a. Changes in control of Group entities During the six months ended 31 March 2025 the following controlled entities were acquired, formed, or incorporated: • Series 2024-2 WST Trust (formed 4 October 2024) During the six months ended 31 March 2025 the following controlled entities ceased to be controlled: • Asgard Wealth Solutions Pty Limited (deregistered 3 November 2024) • Series 2014-2 WST Trust (terminated 3 March 2025) b. Associates As at 31 March 2025 Ownership Interest Held (%) Akahu Technologies Ltd 34.5% OpenAgent Pty Ltd 22.6% mx51 Group Pty Ltd 22.2% Lawpath Holdings Pty Ltd 15.1% Safe Will Pty Ltd 12.6% |
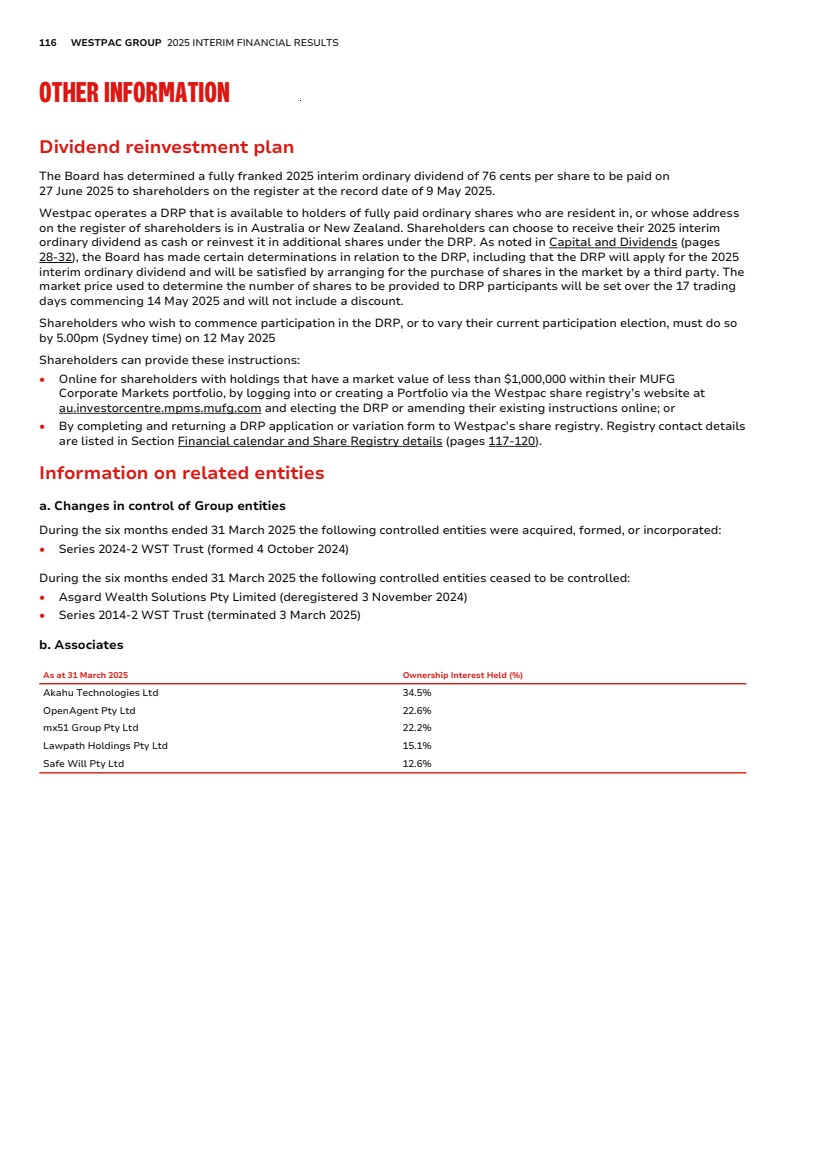
| PERFORMANCE REVIEW DIRECTORS’ REPORT 2025 INTERIM FINANCIAL REPORT OTHER INFORMATION 117 Financial calendar and Share Registry details Westpac shares are listed on the securities exchanges in Australia (ASX) and New Zealand (NZX). Westpac Capital Notes 5, Westpac Capital Notes 7, Westpac Capital Notes 8, Westpac Capital Notes 9 and Westpac Capital Notes 10 are listed on the ASX. Important dates to note are set out below, subject to change. Payment of any distribution, dividend or interest payment is subject to the relevant payment conditions and the key dates for each payment will be confirmed to the ASX for securities listed on the ASX. Westpac Ordinary Shares (ASX code: WBC, NZX code: WBC) Interim results and dividend announcement 5 May 2025 Ex-dividend date for interim dividend 8 May 2025 Record date for interim dividend 9 May 2025 Interim dividend payable 27 June 2025 Financial Year end 30 September 2025 Closing date for receipt of director nominations before Annual General Meeting 23 October 2025 Final results and dividend announcement 3 November 2025 Ex-dividend date for final dividend 6 November 2025 Record date for final dividend 7 November 2025 Annual General Meeting 11 December 2025a Final dividend payable 19 December 2025 a. Details regarding the location of the meeting and the business to be dealt with will be contained in a Notice of Meeting sent to shareholders in the November before the meeting. Westpac Capital Notes 5 (ASX code: WBCPH) Ex-date for quarterly distribution 12 June 2025 Record date for quarterly distribution 13 June 2025a Payment date for quarterly distribution 23 June 2025b Ex-date for quarterly distribution 11 September 2025 Record date for quarterly distribution 12 September 2025a Payment date for quarterly distribution 22 September 2025 Ex-date for quarterly distribution 11 December 2025 Record date for quarterly distribution 12 December 2025a Payment date for quarterly distribution 22 December 2025 a. Adjusted to immediately preceding business day as record date falls on a non-ASX business day or a date on which banks are not open for general business in Sydney. b. Adjusted to next business day as payment date falls on a non-ASX business day or a date on which banks are not open for general business in Sydney. |
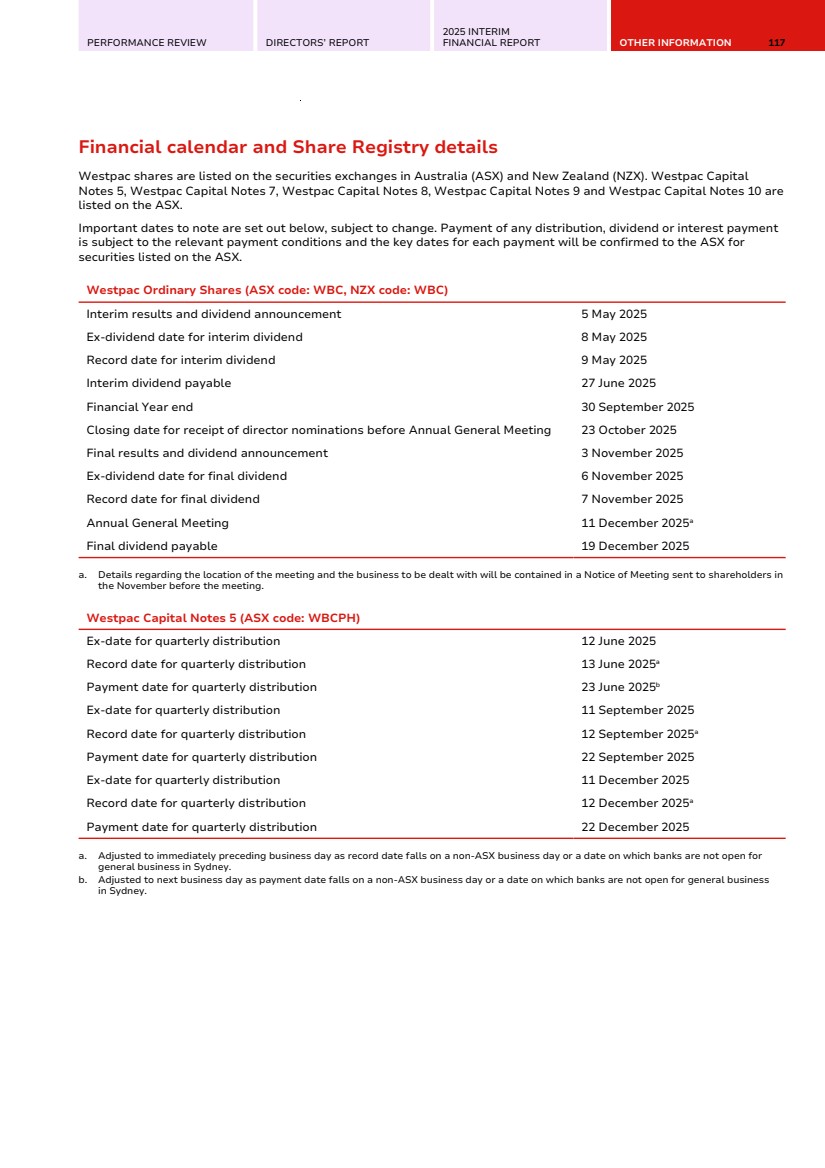
| 118 WESTPAC GROUP 2025 INTERIM FINANCIAL RESULTS OTHER INFORMATION Financial calendar and Share Registry details (Continued) Westpac Capital Notes 7 (ASX code: WBCPJ) Ex-date for quarterly distribution 12 June 2025 Record date for quarterly distribution 13 June 2025a Payment date for quarterly distribution 23 June 2025b Ex-date for quarterly distribution 11 September 2025 Record date for quarterly distribution 12 September 2025a Payment date for quarterly distribution 22 September 2025 Ex-date for quarterly distribution 11 December 2025 Record date for quarterly distribution 12 December 2025a Payment date for quarterly distribution 22 December 2025 a. Adjusted to immediately preceding business day as record date falls on a non-ASX business day or a date on which banks are not open for general business in Sydney. b. Adjusted to next business day as payment date falls on a non-ASX business day or a date on which banks are not open for general business in Sydney. Westpac Capital Notes 8 (ASX code: WBCPK) Ex-date for quarterly distribution 12 June 2025 Record date for quarterly distribution 13 June 2025 Payment date for quarterly distribution 23 June 2025a Ex-date for quarterly distribution 11 September 2025 Record date for quarterly distribution 12 September 2025b Payment date for quarterly distribution 22 September 2025a Ex-date for quarterly distribution 11 December 2025 Record date for quarterly distribution 12 December 2025b Payment date for quarterly distribution 22 December 2025a a. Adjusted to next business day as payment date falls on a non-ASX business day or a date on which banks are not open for general business in Sydney. b. Adjusted to immediately preceding business day as record date falls on a non-ASX business day or a date on which banks are not open for general business in Sydney. Westpac Capital Notes 9 (ASX code: WBCPL) Ex-date for quarterly distribution 12 June 2025 Record date for quarterly distribution 13 June 2025a Payment date for quarterly distribution 23 June 2025b Ex-date for quarterly distribution 11 September 2025 Record date for quarterly distribution 12 September 2025a Payment date for quarterly distribution 22 September 2025 Ex-date for quarterly distribution 11 December 2025 Record date for quarterly distribution 12 December 2025a Payment date for quarterly distribution 22 December 2025 a. Adjusted to immediately preceding business day as record date falls on a non-ASX business day or a date on which banks are not open for general business in Sydney. b. Adjusted to next business day as payment date falls on a non-ASX business day or a date on which banks are not open for general business in Sydney. |
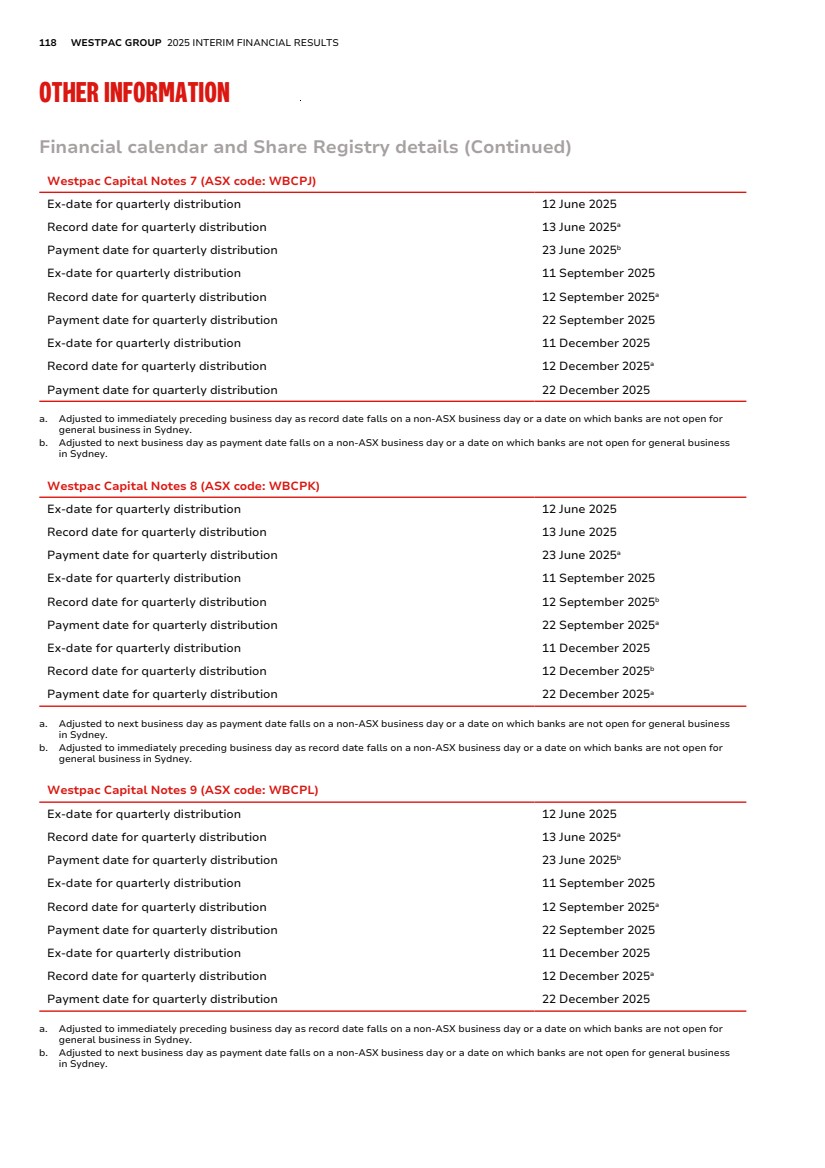
| PERFORMANCE REVIEW DIRECTORS’ REPORT 2025 INTERIM FINANCIAL REPORT OTHER INFORMATION 119 Financial calendar and Share Registry details (Continued) Westpac Capital Notes 10 (ASX code: WBCPM) Ex-date for quarterly distribution 12 June 2025 Record date for quarterly distribution 13 June 2025a Payment date for quarterly distribution 23 June 2025b Ex-date for quarterly distribution 11 September 2025 Record date for quarterly distribution 12 September 2025a Payment date for quarterly distribution 22 September 2025 Ex-date for quarterly distribution 11 December 2025 Record date for quarterly distribution 12 December 2025a Payment date for quarterly distribution 22 December 2025 a. Adjusted to immediately preceding business day as record date falls on a non-ASX business day or a date on which banks are not open for general business in Sydney. b. Adjusted to next business day as payment date falls on a non-ASX business day or a date on which banks are not open for general business in Sydney. |
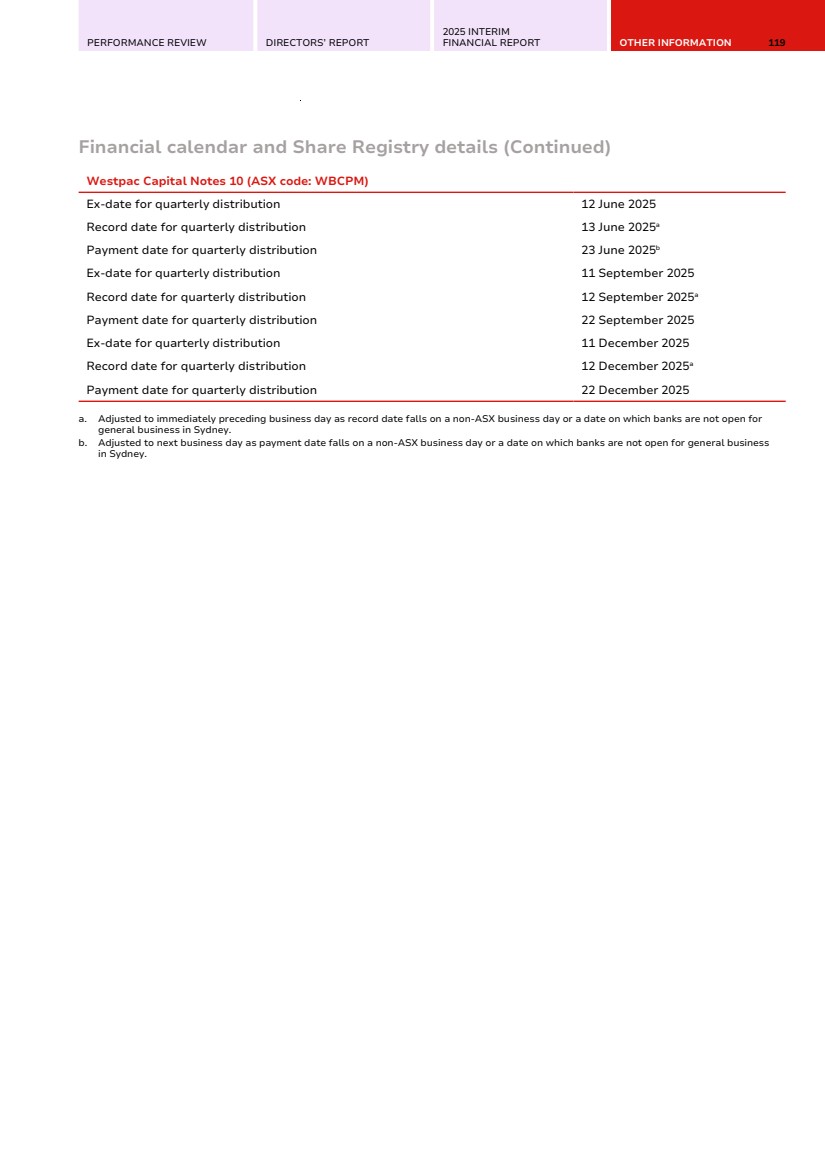
| 120 WESTPAC GROUP 2025 INTERIM FINANCIAL RESULTS OTHER INFORMATION Financial calendar and Share Registry details (Continued) Registered Office and Contact Level 18, 275 Kent Street Sydney NSW 2000 Australia Telephone: +61 2 9155 7713 Fax: +61 2 9055 3575 International Customers: +61 2 9155 7700 Shareholders: +61 1800 804 255 Website: www.westpac.com.au Share Registries Australia Ordinary shares on the main register, Westpac Capital Notes 5, Westpac Capital Notes 7, Westpac Capital Notes 8, Westpac Capital Notes 9, and Westpac Capital Notes 10. MUFG Corporate Markets (AU) Limited Liberty Place Level 41 161 Castlereagh Street Sydney NSW 2000 Australia Postal Address: Locked Bag A6015, Sydney South NSW 1235, Australia Website: au.investorcentre.mpms.mufg.com Email: westpac@cm.mpms.mufg.com Telephone: 1800 804 255 (toll free in Australia) International: +61 1800 804 255 Facsimile: +61 2 9287 0303 New Zealand Ordinary shares on the New Zealand branch register. MUFG Pension & Market Services (NZ) Limited Level 30, PwC Tower 15 Customs Street West Auckland 1010 New Zealand Postal Address: P.O. Box 91976, Auckland 1142, New Zealand Website: nz.investorcentre.mpms.mufg.com Email: enquiries.nz@cm.mpms.mufg.com Telephone: 0800 002 727 (toll free in New Zealand) International: +64 9 375 5998 |
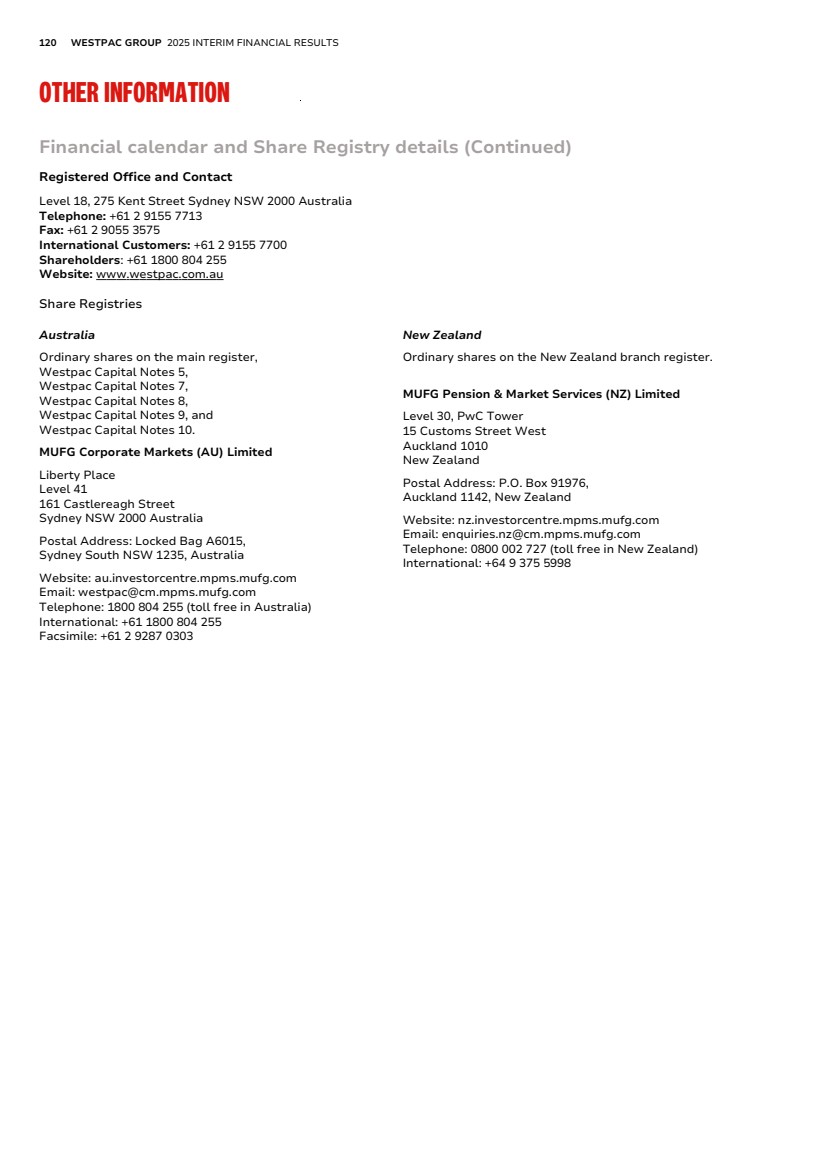
| PERFORMANCE REVIEW DIRECTORS’ REPORT 2025 INTERIM FINANCIAL REPORT OTHER INFORMATION 121 Exchange Rates Exchange rates against A$ Six months to/as at Half Year March 2025 Half Year Sept 2024 Half Year March 2024 Currency Average Spot Average Spot Average Spot US$ 0.6405 0.6284 0.6645 0.6929 0.6542 0.6528 GBP 0.5039 0.4849 0.5187 0.5176 0.5215 0.5167 NZ$ 1.1042 1.1001 1.0932 1.0885 1.0759 1.0892 Impact of exchange rate movements on Group results Half Year March 2025 vs Half Year September 2024 Half Year March 2025 vs Half Year March 2024 FX impact Growth FX impact Growth Growth ($m) ex- FX Growth ($m) ex- FX Net interest income (3%) (12) (3%) 2% (33) 3% Non-interest income 5% 3 5% (1%) - (1%) Net operating income (2%) (9) (2%) 2% (33) 2% Operating expenses 3% 3 3% 6% 14 6% Pre-provision profit (6%) (6) (6%) (2%) (19) (2%) Impairment (charges)/benefits 43% - (70%) (31%) 1 (31%) Profit before income tax expense (8%) (6) (8%) - (18) 1% Income tax expense (7%) 2 (6%) 2% 5 2% Profit after income tax expense (9%) (4) (9%) (1%) (13) - Profit attributable to non-controlling interests (NCI) - - - - - - Net profit attributable to owners of WBC (9%) (4) (9%) (1%) (13) - Exchange rate risk on future NZ$ earnings Westpac’s policy in relation to the hedging of the future earnings of the Westpac’s New Zealand division is to manage the economic risk for volatility of the NZ$ against A$. Westpac manages these flows over a time horizon under which up to 100% of the expected earnings for the following twelve months and 50% of the expected earnings for the subsequent twelve months can be hedged. NZ Future Earnings hedges are only implemented when AUD/NZD is trading at the low end of the range or is expected to move higher over the next 6 months. As at 31 March 2025, Westpac has hedges in place covering 3 months of forecasts up to June 2025, for NZD 292 million, with an average all-in rate of NZ$1.1026. Additional information for Non-AAS financial measures Calculation of Non-AAS financial measures Details of the calculation of non-AAS financial measures not disclosed elsewhere are provided below: Expense to income ratio (excluding Notable Items) Half Year Half Year Half Year March Sept March $m 2025 2024 2024 Operating expenses 5,698 5,549 5,395 less: Notable Items (operating expenses) - - - Operating expenses excluding Notable Items 5,698 5,549 5,395 Net operating income 10,793 10,998 10,590 Add/(less): Notable Items (net interest income) 218 (61) 224 Add/(less): Notable Items (non-interest income) (18) 10 2 Net operating income excluding Notable Items 10,993 10,947 10,816 Expense to income ratio (excluding Notable Items) 51.83% 50.69% 49.88% |
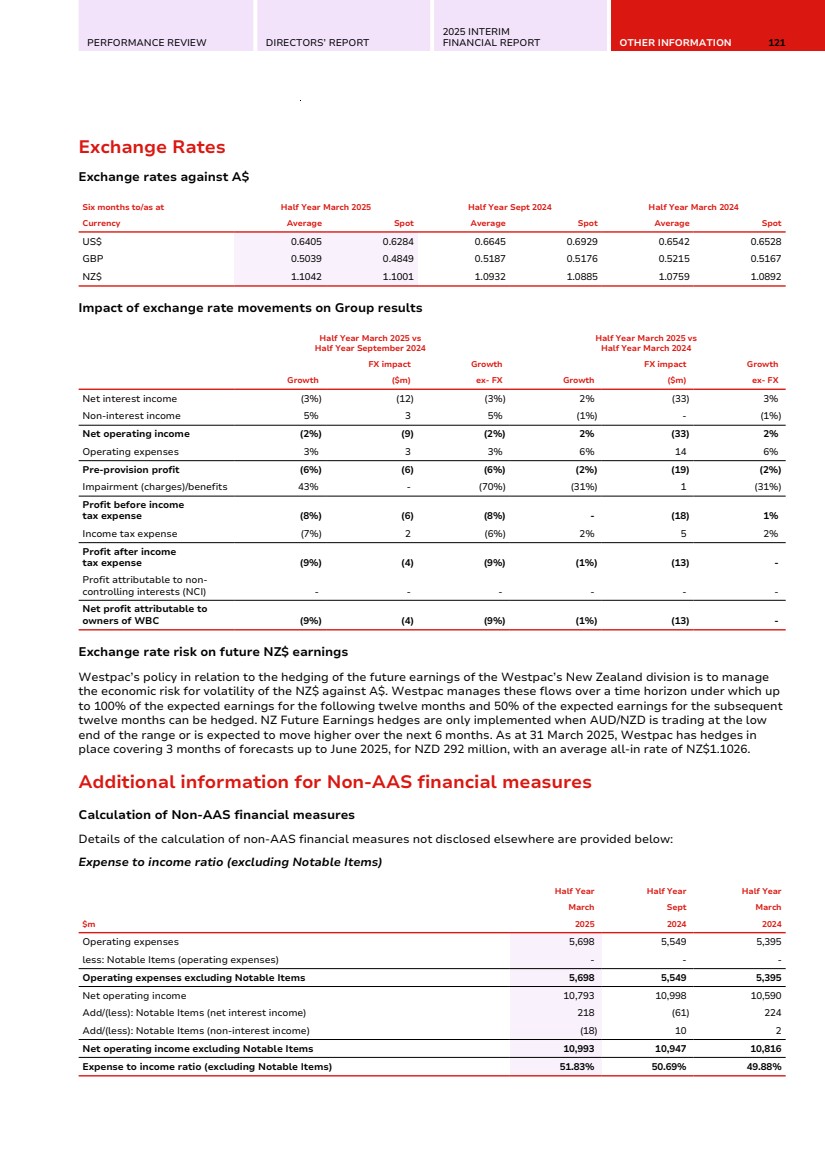
| 122 WESTPAC GROUP 2025 INTERIM FINANCIAL RESULTS OTHER INFORMATION Additional information for Non-AAS financial measures (Continued) Average tangible ordinary equity and Return on average tangible ordinary equity (ROTE) Half Year Half Year Half Year March Sept March $m 2025 2024 2024 Net profit attributable to owners of WBC (adjusted for RSP dividends)a 3,314 3,643 3,340 Average ordinary equity 70,584 71,145 71,841 less: Intangible assets (average) (10,646) (10,698) (10,818) add: Computer software (average) 2,581 2,630 2,730 Average tangible ordinary equity 62,519 63,077 63,753 Return on average tangible ordinary equity (ROTE) 10.63% 11.55% 10.48% a. See Note 7 (page 89) to the financial statements for calculations of this profit measure. Net profit attributable to owners of WBC (adjusted for RSP shares) excluding Notable Items Half Year Half Year Half Year March Sept March $m 2025 2024 2024 Net profit attributable to owners of WBC (adjusted for RSP dividends) 3,314 3,643 3,340 Add/(less): Notable Items (post tax) 140 (41) 164 Net profit attributable to owners of WBC (adjusted for RSP dividends) excluding Notable Items 3,454 3,602 3,504 ROE (excluding Notable Items) and ROTE (excluding Notable Items) Half Year Half Year Half Year March Sept March $m 2025 2024 2024 Net profit attributable to owners of WBC (adjusted for RSP dividends) excluding Notable Items 3,454 3,602 3,504 Average ordinary equity 70,584 71,145 71,841 Average tangible ordinary equity 62,519 63,077 63,753 Return on average ordinary equity (excluding Notable Items) 9.81% 10.13% 9.75% Return on average tangible ordinary equity (excluding Notable Items) 11.08% 11.42% 10.99% Pre-provision profit Half Year Half Year Half Year March Sept March $m 2025 2024 2024 Net interest income 9,351 9,626 9,127 Non-interest income 1,442 1,372 1,463 Operating expenses (5,698) (5,549) (5,395) Pre-provision profit 5,095 5,449 5,195 |
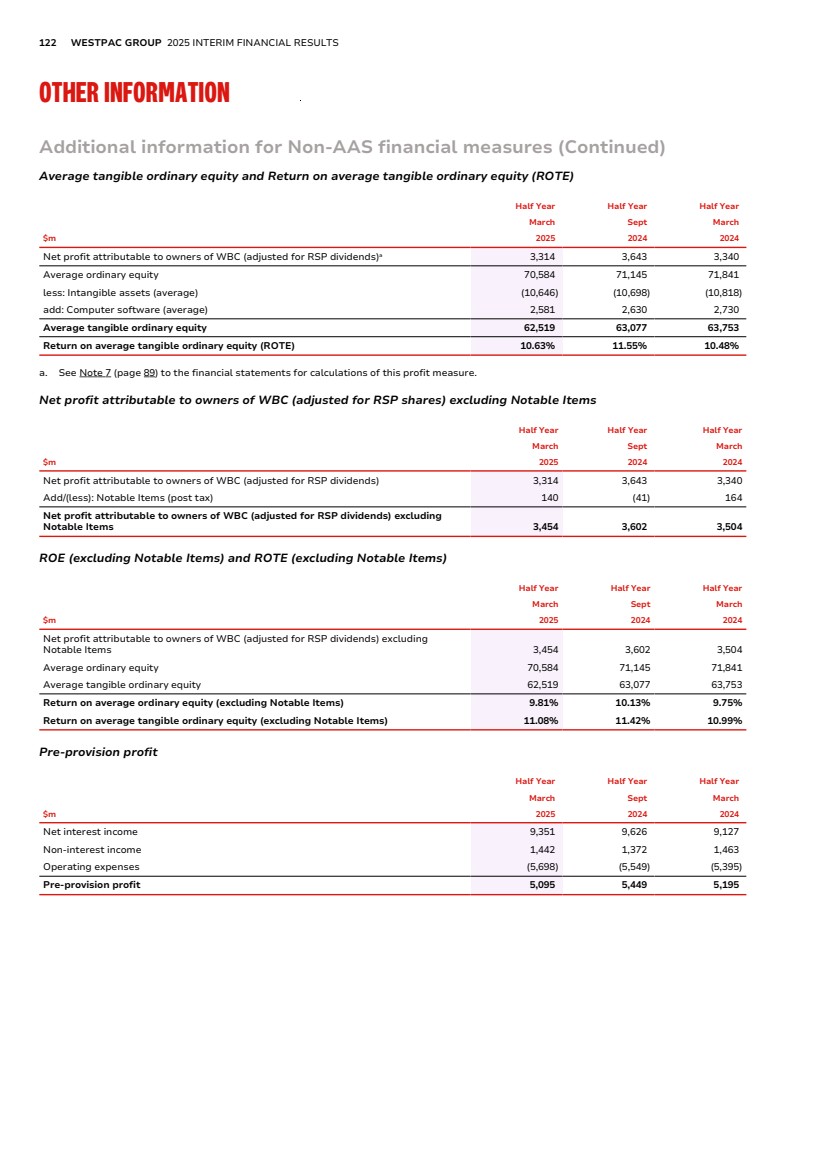
| PERFORMANCE REVIEW DIRECTORS’ REPORT 2025 INTERIM FINANCIAL REPORT OTHER INFORMATION 123 Additional information for Non-AAS financial measures (Continued) Dividend payout ratio (excluding Notable Items) Half Year Half Year Half Year March Sept March $m 2025 2024 2024 Ordinary dividend paid/declared on issued shares (net of Treasury shares) 2,598 2,608 2,600 divided by: Net profit attributable to owners of WBC (adjusted for RSP dividends) excluding Notable Items 3,454 3,602 3,504 Dividend payout ratio (excluding Notable Items)a 75.22% 72.41% 74.19% a. Dividend used in calculation not subjected to rounding. Segment pre-provision profit excluding Notable Items Consumer Business & Wealth Westpac Institutional Bank Westpac New Zealand $m (A$) Group Businesses Group Half Year March 2025 Pre-provision profit/(loss) 1,712 1,725 1,005 691 (38) 5,095 add/(less): Notable Items - - - 1 199 200 Pre-provision profit/(loss) excluding Notable Items 1,712 1,725 1,005 692 161 5,295 Half Year Sept 2024 Pre-provision profit/(loss) 1,712 1,741 993 734 269 5,449 add/(less): Notable Items - - - 2 (53) (51) Pre-provision profit/(loss) excluding Notable Items 1,712 1,741 993 736 216 5,398 Half Year March 2024 Pre-provision profit/(loss) 1,661 1,769 1,047 641 77 5,195 add/(less): Notable Items - - - 6 220 226 Pre-provision profit/(loss) excluding Notable Items 1,661 1,769 1,047 647 297 5,421 Earnings per ordinary share (ex Notable Items) Half Year March 2025 Half Year Sept 2024 Half Year March 2024 Basic Diluted Basic Diluted Basic Diluted Net profit attributable to owners of WBC (adjusted for RSP dividends) ($m) 3,314 3,546 3,643 3,889 3,340 3,577 Add/(less): Notable Items ($m) 140 140 (41) (41) 164 164 Adjusted net profit attributable to owners of WBC (adjusted for RSP dividends) (excluding Notable Items) ($m) 3,454 3,686 3,602 3,848 3,504 3,741 Adjusted weighted average number of ordinary shares ($m) 3,428 3,695 3,457 3,794 3,494 3,905 Earnings per ordinary share (excluding Notable Items) (cents) 100.8 99.8 104.2 101.4 100.3 95.8 |
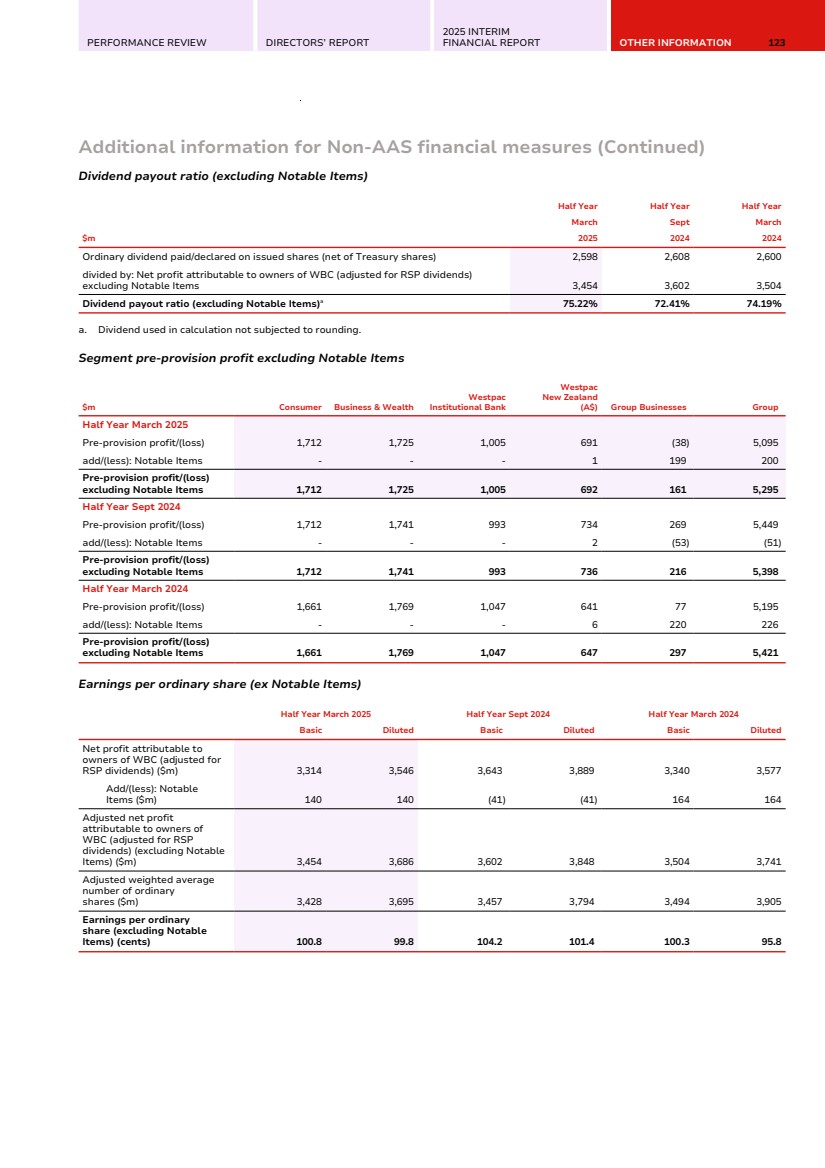
| 124 WESTPAC GROUP 2025 INTERIM FINANCIAL RESULTS GLOSSARY Shareholder value Average ordinary equity Average total equity less average non-controlling interests. Average tangible ordinary equity Average ordinary equity less intangible assets (excluding capitalised software). Average total equity The average balance of shareholders’ equity, including non-controlling interests. Dividend payout ratio Ordinary dividend paid/declared on issued shares (net of Treasury shares) divided by the net profit attributable to owners of WBC (adjusted for RSP dividends) Earnings per ordinary share • Basic earnings per ordinary share is calculated by dividing the net profit attributable to owners of WBC (adjusted for RSP dividends) by the weighted average number of ordinary shares on issue during the period, adjusted for treasury shares. • Diluted earnings per ordinary share is calculated by adjusting the basic earnings per ordinary share by assuming all dilutive potential ordinary shares are converted. Fully franked dividends per ordinary share (cents) Dividends paid out of retained profits which carry a credit for Australian company income tax paid by Westpac. Net tangible assets per share Net tangible assets (total equity less goodwill and other intangible assets less non-controlling interests) divided by the number of ordinary shares on issue (less Treasury shares held). Pre-provision profit Net interest income plus non-interest income less operating expenses. Return on average ordinary equity (ROE) Net profit attributable to the owners of WBC adjusted for RSP dividends (annualised where applicable) divided by average ordinary equity. Return on average tangible ordinary equity (ROTE) Net profit attributable to the owners of WBC adjusted for RSP dividends (annualised where applicable) divided by average tangible ordinary equity. Weighted average ordinary shares Weighted average number of fully paid ordinary shares listed on the Australian Stock Exchange for the relevant period less Westpac shares held by the Group (‘Treasury shares’). Productivity and efficiency Expense to income ratio Operating expenses divided by net operating income. Expense to income ratio (ex Notable Items) Operating expenses excluding Notable Items divided by net operating income excluding Notable Items. Full time equivalent employees (FTE) A calculation based on the number of hours worked by full and part-time employees as part of their normal duties. For example, the full time equivalent of one FTE is 76 hours paid work per fortnight. Revenue per FTE Total operating income divided by the average number of FTE for the period. Business Performance Average Where possible, daily balances are used to calculate the average balance for the period. Average interest bearing liabilities The average balance of liabilities owed by the Group that incur an interest expense. Where possible, daily balances are used to calculate the average balance for the period. Average interest earning assets The average balance of assets held by the Group that generate interest income. Where possible, daily balances are used to calculate the average balance for the period. Core NIM Calculated by dividing net interest income excluding Notable Items and Treasury & Markets (annualised where applicable) by average interest earning assets. Group NIM/Net interest margin Calculated by dividing net interest income (annualised where applicable) by average interest earning assets. Net profit Net profit attributable to owners of WBC. Capital Adequacy Australian Prudential Regulation Authority (APRA) leverage ratio Tier 1 capital divided by ‘exposure measure’ and expressed as a percentage. ‘Exposure measure’ is the sum of on-balance sheet exposures, derivative exposures, securities financing transaction (SFT) exposures and non-market off- balance sheet exposures. AT1 Additional Tier 1 capital Common equity tier 1 (CET1) capital ratio Total common equity capital divided by risk weighted assets, as defined by APRA. Internationally comparable capital ratios Internationally comparable methodology references the ABA study on the comparability of APRA’s capital framework released on 10 March 2023. Risk weighted assets (RWA) Assets (both on and off-balance sheet) are risk weighted according to each asset’s inherent potential for default and what the likely losses would be in case of default. In the case of non-asset backed risks (i.e. market, IRRBB and operational risk), RWA is determined by multiplying the capital requirements for those risks by 12.5. Credit risk weighted assets (Credit RWA) Credit risk weighted assets represent risk weighted assets (on-balance sheet and off-balance sheet) that relate to credit exposures and therefore exclude market risk, operational risk, and interest rate risk in the banking book. Business lending Includes credit exposures not captured elsewhere, and where the borrower’s annual turnover is below $75 million. Corporate Exposures to corporate borrowers that do not fall within the definition of Large Corporate, Property Finance, Specialised Lending, Business Lending or Small Business exposures. Financial institution Includes exposure to entities whose primary dealings relates to management of financial assets, lending, factoring, leasing provision of credit enhancements, securitisation, investments, financial custody, central counter party services and proprietary trading. |
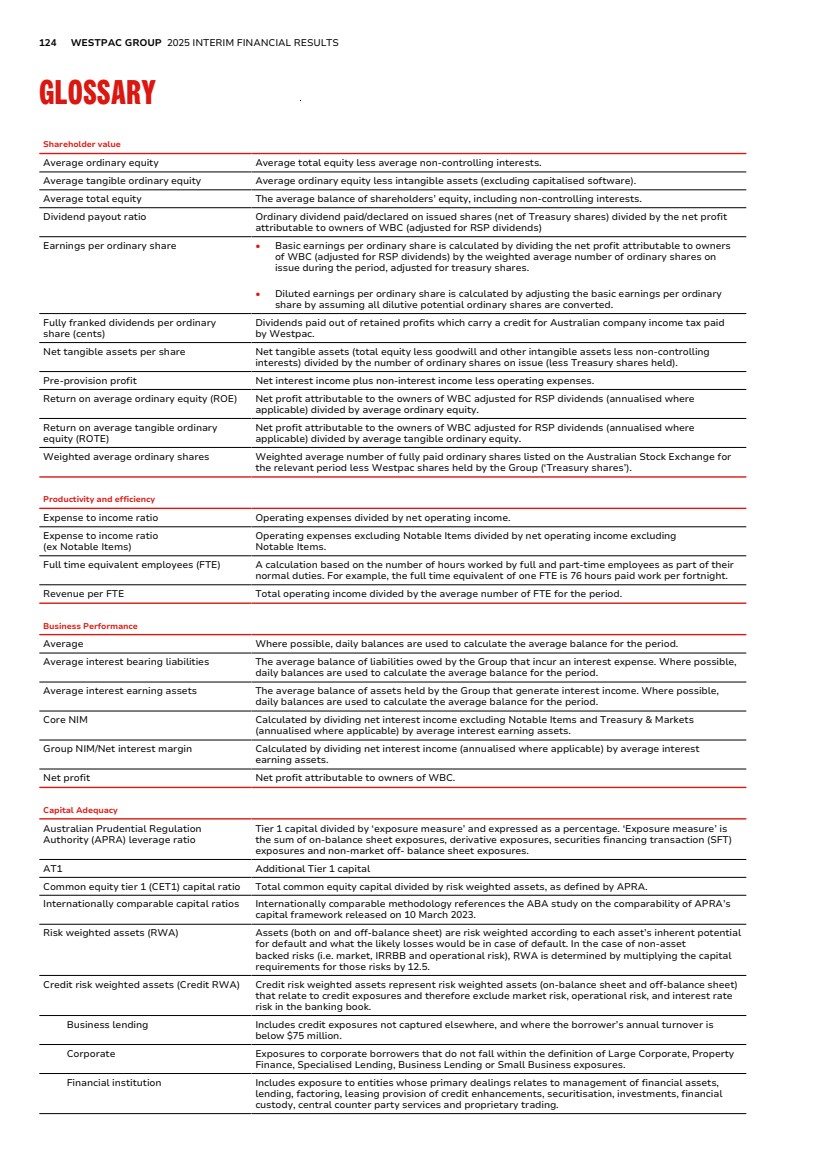
| PERFORMANCE REVIEW DIRECTORS’ REPORT 2025 INTERIM FINANCIAL REPORT OTHER INFORMATION 125 Capital Adequacy Large corporate Exposures to counter parties with consolidated annual revenue (of the counterparty or group that the counter party consolidates into) exceeding $750 million. New Zealand Overseas banking subsidiary regulated by the RBNZ. Property finance Exposures to borrowers where repayments depend primarily on the cash flows generated by the property or other real estate assets owned by the borrower. Securitisation Exposures relating to Westpac’s involvement in securitisation activities range from a seller of its own assets to an investor in third party transactions and include the provision of securitisation services for its clients. Small business Program-managed business exposures typically below $1.5 million in value. Program-managed exposures are managed on a statistical basis according to pre-determined objective criteria. Sovereign Exposures to Australian and overseas central and sub-national governments, and central banks. Specialised lending Includes exposures to project and object finance lending. Project finance and object finance rely primarily on the revenues generated by a project, or equipment asset respectively, both as a source of repayment and as security for the loan. Excludes Property Finance exposures. Operational risk The risk of loss resulting from inadequate or failed internal processes, people and systems or from external events, including legal risk but excluding strategic or reputational risk. Tier 1 capital ratio Total Tier 1 capital divided by risk weighted assets, as defined by APRA. Total regulatory capital ratio Total regulatory capital divided by risk weighted assets, as defined by APRA. Funding and liquidity Deposit to loan ratio Customer deposits divided by net loans. High Quality Liquid Assets (HQLA) Assets which meet APRA’s criteria for inclusion as HQLA in the numerator of the LCR. Liquid assets HQLA and non LCR qualifying liquid assets, but excludes internally securitised assets that are eligible for a repurchase agreement with the RBA and the RBNZ. Liquidity Coverage Ratio (LCR) An APRA requirement to maintain an adequate level of unencumbered high quality liquid assets, to meet liquidity needs for a 30 calendar day period under an APRA-defined severe stress scenario. Absent a situation of financial stress, the value of the LCR must not be less than 100%. LCR is calculated as the percentage ratio of stock of HQLA, and qualifying RBNZ securities over the total net cash out-flows in a modelled 30 day defined stressed scenario. Net Stable Funding Ratio (NSFR) The NSFR is defined as the ratio of the amount of available stable funding (ASF) to the amount of required stable funding (RSF) defined by APRA. The amount of ASF is the portion of an ADI’s capital and liabilities expected to be a reliable source of funds over a one year time horizon. The amount of RSF is a function of the liquidity characteristics and residual maturities of an ADI’s assets and off-balance sheet activities. ADIs must maintain an NSFR of at least 100%. Term Funding Facility (TFF) A facility that was established by the RBA in March 2020 to provide 3 year term funding to Australian ADIs via repurchase transactions, subject to qualifying conditions, to help support lending to Australian businesses. The facility closed to new draw downs in June 2021. Term funding from central banks Term funding from central banks includes the drawn balances of the RBA TFF and the RBNZ Funding Lending Program and Term Lending Facility. Wholesale funding Wholesale funding includes debt issues, loan capital, certificates of deposit, term funding from central banks and interbank placements. Credit quality Collectively assessed provisions (CAPs) Collectively assessed provisions for expected credit loss under AASB 9 represent the Expected Credit Loss (ECL) which is collectively assessed in pools of similar assets with similar risk characteristics. This incorporates forward-looking information and does not require an actual loss event to have occurred for an impairment provision to be recognised. Default Credit exposures that are non-performing. Exposure at default (EAD) The estimated outstanding amount of credit exposure at the time of the default. Gross impaired exposures provisions to gross impaired exposures Impairment provisions relating to impaired exposures include individually assessed provisions plus the proportion of the collectively assessed provisions that relate to impaired exposures. |
| 126 WESTPAC GROUP 2025 INTERIM FINANCIAL RESULTS GLOSSARY Credit quality Impaired exposures Includes exposures that have deteriorated to the point where full collection of interest and principal is in doubt, based on an assessment of the customer’s outlook, cash flow, and the net realisation of value of assets to which recourse is held: • Facilities 90 days or more past due, and full recovery is in doubt: exposures where contractual payments are 90 or more days in arrears and the net realisable value of assets to which recourse is held may not be sufficient to allow full collection of interest and principal, including overdrafts or other revolving facilities that remain continuously outside approved limits by material amounts for 90 or more calendar days; • Non-accrual facilities: exposures with individually assessed impairment provisions held against them, excluding restructured loans; • Restructured facilities: exposures where the original contractual terms have been formally modified to provide for concessions of interest or principal for reasons related to the financial difficulties of the customer; • Other assets acquired through security enforcement (includes other real estate owned): includes the value of any other assets acquired as full or partial settlement of outstanding obligations through the enforcement of security arrangements; or • Any other facilities where the full collection of interest and principal is in doubt. Impairment charges/(benefit) to average loans Calculated as impairment charges (annualised where applicable) divided by average gross loans. Individually assessed provisions (IAPs) Provisions raised for losses on loans that are known to be impaired and are assessed on an individual basis. The estimated losses on these impaired loans is based on expected future cash flows discounted to their present value and, as this discount unwinds, interest will be recognised in the income statement. Loss given default (LGD) The loss that is expected to arise in the event of a default. Non-performing not impaired exposures Includes those credit exposures that are in default, but where it is expected that the full value of principal and accrued interest can be collected, generally by reference to the value of security held. Performing exposures Credit exposures that are not non-performing. Probability of default (PD) The probability that a counter party will default. Provision for expected credit losses (ECL) Expected credit losses (ECL) are a probability-weighted estimate of the cash shortfalls expected to result from defaults over the relevant time frame. They are determined by evaluating a range of possible outcomes and taking into account the time value of money, past events, current conditions and forecasts of future economic conditions. Stage 1: 12 months ECL - performing For financial assets where there has been no significant increase in credit risk since origination a provision for 12 months expected credit losses is recognised. Interest revenue is calculated on the gross carrying amount of the financial asset. Stage 2: Lifetime ECL - performing For financial assets where there has been a significant increase in credit risk since origination but where the asset is still performing a provision for lifetime expected losses is recognised. Interest revenue is calculated on the gross carrying amount of the financial asset. Stage 3: Lifetime ECL - non-performing For financial assets that are non-performing a provision for lifetime expected losses is recognised. Interest revenue is calculated on the carrying amount net of the provision for ECL rather than the gross carrying amount. Stressed exposures Watchlist and substandard credit exposures plus non-performing exposures. Total committed exposure (TCE) Represents the sum of the committed portion of direct lending (including funds placement overall and deposits placed), contingent and pre-settlement risk plus the committed portion of secondary market trading and underwriting risk. Watchlist and substandard Loan facilities where customers are experiencing operating weakness and financial difficulty but are not expected to incur loss of interest or principal. Other AAS Australian Accounting Standards AASB Australian Accounting Standards Board ABA Australian Banking Association ACCC Australian Competition and Consumer Commission ADI Authorised Deposit-taking Institution AFCA Australian Financial Complaints Authority AGM Annual General Meeting AI Artificial intelligence AML Anti-money laundering APRA Australian Prudential Regulation Authority APS Australian Prudential Standard ASIC Australian Securities and Investments Commission ASX Australian Securities Exchange ATM Automated Teller Machine |
| PERFORMANCE REVIEW DIRECTORS’ REPORT 2025 INTERIM FINANCIAL REPORT OTHER INFORMATION 127 Other ATO Australian Taxation Office AUSTRAC Australian Transaction Reports and Analysis Centre BCCC The Banking Code Compliance Committee BPNG Bank of Papua New Guinea (PNG) bps Basis points Credit Valuation Adjustment (CVA) CVA adjusts the fair value of over-the-counter derivatives for credit risk. CVA is employed on the majority of derivative positions and reflects the market view of the counter party credit risk. A Debit Valuation Adjustment is employed to adjust for our own credit risk. Cost Reset Program to deliver sustainable cost reductions. CRS Common reporting standard CTF Counter-terrorism financing Derivative Valuation Adjustment (DVA) DVA includes CVA and FVA. DRP Dividend reinvestment plan D-SIB Domestic systemically important bank ESG Environment, social and governance FATCA Foreign Account Tax Compliance Act FINRA Financial Industry Regulatory Authority First Half 2024 (1H24) Six months ended 31 March 2024 First Half 2025 (1H25) Six months ended 31 March 2025 Funding Valuation Adjustment (FVA) FVA relates to the funding cost or benefit associated with the uncollateralised portion of the derivative portfolio. FVIS Fair value through income statement FVOCI Fair value through other comprehensive income FWO Fair Work Ombudsman FX Foreign exchange IASB International Accounting Standards Board IP Integrated plan IFRS International Financial Reporting Standards IRRBB Interest Rate Risk in the Banking Book NCI Non-controlling interests Non-interest earning /bearing Instruments which do not carry an entitlement to interest. NZBA Net-Zero Banking Alliance OAIC The Office of the Australian Information Commissioner OTC Over the counter Prior corresponding period Refers to the six months ended 31 March 2024 Prior period Refers to the six months ended 30 September 2024 RBA Reserve Bank of Australia RBNZ Reserve Bank of New Zealand RSP Restricted Share Plan Runoff Scheduled and unscheduled repayments and debt repayments (from for example property sales and external refinancing), net of redraws. SEC Securities and Exchange Commission Second Half 2024 Six months ended 30 September 2024. Segment reporting Segment reporting are presented on a management reporting basis. Internal charges and transfer pricing adjustments are included in the performance of each segment reflecting the management structure rather than the legal entity (these results cannot be compared to results for individual legal entities). Where management reporting structures or accounting classifications have changed, financial results for comparative periods have been restated and may differ from results previously reported. Overhead costs are allocated to revenue generating segments. The Group’s internal transfer pricing frameworks facilitate risk transfer, profitability measurement, capital allocation and segment alignment, tailored to the jurisdictions in which the Group operates. Transfer pricing allows the Group to measure the relative contribution of products and segments to the Group’s interest margin and other dimensions of performance. Key components of the Group’s transfer pricing frameworks are funds transfer pricing for interest rate and liquidity risk and allocation of basis and contingent liquidity costs, including capital allocation. SME Small to medium sized enterprises WIB Westpac Institutional Bank WNZL Westpac New Zealand Limited |
| WESTPAC.COM.AU |