Pay vs Performance Disclosure - USD ($)
Feb. 02, 2025
Feb. 04, 2024
Feb. 05, 2023
Feb. 06, 2022
Jan. 31, 2021
Average Summary Compensation Table Total for Non-PEO NEOs (d)($)(3) | Average Compensation Actually Paid to Non-PEO NEOs (e)($)(2) | Value of Initial Fixed $100 Investment Based on: | |||||||||||||||||||||||||||
| Fiscal Year (a) | Summary Compensation Table for PEO (b)($)(1) | Compensation Actually Paid to PEO (c)($)(2) | Total Shareholder Return (f)($) | Peer Group Total Shareholder Return (g)($)(4) | Net Income (Loss) (in thousands) (h)($) | Revenue (in thousands) (i)($) | |||||||||||||||||||||||
| 2025 | 14,054,606 | 45,732,638 | 5,491,828 | 14,660,598 | 381 | 197 | 106,739 | 3,168,164 | |||||||||||||||||||||
| 2024 | 36,650,048 | 40,458,685 | 13,349,070 | 15,151,161 | 237 | 166 | 61,311 | 2,830,621 | |||||||||||||||||||||
| 2023 | 11,284,123 | 15,303,936 | 4,407,257 | 6,151,443 | 168 | 133 | 73,071 | 2,753,434 | |||||||||||||||||||||
| 2022 | 9,794,382 | 14,575,257 | 3,961,982 | 8,732,531 | 148 | 141 | (143,259) | 2,180,848 | |||||||||||||||||||||
| 2021 | 8,081,741 | 14,452,520 | 4,127,981 | 8,083,765 | 130 | 125 | (282,076) | 1,684,179 | |||||||||||||||||||||
| PEO | 2025 ($) | 2024 ($) | 2023 ($) | 2022 ($) | 2021 ($) | |||||||||||||||||||||||||||
| Summary Compensation Table (SCT) Total for PEO (column b) | 14,054,606 | 36,650,048 | 11,284,123 | 9,794,382 | 8,081,741 | |||||||||||||||||||||||||||
| - Amounts reported in the SCT for equity awards (stock awards or options granted in the Covered Year) | 12,143,667 | 35,023,555 | 9,469,212 | 7,735,478 | 6,695,186 | |||||||||||||||||||||||||||
| + Year-end fair value of unvested equity awards granted in the Covered Year | 16,644,140 | 35,540,126 | 9,089,350 | 10,600,618 | 10,386,295 | |||||||||||||||||||||||||||
| + Fair value as of the vesting date for equity awards granted in the Covered Year that vested during the Covered Year | — | — | — | — | — | |||||||||||||||||||||||||||
| +/- Change in fair value as of the end of the Covered Year (compared to the end of the prior fiscal year) for equity awards granted in prior fiscal years which are outstanding and unvested as of the end of the Covered Year | 25,197,687 | 2,963,661 | 2,086,128 | 1,973,507 | 4,319,563 | |||||||||||||||||||||||||||
| +/- Change in fair value as of the vesting dates (compared to the end of the prior fiscal year) for equity awards granted in prior years that vested in the Covered Year | 5,404,235 | 328,405 | 2,313,548 | (57,773) | (1,639,893) | |||||||||||||||||||||||||||
| - Fair value at the end of the prior fiscal year for equity awards granted in prior years that were forfeited during the Covered Year. | 3,424,363 | — | — | — | — | |||||||||||||||||||||||||||
| CAP TO PEO (column c) | 45,732,638 | 40,458,685 | 15,303,936 | 14,575,257 | 14,452,520 | |||||||||||||||||||||||||||
| AVERAGE FOR NON-PEO NEOS | 2025($) | 2024($) | 2023 ($) | 2022 ($) | 2021 ($) | |||||||||||||||||||||||||||
| Summary Compensation Table (SCT) Total for PEO (column b) | 5,491,828 | 13,349,070 | 4,407,257 | 3,961,982 | 4,127,981 | |||||||||||||||||||||||||||
| - Amounts reported in the SCT for equity awards (stock awards or options granted in the Covered Year) | 4,320,343 | 12,258,207 | 3,195,871 | 2,642,954 | 3,050,029 | |||||||||||||||||||||||||||
| + Year-end fair value of unvested equity awards granted in the Covered Year | 5,801,468 | 12,439,033 | 3,067,667 | 6,095,363 | 4,731,534 | |||||||||||||||||||||||||||
| + Fair value as of the vesting date for equity awards granted in the Covered Year that vested during the Covered Year | 106,853 | — | — | — | — | |||||||||||||||||||||||||||
| +/- Change in fair value as of the end of the Covered Year (compared to the end of the prior fiscal year) for equity awards granted in prior fiscal years which are outstanding and unvested as of the end of the Covered Year | 6,589,588 | 1,324,680 | 960,605 | 1,177,864 | 2,172,166 | |||||||||||||||||||||||||||
| +/- Change in fair value as of the vesting dates (compared to the end of the prior fiscal year) for equity awards granted in prior years that vested in the Covered Year | 2,189,752 | 296,584 | 911,786 | 140,277 | 102,112 | |||||||||||||||||||||||||||
| - Fair value at the end of the prior fiscal year for equity awards granted in prior years that were forfeited during the Covered Year. | 1,198,548 | — | — | — | — | |||||||||||||||||||||||||||
| AVERAGE CAP TO NON-PEO NEOs (column e) | 14,660,598 | 15,151,161 | 6,151,443 | 8,732,531 | 8,083,765 | |||||||||||||||||||||||||||
Compensation Actually Paid
vs. Company TSR & Peer Group TSR
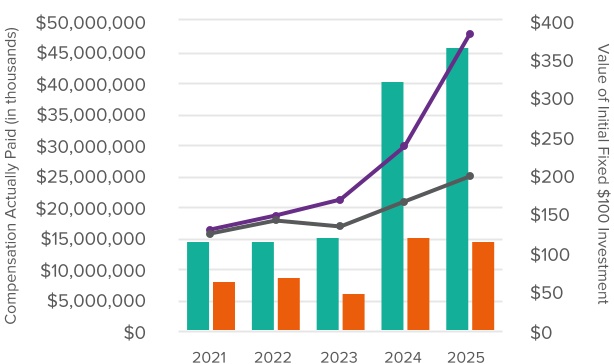
 | PEO CAP |  | Avg Non-PEO CAP |  | Pure Storage TSR |  \ \ | Peer Group TSR | ||||||||||||||||
Compensation Actually Paid
vs. Net Income
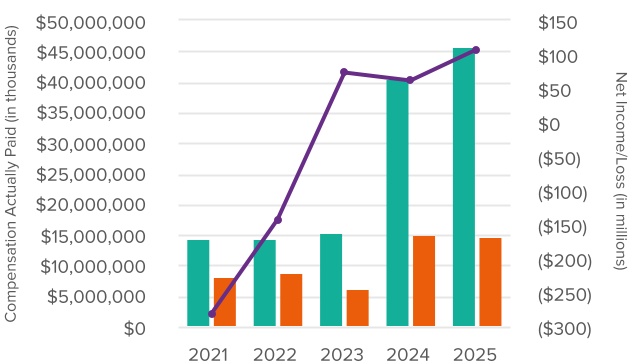
| | PEO CAP | | Avg Non-PEO CAP | | Net Income | ||||||||||||
Compensation Actually Paid
vs. Revenue
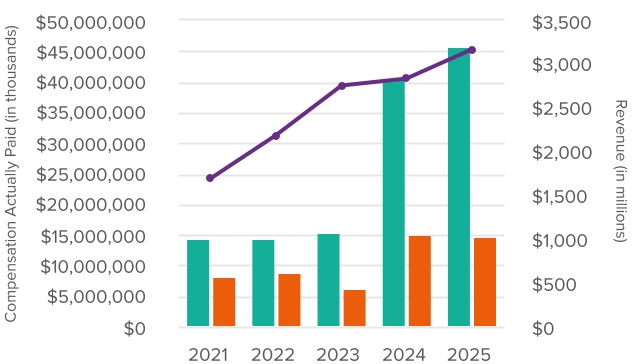
| | PEO CAP | | Avg Non-PEO CAP | | Revenue | ||||||||||||
Compensation Actually Paid
vs. Company TSR & Peer Group TSR
| | PEO CAP | | Avg Non-PEO CAP | | Pure Storage TSR | \ | Peer Group TSR | ||||||||||||||||
Revenue Non-GAAP Operating Profit Subscription Services Revenue Subscription ARR NPS | ||
We are providing the following information about the relationship between executive compensation actually paid (CAP), as defined under Item 402(v) of Regulation S-K, and certain financial performance measures of Pure. For further information concerning Pure’s variable pay-for-performance philosophy and how Pure aligns executive compensation with Pure’s performance, refer to “Executive Compensation – Compensation Discussion and Analysis.”
The Compensation Actually Paid is determined in accordance with Item 402(v) of Regulation S-K. The fair value of stock options was determined using a Black-Scholes model, the fair value of PSUs reflect the probable outcome of the performance vesting conditions as of each measurement date, the fair value of RSUs was based on the stock price on the vesting date, and the fair value of the 5-Year PSU awards was determined using a Monte Carlo simulation model. For each covered year, the values included in column (c) for the CAP to our PEO and in column (e) for the average CAP to our non-PEO named executive officers reflect the adjustments set forth below. Pure does not maintain a pension plan and does not pay dividends on its common stock so no adjustments for these factors were necessary.