Pay Versus Performance
As required by Item 402(v) of Regulation S-K, we are providing the following information about the relationship between executive compensation actually paid (“CAP”) and DIRTT’s financial performance for the periods presented. The CAP dollar amounts shown in the table include the full value of awards in the year in which they are granted as well as the growth in value of equity awards that vest during the year reported or that could potentially vest in future years (“potentially realizable future value”) in addition to base salary and bonus.
The following table discloses information on CAP to our principal executive officer (“PEO”) and, on average, to our Non-PEO NEOs during the specified years alongside TSR and net income/(loss).
Year |
Summary Compensation Table Total for PEO(1) |
|
Compensation Actually Paid to PEO(1) (2) |
|
Average Summary Compensation Table Total for Non-PEO NEOs(1) |
|
Average Compensation Actually Paid to Non-PEO NEOs(1) (2) |
|
Value of Initial Fixed $100 Investment Based On TSR(3) |
|
Value of Initial Fixed $100 Investment Based On S&P SmallCap 600 Materials Index(3) |
|
Net Income / (Loss) $'000 |
|
|||||||
2024 |
$ |
1,337,500 |
|
$ |
1,776,603 |
|
$ |
1,465,789 |
|
$ |
1,916,964 |
|
$ |
156.54 |
|
$ |
118.60 |
|
$ |
14,770 |
|
2023 |
$ |
772,895 |
|
$ |
780,848 |
|
$ |
514,017 |
|
$ |
461,792 |
|
$ |
81.15 |
|
$ |
118.64 |
|
$ |
(14,584 |
) |
PEO – Reconciliation of SCT Total to CAP Total(a)
Year |
SCT Total |
|
|
Grant Date Fair Value of Awards Granted During the Year |
|
|
Fair Value of Equity Calculated Using SEC Methodology |
|
|
CAP Total |
|
||||
2024 |
$ |
1,337,500 |
|
- |
$ |
937,500 |
|
+ |
$ |
1,376,603 |
|
= |
$ |
1,776,603 |
|
2023 |
$ |
772,895 |
|
- |
$ |
182,927 |
|
+ |
$ |
190,880 |
|
= |
$ |
780,848 |
|
(a) As show in the table, the CAP total represents the SCT total for the covered fiscal year, but adjusted as required by SEC rules to replace the grant date fair value of the awards granted during the covered fiscal year with the fair value of current and prior year equity awards that were outstanding at the end of the current fiscal year or that vested or were forfeited during the covered fiscal year. Our NEOs do not participate in a defined benefit plan; therefore, no adjustment for pension benefits is included.
The calculation of the fair value of equity for the PEO for the covered fiscal year is shown in the following table:
PEO – CAP Fair Value of Equity Calculation (a)
Year |
YE Fair Value of Current Year Awards Outstanding at YE |
|
|
Change in Fair Value as of YE for Awards Granted in Prior Years and Outstanding at YE |
|
|
Change in Fair Value as of Vesting Date for Awards Granted in Prior Years that Vested During the Year |
|
|
Fair Value of Equity for CAP Purposes |
|
||||
2024 |
$ |
1,262,500 |
|
+ |
$ |
84,452 |
|
+ |
$ |
29,652 |
|
= |
$ |
1,376,603 |
|
2023 |
$ |
190,880 |
|
+ |
$ |
- |
|
+ |
$ |
- |
|
= |
$ |
190,880 |
|
(a) We did not issue any equity awards during the covered fiscal year that vested in the year of grant. Additionally, no equity awards granted in any prior fiscal year failed to meet applicable vesting conditions or were forfeited during the covered fiscal year.
Non-PEO NEOs (Average) – Reconciliation of SCT Total to CAP Total(a)
Year |
SCT Total |
|
|
Grant Date Fair Value of Awards Granted During the Year |
|
|
Fair Value of Equity Calculated Using SEC Methodology |
|
|
CAP Total |
|
||||
2024 |
$ |
1,465,789 |
|
- |
$ |
1,087,240 |
|
+ |
$ |
1,538,415 |
|
= |
$ |
1,916,964 |
|
2023 |
$ |
514,017 |
|
- |
$ |
139,844 |
|
+ |
$ |
87,619 |
|
= |
$ |
461,792 |
|
(a) The CAP total figures were calculated using the same methodology described in footnote (a) to the “PEO — Reconciliation of SCT Total to CAP Total” table shown above.
(b) The calculation of the fair value of equity for the Non-PEO NEOs for the covered fiscal year is shown in the following table:
Non-PEO NEOs (Average) – CAP Fair Value of Equity Calculation (a)
Year |
YE Fair Value of Current Year Awards Outstanding at YE |
|
|
Change in Fair Value as of YE for Awards Granted in Prior Years and Outstanding at YE |
|
|
Change in Fair Value as of Vesting Date for Awards Granted in Prior Years that Vested During the Year |
|
|
Fair Value of Equity for CAP Purposes |
|
||||
2024 |
$ |
1,464,149 |
|
+ |
$ |
48,160 |
|
+ |
$ |
26,105 |
|
= |
$ |
1,538,415 |
|
2023 |
$ |
87,865 |
|
+ |
$ |
(247 |
) |
+ |
$ |
- |
|
= |
$ |
87,619 |
|
(a) We did not issue any equity awards during the covered fiscal year that vested in the year of grant. Additionally, no equity awards granted in any prior fiscal year failed to meet applicable vesting conditions or were forfeited during the covered fiscal year.
(b) TSR figures assume an initial investment of $100 in DIRTT on December 31, 2022. The peer group referenced for purposes of the TSR comparison is the group of companies included in the S&P SmallCap 600 Materials Index. This comprises those companies included in the S&P SmallCap 600 that are classified as members of the GICS Materials sector. DIRTT did not disclose a stock comparison chart as per Item 201(e) in our Form 10-K filings for 2023 and 2024 as it was not required. The S&P SmallCap 600 Index is the same index we would have used if this disclosure was required and the same peer group used in prior years when such disclosure was made.
PEO – Reconciliation of SCT Total to CAP Total(a)
Year |
SCT Total |
|
|
Grant Date Fair Value of Awards Granted During the Year |
|
|
Fair Value of Equity Calculated Using SEC Methodology |
|
|
CAP Total |
|
||||
2024 |
$ |
1,337,500 |
|
- |
$ |
937,500 |
|
+ |
$ |
1,376,603 |
|
= |
$ |
1,776,603 |
|
2023 |
$ |
772,895 |
|
- |
$ |
182,927 |
|
+ |
$ |
190,880 |
|
= |
$ |
780,848 |
|
The calculation of the fair value of equity for the PEO for the covered fiscal year is shown in the following table:
PEO – CAP Fair Value of Equity Calculation (a)
Year |
YE Fair Value of Current Year Awards Outstanding at YE |
|
|
Change in Fair Value as of YE for Awards Granted in Prior Years and Outstanding at YE |
|
|
Change in Fair Value as of Vesting Date for Awards Granted in Prior Years that Vested During the Year |
|
|
Fair Value of Equity for CAP Purposes |
|
||||
2024 |
$ |
1,262,500 |
|
+ |
$ |
84,452 |
|
+ |
$ |
29,652 |
|
= |
$ |
1,376,603 |
|
2023 |
$ |
190,880 |
|
+ |
$ |
- |
|
+ |
$ |
- |
|
= |
$ |
190,880 |
|
Non-PEO NEOs (Average) – Reconciliation of SCT Total to CAP Total(a)
Year |
SCT Total |
|
|
Grant Date Fair Value of Awards Granted During the Year |
|
|
Fair Value of Equity Calculated Using SEC Methodology |
|
|
CAP Total |
|
||||
2024 |
$ |
1,465,789 |
|
- |
$ |
1,087,240 |
|
+ |
$ |
1,538,415 |
|
= |
$ |
1,916,964 |
|
2023 |
$ |
514,017 |
|
- |
$ |
139,844 |
|
+ |
$ |
87,619 |
|
= |
$ |
461,792 |
|
(b) The calculation of the fair value of equity for the Non-PEO NEOs for the covered fiscal year is shown in the following table:
Non-PEO NEOs (Average) – CAP Fair Value of Equity Calculation (a)
Year |
YE Fair Value of Current Year Awards Outstanding at YE |
|
|
Change in Fair Value as of YE for Awards Granted in Prior Years and Outstanding at YE |
|
|
Change in Fair Value as of Vesting Date for Awards Granted in Prior Years that Vested During the Year |
|
|
Fair Value of Equity for CAP Purposes |
|
||||
2024 |
$ |
1,464,149 |
|
+ |
$ |
48,160 |
|
+ |
$ |
26,105 |
|
= |
$ |
1,538,415 |
|
2023 |
$ |
87,865 |
|
+ |
$ |
(247 |
) |
+ |
$ |
- |
|
= |
$ |
87,619 |
|
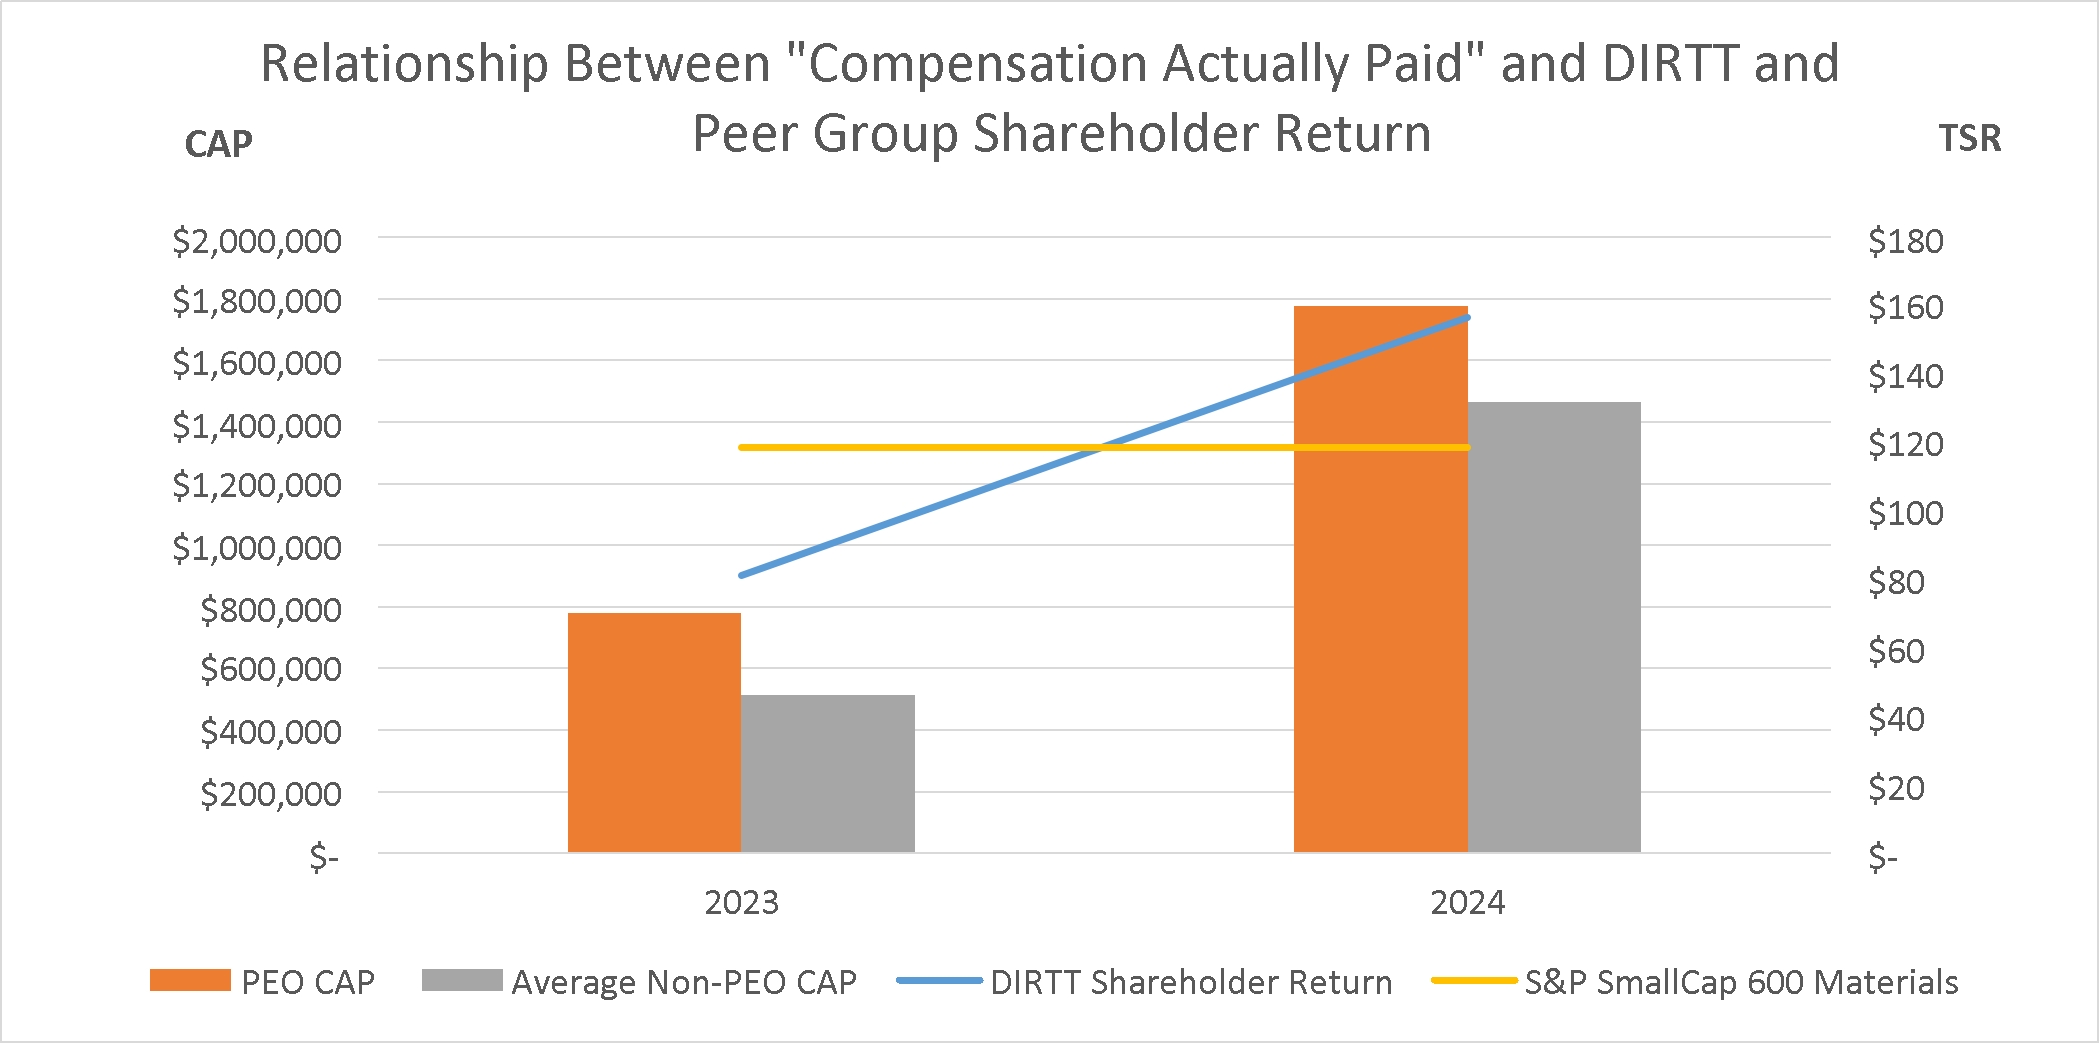
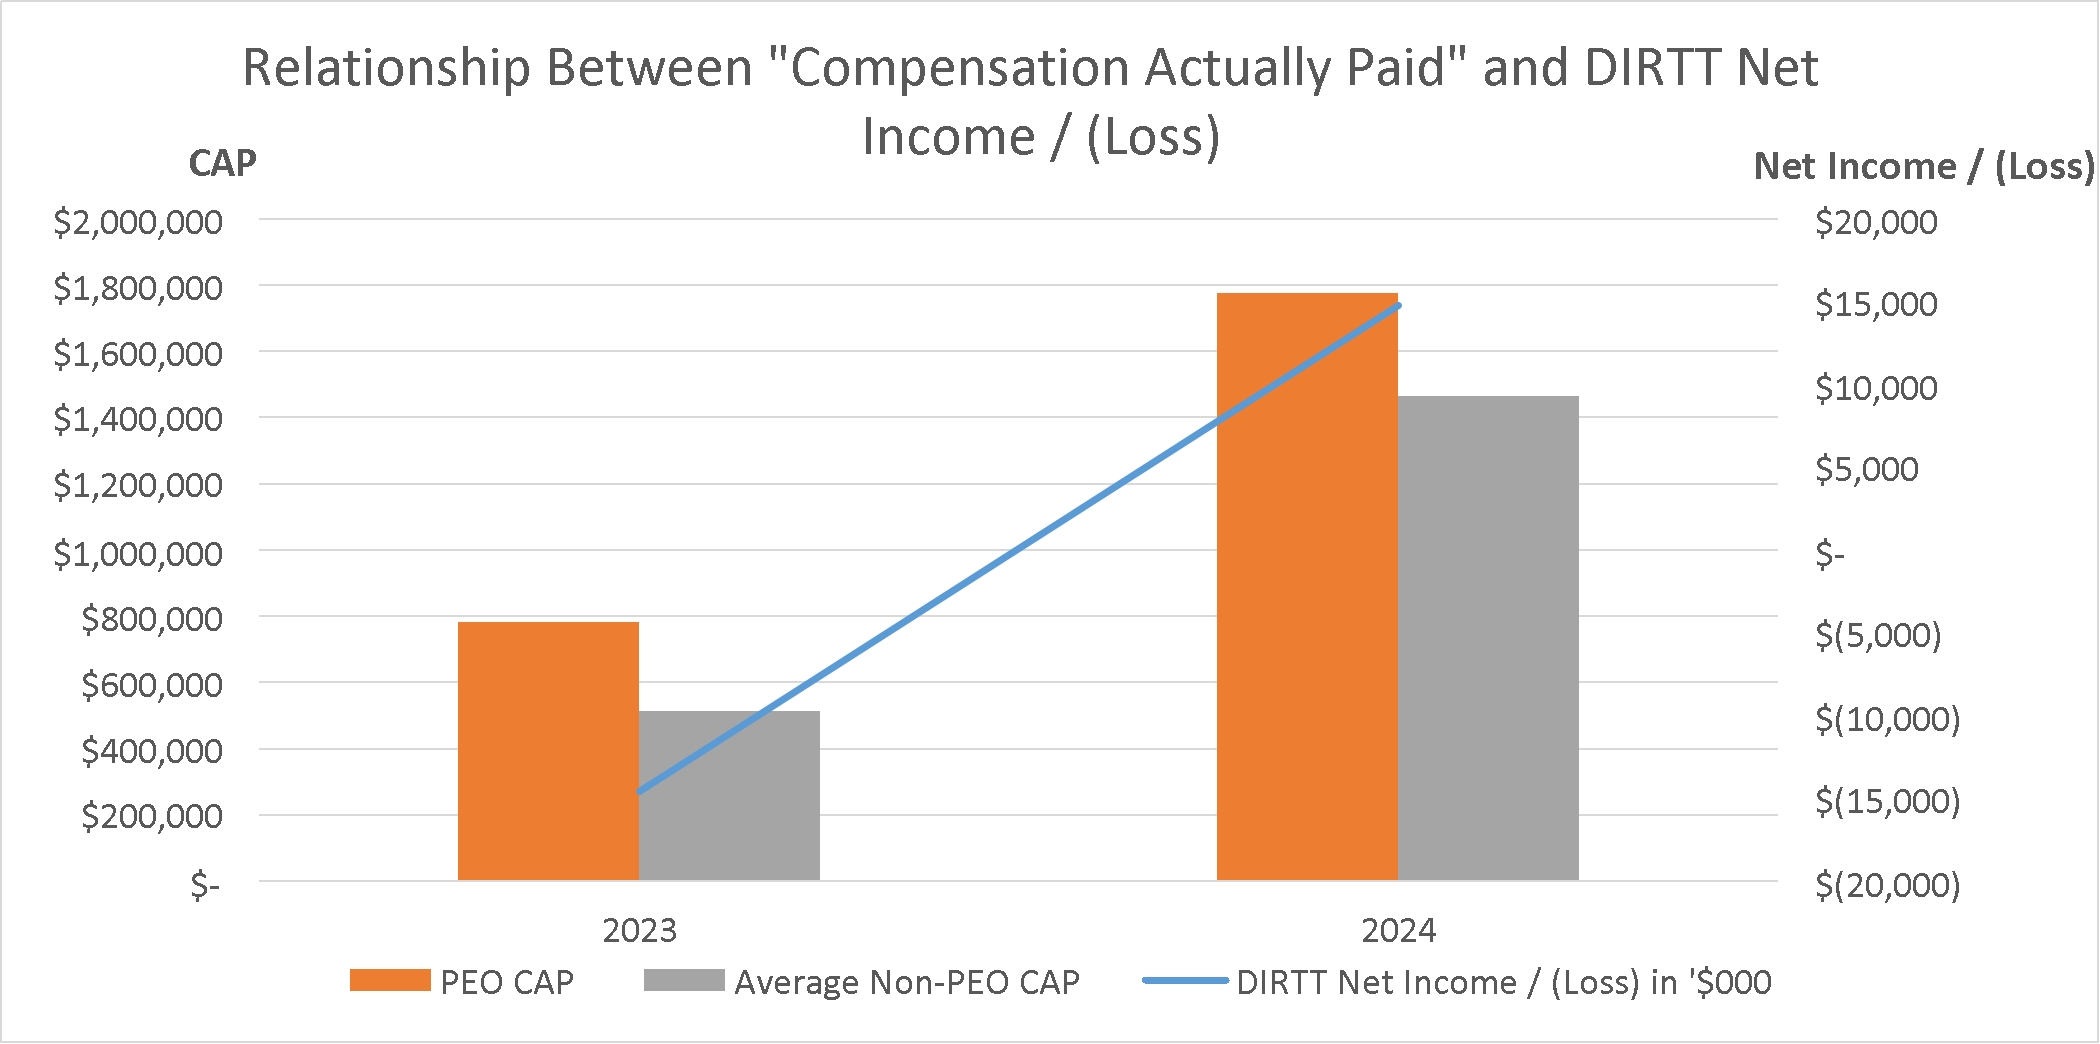
The graphs below describe the relationship between CAP (as calculated above) and our financial and stock performance for the indicated years. In addition, the first table below compares our cumulative TSR to peer group TSR for the indicated years.