Shareholder Report
Feb. 28, 2025
USD ($)
Holding
annual shareholder report
contains important information about the fund for the period of March 1, 2024, to February 28, 2025.
You can find additional information about the fund at
www.schwabassetmanagement.com/prospectus
.
You can also request this
information by calling
1-866-414-6349
or by sending an email request to
orders@mysummaryprospectus.com
.
FUND COSTS FOR THE LAST year ENDED February 28, 2025
(BASED ON A HYPOTHETICAL $10,000 INVESTMENT)
COSTS OF A $10,000 INVESTMENT |
COSTS PAID AS A PERCENTAGE OF A $10,000 INVESTMENT | |
Schwab Global Real Estate Fund |
$75 |
0.72% |
MANAGEMENT’S DISCUSSION OF FUND PERFORMANCE
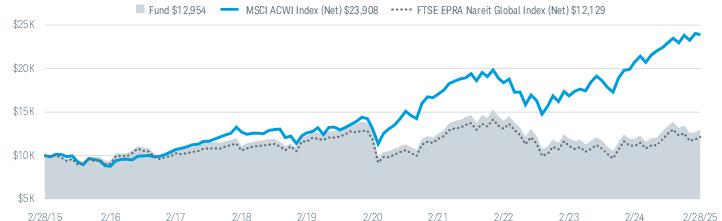
For the 12-month reporting period ended February 28, 2025, the fund returned 8.73%. The MSCI ACWI Index (Net)
1
, which serves
as the fund’s regulatory index and provides a broad measure of market performance, returned 15.06%. The FTSE EPRA Nareit
Global Index (Net)
1
which returned 9.22%, is the fund’s additional index, and is more representative of the fund’s investment
universe than the regulatory index.
■
Real estate stocks underperformed the broader market
■
As of the end of the reporting period, the fund held securities in 21 countries
■
Top detractors from total return:
●
Indonesian securities, including Ciputra Development Tbk. PT
●
Mexican securities
■
Top contributors to total return:
●
Securities from the United States, including Welltower, Inc.
●
Securities from the United Arab Emirates
■
From an individual security perspective:
●
Prologis, Inc. was the largest detractor from total return
●
Welltower, Inc. was the largest contributor to total return
Portfolio holdings may have changed since the report date.
1
The net version of the index reflects reinvested dividends net of withholding taxes but reflects no deductions for expenses or other taxes.
Performance of Hypothetical $10,000 Investment (February 28, 2015 - February 28, 2025)
1,2,3
All total returns on this page assume dividends and distributions were reinvested. Index figures do not include trading and management costs, which would lower
performance. Indices are unmanaged and cannot be invested in directly. Performance results less than one year are not annualized.
For index definitions, please see www.schwabassetmanagement.com/glossary.
1
Fund expenses may have been partially absorbed by the investment adviser and its affiliates. Without these reductions, the fund’s returns may have been lower.
Performance does not reflect the deduction of taxes that a shareholder would pay on fund distributions or on the redemption of fund shares.
2
The fund’s performance relative to the index may be affected by fair-value pricing and timing differences in foreign exchange calculations.
3
The net version of the index reflects reinvested dividends net of withholding taxes but reflects no deductions for expenses or other taxes.
4
Due to new regulatory requirements, the fund’s regulatory index has changed from the FTSE EPRA Nareit Global Index (Net) to the MSCI ACWI Index (Net). The MSCI ACWI
Index (Net) provides a broad measure of market performance. The FTSE EPRA Nareit Global Index (Net) is the fund’s additional index and is more representative of the
fund’s investment universe than the regulatory index.
Average Annual Total Returns
Fund and Inception Date |
1 Year |
5 Years |
10 Years |
Fund: Schwab Global Real Estate Fund (05/31/2007) 1,2 |
8.73% |
0.17% |
2.62% |
MSCI ACWI Index (Net) 3,4 |
15.06% |
12.79% |
9.11% |
FTSE EPRA Nareit Global Index (Net) 3 |
9.22% |
0.47% |
1.95% |
All total returns on this page assume dividends and distributions were reinvested. Index figures do not include trading and management costs, which would lower
performance. Indices are unmanaged and cannot be invested in directly. Performance results less than one year are not annualized.
For index definitions, please see www.schwabassetmanagement.com/glossary.
1
Fund expenses may have been partially absorbed by the investment adviser and its affiliates. Without these reductions, the fund’s returns may have been lower.
Performance does not reflect the deduction of taxes that a shareholder would pay on fund distributions or on the redemption of fund shares.
2
The fund’s performance relative to the index may be affected by fair-value pricing and timing differences in foreign exchange calculations.
3
The net version of the index reflects reinvested dividends net of withholding taxes but reflects no deductions for expenses or other taxes.
4
Due to new regulatory requirements, the fund’s regulatory index has changed from the FTSE EPRA Nareit Global Index (Net) to the MSCI ACWI Index (Net). The MSCI ACWI
Index (Net) provides a broad measure of market performance. The FTSE EPRA Nareit Global Index (Net) is the fund’s additional index and is more representative of the
fund’s investment universe than the regulatory index.
To obtain performance information current to the most
recent month end, please visit
www.schwabassetmanagement.com/prospectus
.
Statistics
Net Assets (thousands) |
$290,391 |
Number of Holdings |
107 |
Portfolio Turnover Rate |
85% |
Advisory Fees Paid by the Fund |
$1,482,336 |
Weighted Average Market Cap (millions) |
$26,470 |
Price/Earnings Ratio (P/E) |
21.5 |
Price/Book Ratio (P/B) |
1.4 |
Qualified Dividend Income |
$2,804,187 |
Qualified Business Income Deduction (199A) |
$5,999,893 |
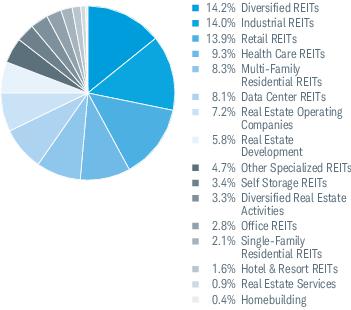
Industry Weightings % of Investments
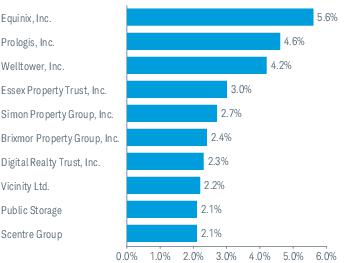
Top Holdings % of Net Assets
Country Weightings % of Investments
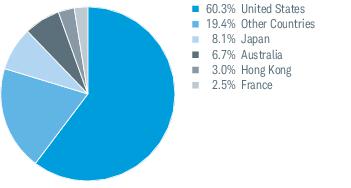
Portfolio holdings may have changed since the
report
date
.The Sector/Industry classifications in this report use the Global Industry Classification Standard (GICS) which was developed by and is the exclusive property of MSCI Inc.
(MSCI) and Standard & Poor’s (S&P). GICS is a service mark of MSCI and S&P and has been licensed for use by Charles Schwab & Co., Inc.
Top Holdings % of Net Assets
Portfolio holdings may have changed since the
report
date
.