| 1Q25 Financial Earnings May 1, 2025 |

| 2 This presentation includes forward-looking statements that are subject to risks and uncertainties that could cause actual future events and results to differ materially from those expressed in the forward-looking statements. Forward-looking statements are typically identified by words or phrases such as “will,” “anticipate,” “estimate,” “expect,” “project,” “intend,” “plan,” “believe,” “target,” “forecast” and other words and terms of similar meaning. Forward-looking statements include, but are not limited to, guidance regarding 2025 financial and operational results and our ability to execute our 2025 strategic goals supporting the guidance, including planned acceleration of our fiber deployment and our ability to increase our fiber penetration; the number of households or locations we may be able to serve generally and related to funding from various current or future state and federal broadband programs, public-private partnerships with government entities, the Rural Digital Opportunity Fund, and the BEAD program; our ability to continue positive trends regarding ARPU and fiber broadband adds; opportunities related to strategic sales, products, and strategic revenue growth across our business units; expectations regarding expense management activities, and the timing and benefit of such activities; statements regarding possible benefits and opportunities related to the proposed transaction with Uniti Group, Inc.; and any other statements regarding plans, objectives, expectations and intentions and other statements that are not historical facts. These statements, along with other forward-looking statements regarding Windstream’s overall business outlook, are based on estimates, projections, beliefs, and assumptions that Windstream believes are reasonable but are not guarantees of future events, performance, or results. Actual future events and results may differ materially from those expressed in these forward-looking statements as the result of a number of important factors. Important factors that could cause actual results to differ materially from those indicated by such forward-looking statements include risks and uncertainties relating to increased competitive pressures as state and federal broadband funding programs provide opportunities for new entrants in our markets, or prefer municipal cooperatives, leading to possible overbuilding of our network; our ability to, and the extent to which, we participate in broadband funding programs, such as BEAD, and are able to successfully secure funding via competitive bidding processes over competitors; the uncertainty surrounding the BEAD program in light of increased focus on the program by the federal legislative and executive branches, including changes to the program, timing of implementation of the program or in what form the program continues; the effect of any changes in federal or state governmental regulations or statutes or new requirements or restrictions contained in executive orders that could impact our business or the business of our customers; uncertainty created in the federal Universal Service Fund program based on the pending legal case at the U.S. Supreme Court, including possible impact on future funding under the Rural Digital Opportunity Fund; increased oversight or enforcement activities by state or federal agencies, particularly based on our status as a federal and state government contractor; that the proposed transaction with Uniti Group, Inc., could cause distraction by management, increased employee turnover, and an allocation of resources that otherwise would have been attributed to the business; risks and uncertainties from cost pressures, trade tariffs, trade disputes, or inflation on our business or on our customers’ communications and payment decisions and on the business of our vendors; adverse economic, political or market conditions related to foreign wars or unrest, political upheaval epidemics, pandemics, or disease outbreaks, and the impact of these conditions on our business operations and financial position and on our customers; any supply chain impact from trade tariffs or trade disputes on our vendors that may impact our business operations and our customers’ ability to operate their business; that the expected benefits of cost and expense management activities are not realized or adversely affect our sales and operations or are otherwise disruptive to our business and personnel; the impact of new, emerging, or competing technologies and our ability to utilize these technologies to provide services to our customers; and general U.S. and worldwide economic conditions and related uncertainties. Windstream does not undertake any obligation to publicly update any forward-looking statement, whether as a result of new information, future events or otherwise. |
| 3 Paul Sunu Chief Executive Officer Drew Smith Chief Financial Officer & Treasurer Genesis White VP, Investor Relations & Assistant Treasurer |

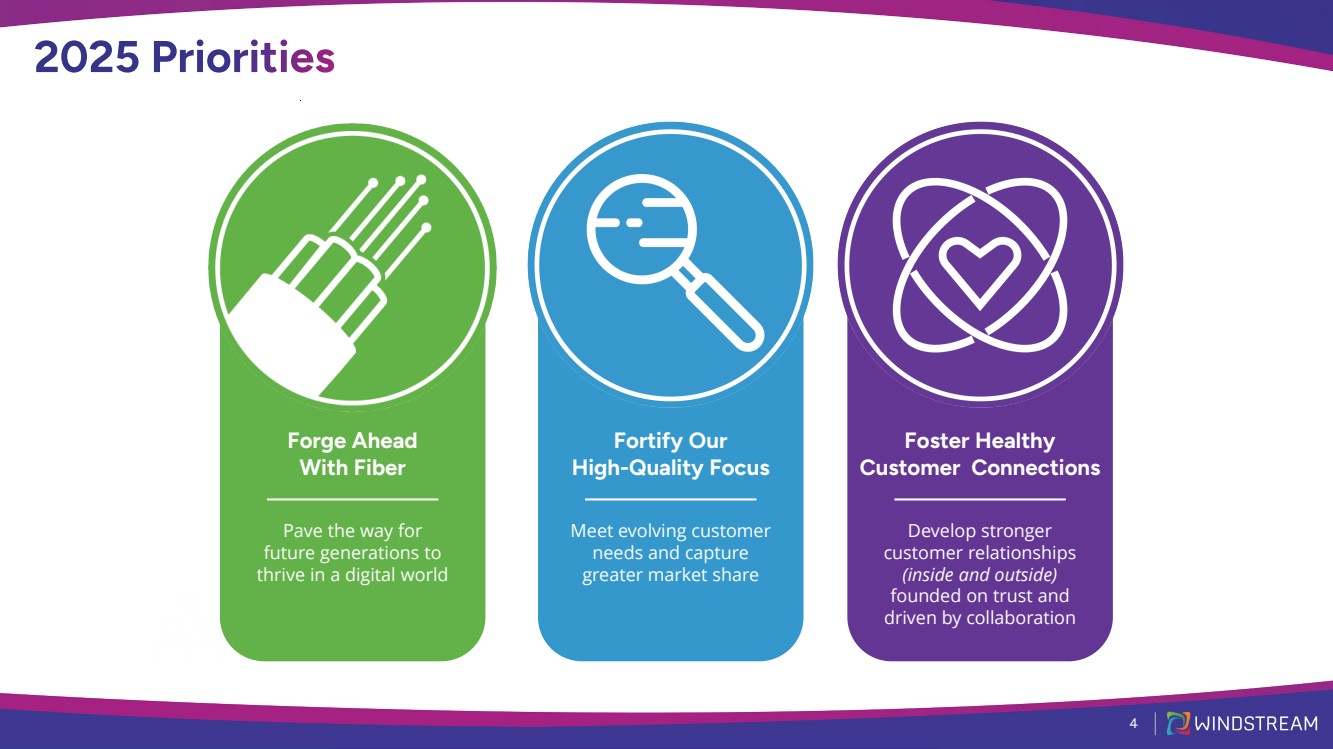
| 4 Be the PREMIER broadband provider Be the INNOVATIVE wholesale leader OPERATIONS & SUPPORT Be the unwavering foundation that aligns, nurtures and enables us to be our best Focus o diversity and inclusion Forge Ahead With Fiber Fortify Our High-Quality Focus Foster Healthy Customer Connections Pave the way for future generations to thrive in a digital world Meet evolving customer needs and capture greater market share Develop stronger customer relationships (inside and outside) founded on trust and driven by collaboration |
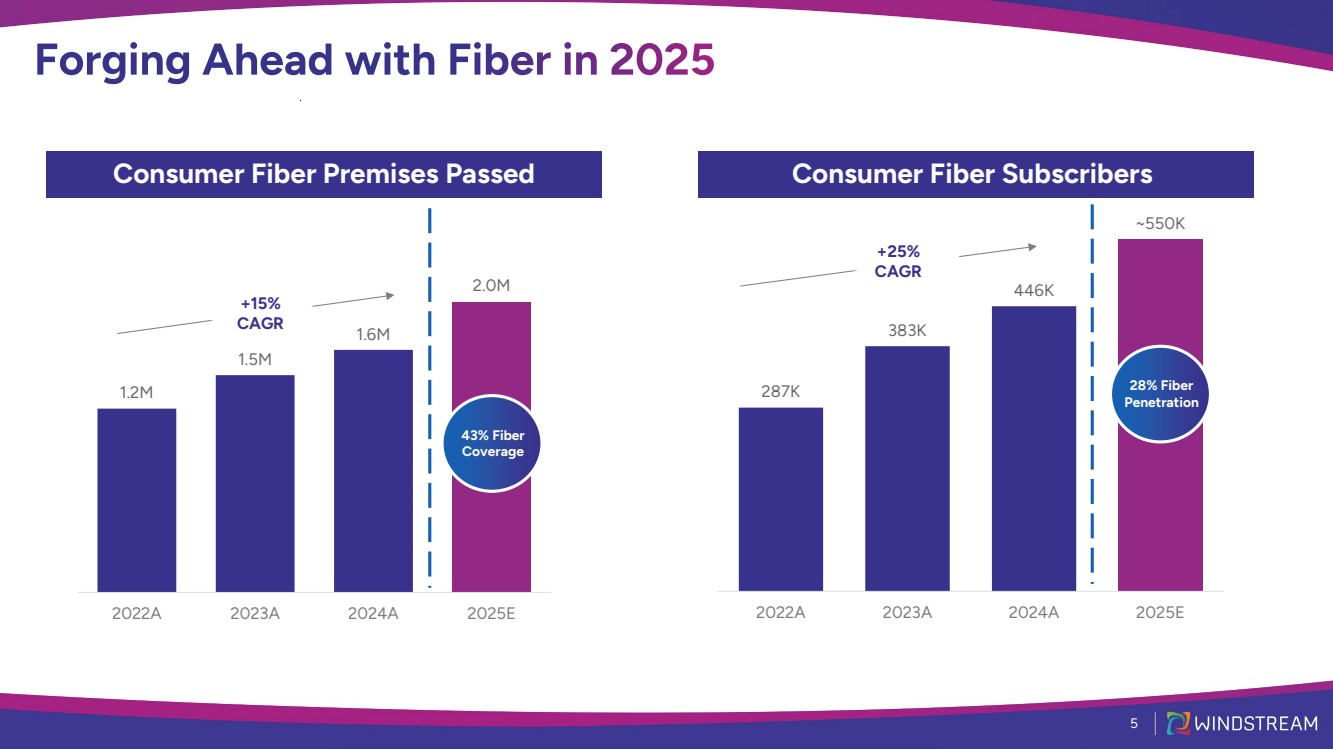
| 1.2M 1.5M 1.6M 2.0M 2022A 2023A 2024A 2025E +15% CAGR 5 287K 383K 446K ~550K 2022A 2023A 2024A 2025E +25% CAGR 28% Fiber Penetration Consumer Fiber Premises Passed Consumer Fiber Subscribers 43% Fiber Coverage |
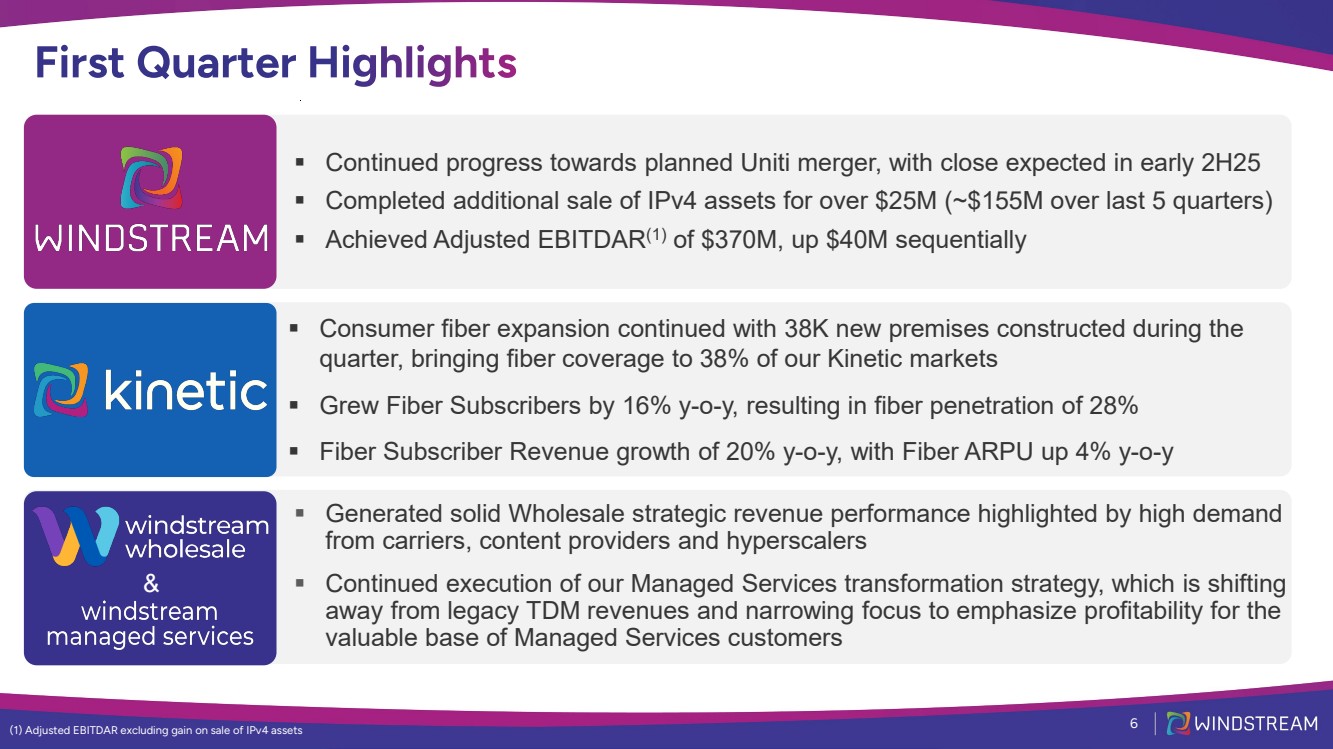
| 6 Continued progress towards planned Uniti merger, with close expected in early 2H25 Completed additional sale of IPv4 assets for over $25M (~$155M over last 5 quarters) Achieved Adjusted EBITDAR(1) of $370M, up $40M sequentially Consumer fiber expansion continued with 38K new premises constructed during the quarter, bringing fiber coverage to 38% of our Kinetic markets Grew Fiber Subscribers by 16% y-o-y, resulting in fiber penetration of 28% Fiber Subscriber Revenue growth of 20% y-o-y, with Fiber ARPU up 4% y-o-y Generated solid Wholesale strategic revenue performance highlighted by high demand from carriers, content providers and hyperscalers Continued execution of our Managed Services transformation strategy, which is shifting away from legacy TDM revenues and narrowing focus to emphasize profitability for the valuable base of Managed Services customers (1) Adjusted EBITDAR excluding gain on sale of IPv4 assets & |
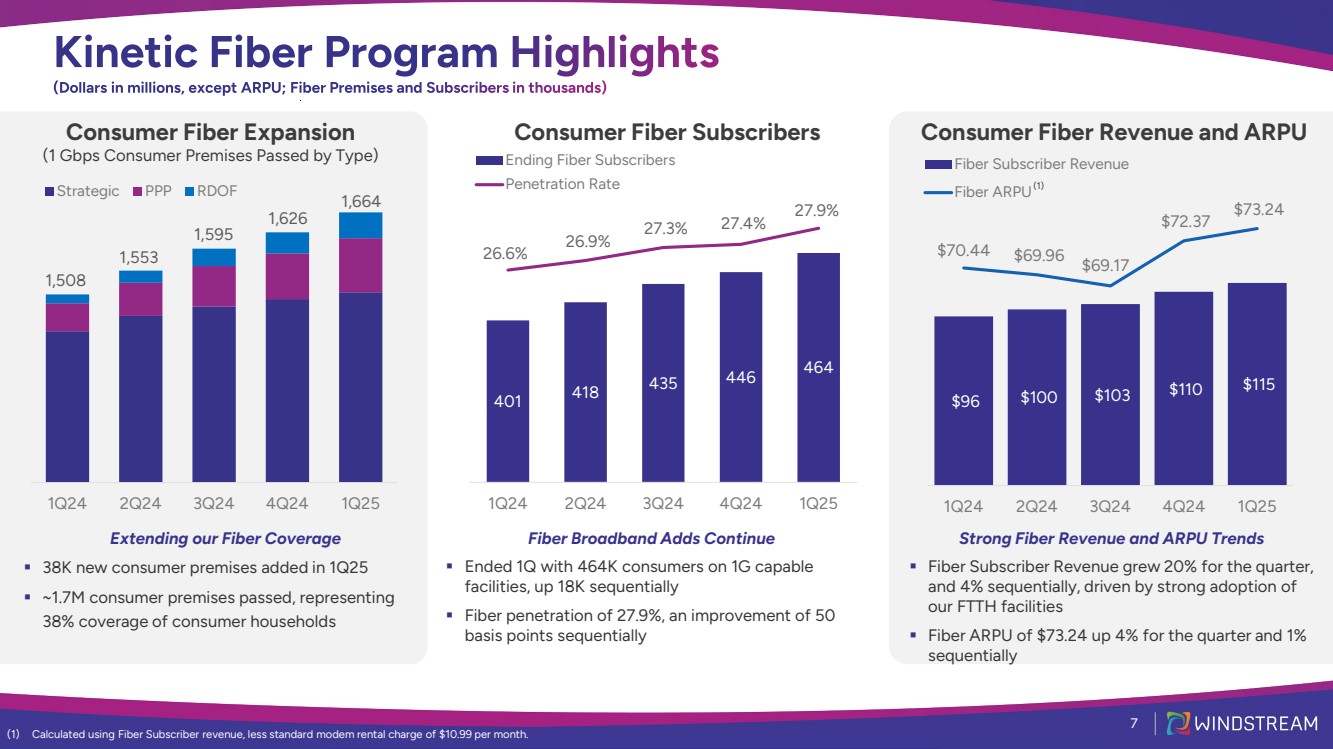
| 7 Consumer Fiber Expansion (1 Gbps Consumer Premises Passed by Type) Extending our Fiber Coverage 38K new consumer premises added in 1Q25 ~1.7M consumer premises passed, representing 38% coverage of consumer households (1) Calculated using Fiber Subscriber revenue, less standard modem rental charge of $10.99 per month. 1Q24 2Q24 3Q24 4Q24 1Q25 Strategic PPP RDOF 1,664 1,553 1,595 Consumer Fiber Subscribers Consumer Fiber Revenue and ARPU 1,626 1,508 401 418 435 446 464 26.6% 26.9% 27.3% 27.4% 27.9% 1Q24 2Q24 3Q24 4Q24 1Q25 Ending Fiber Subscribers Penetration Rate $96 $100 $103 $110 $115 $70.44 $69.96 $69.17 $72.37 $73.24 1Q24 2Q24 3Q24 4Q24 1Q25 Fiber Subscriber Revenue Fiber ARPU(1) Fiber Broadband Adds Continue Ended 1Q with 464K consumers on 1G capable facilities, up 18K sequentially Fiber penetration of 27.9%, an improvement of 50 basis points sequentially Strong Fiber Revenue and ARPU Trends Fiber Subscriber Revenue grew 20% for the quarter, and 4% sequentially, driven by strong adoption of our FTTH facilities Fiber ARPU of $73.24 up 4% for the quarter and 1% sequentially |
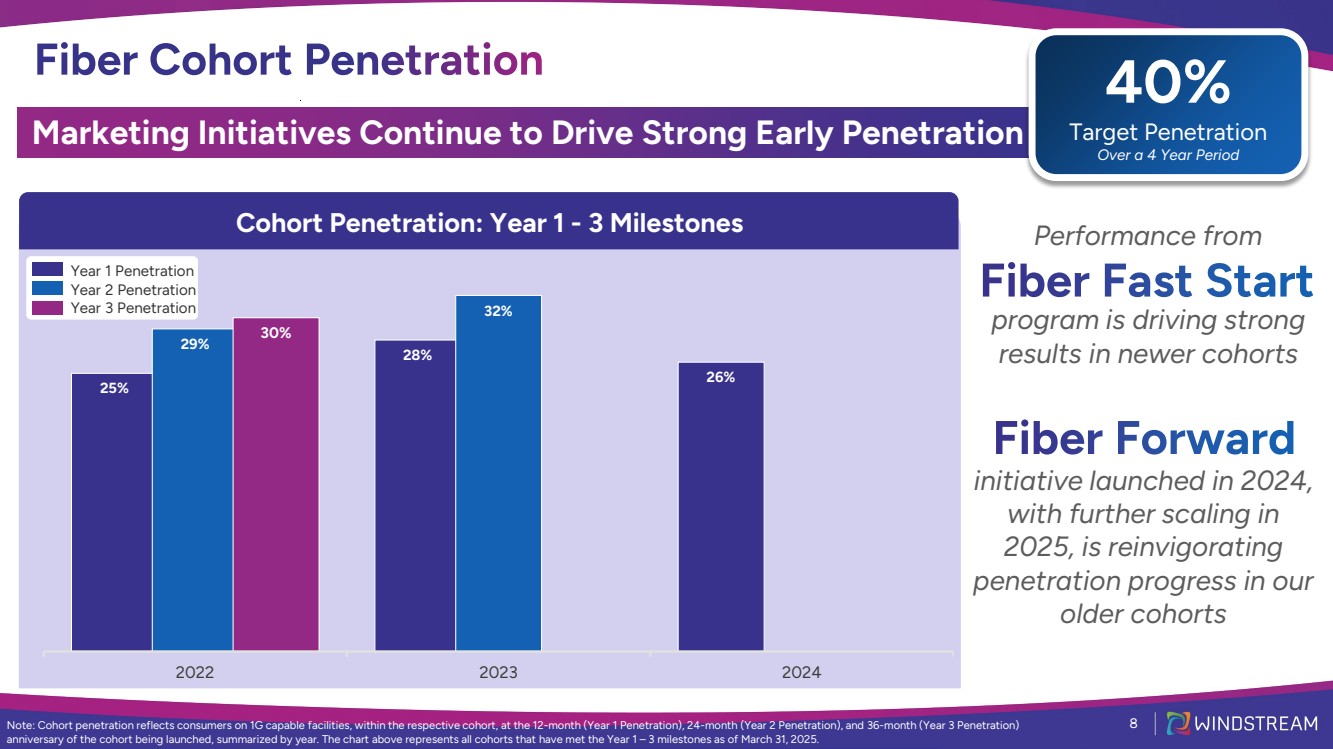
| 25% 28% 26% 29% 32% 30% 2022 2023 2024 Marketing Initiatives Continue to Drive Strong Early Penetration Note: Cohort penetration reflects consumers on 1G capable facilities, within the respective cohort, at the 12-month (Year 1 Penetration), 24-month (Year 2 Penetration), and 36-month (Year 3 Penetration) anniversary of the cohort being launched, summarized by year. The chart above represents all cohorts that have met the Year 1 – 3 milestones as of March 31, 2025. Cohort Penetration: Year 1 - 3 Milestones 8 Year 1 Penetration Year 2 Penetration Year 3 Penetration 40% Target Penetration Over a 4 Year Period Performance from program is driving strong results in newer cohorts initiative launched in 2024, with further scaling in 2025, is reinvigorating penetration progress in our older cohorts |
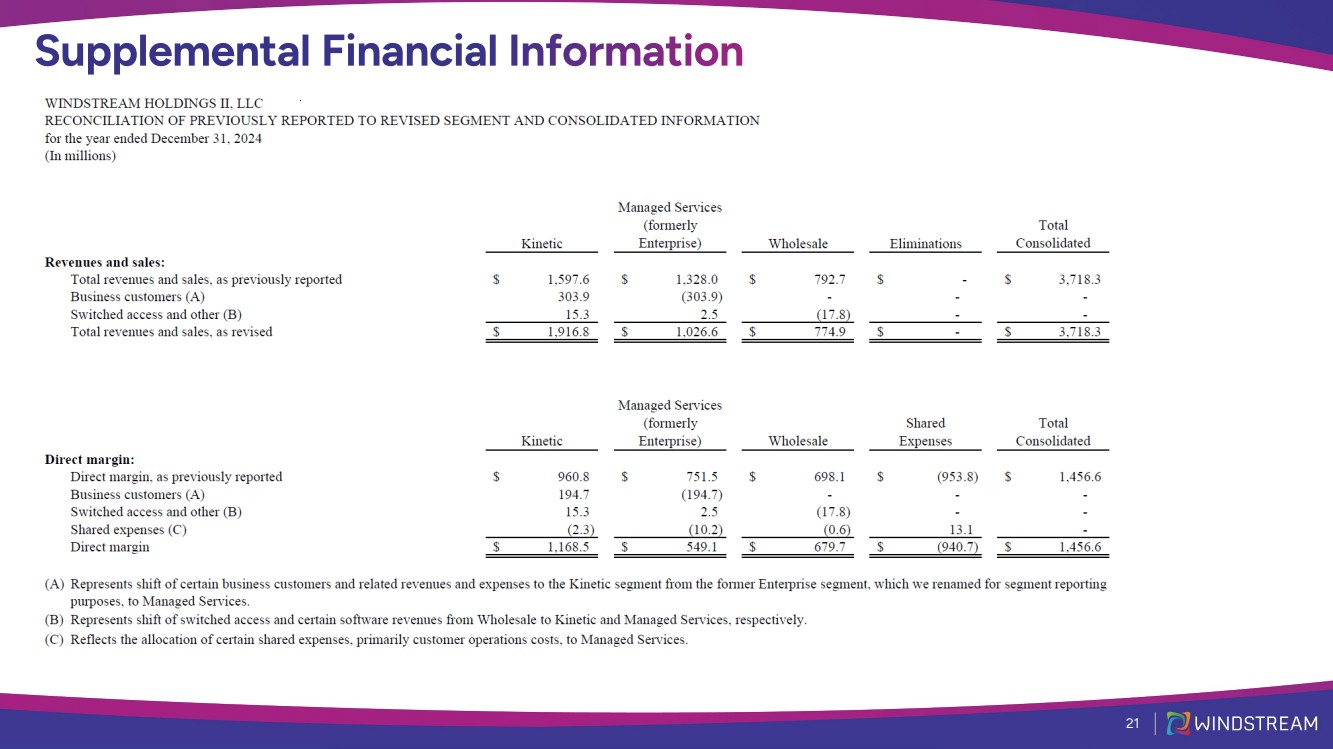
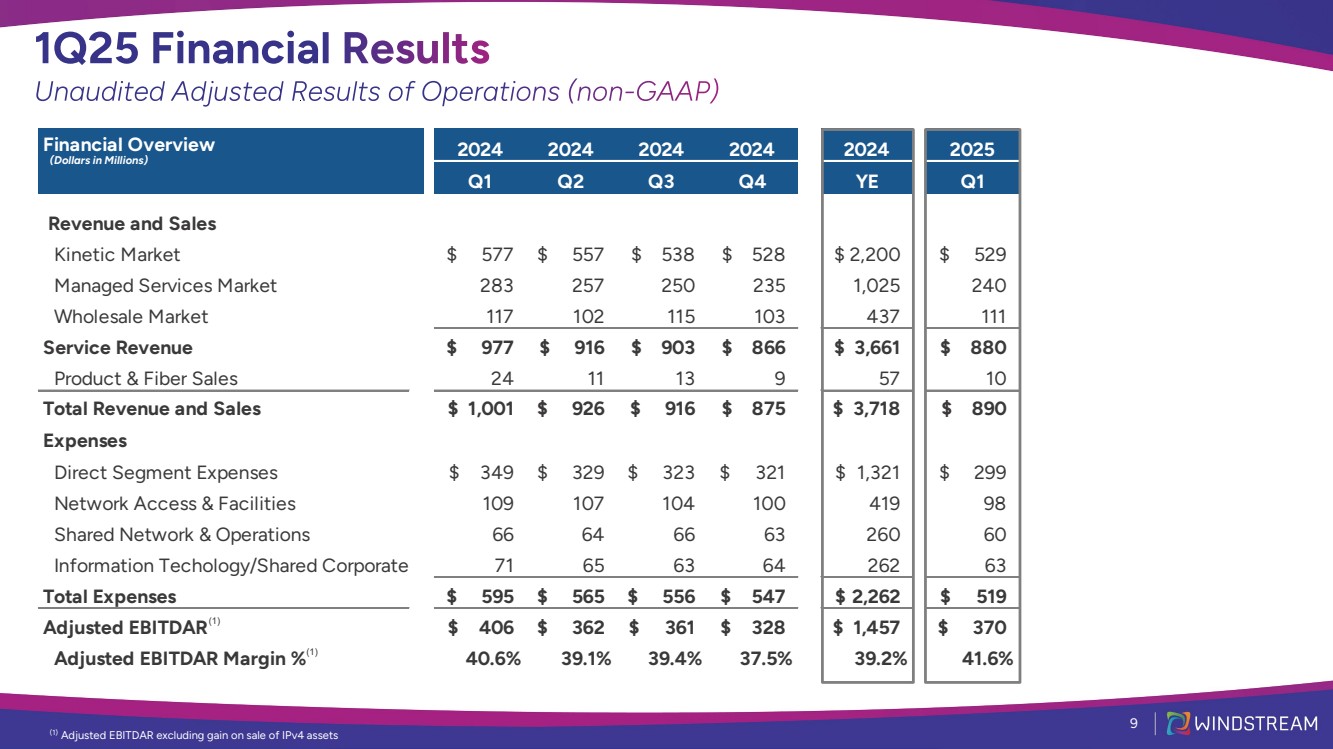
| Financial Overview 2024 2024 2024 2024 2024 2025 Q1 Q2 Q3 Q4 YE Q1 Revenue and Sales Kinetic Market $ 577 $ 557 $ 538 $ 528 $ 2,200 $ 529 Managed Services Market 283 257 250 235 1,025 240 Wholesale Market 117 102 115 103 437 111 Service Revenue $ 977 $ 916 $ 903 $ 866 $ 3,661 $ 880 Product & Fiber Sales 24 11 13 9 57 10 Total Revenue and Sales $ 1,001 $ 926 $ 916 $ 875 $ 3,718 $ 890 Expenses Direct Segment Expenses $ 349 $ 329 $ 323 $ 321 $ 1,321 $ 299 Network Access & Facilities 109 107 104 100 419 98 Shared Network & Operations 66 64 66 63 260 60 Information Techology/Shared Corporate 71 65 63 64 262 63 Total Expenses $ 595 $ 565 $ 556 $ 547 $ 2,262 $ 519 Adjusted EBITDAR $ 406 $ 362 $ 361 $ 328 $ 1,457 $ 370 Adjusted EBITDAR Margin % 40.6% 39.1% 39.4% 37.5% 39.2% 41.6% (Dollars in Millions) 9 (1) Adjusted EBITDAR excluding gain on sale of IPv4 assets (1) (1) |
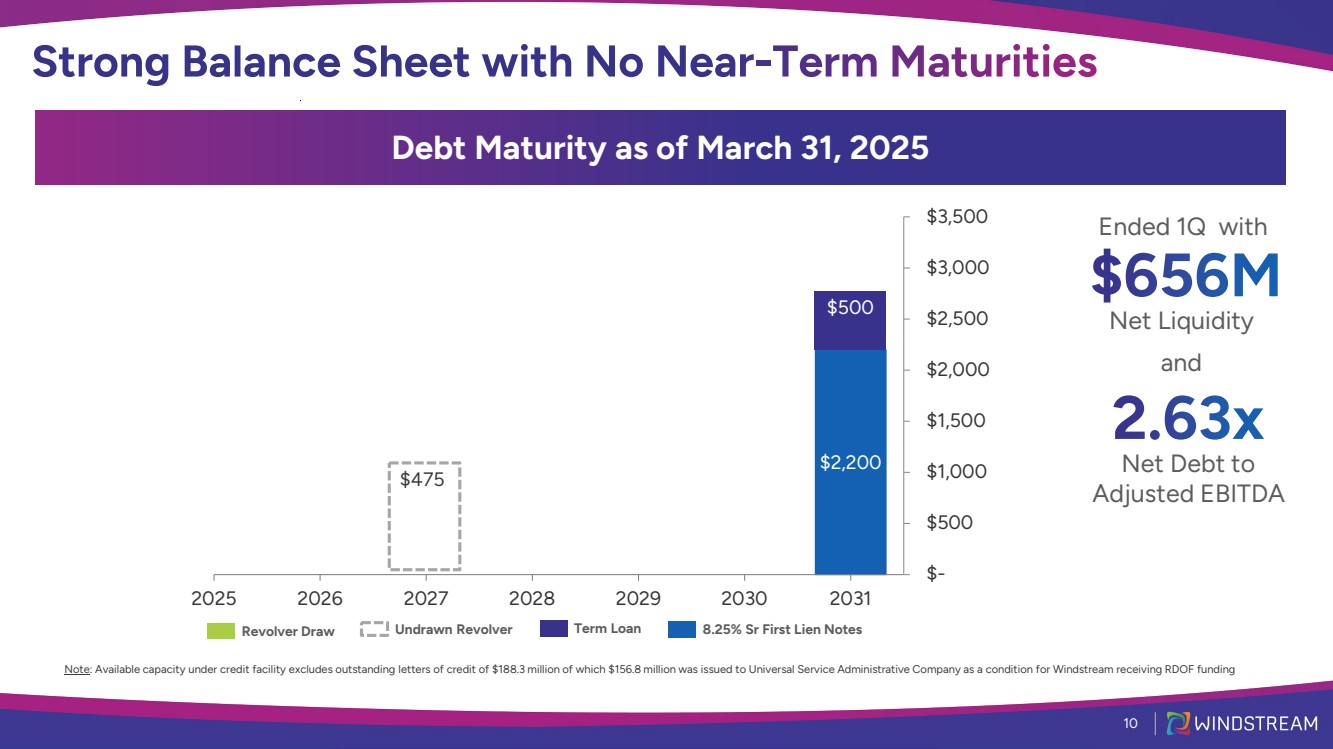
| $0 $0 $… $0 $2,200 $- $500 $1,000 $1,500 $2,000 $2,500 $3,000 $3,500 2025 2026 2027 2028 2029 2030 2031 $475 Debt Maturity as of November 10, 2022 Revolver Draw Note: Available capacity under credit facility excludes outstanding letters of credit of $188.3 million of which $156.8 million was issued to Universal Service Administrative Company as a condition for Windstream receiving RDOF funding Net Liquidity Net Debt to Adjusted EBITDA 10 Undrawn Revolver Term Loan 8.25% Sr First Lien Notes Ended 1Q with and $500 Debt Maturity as of March 31, 2025 |
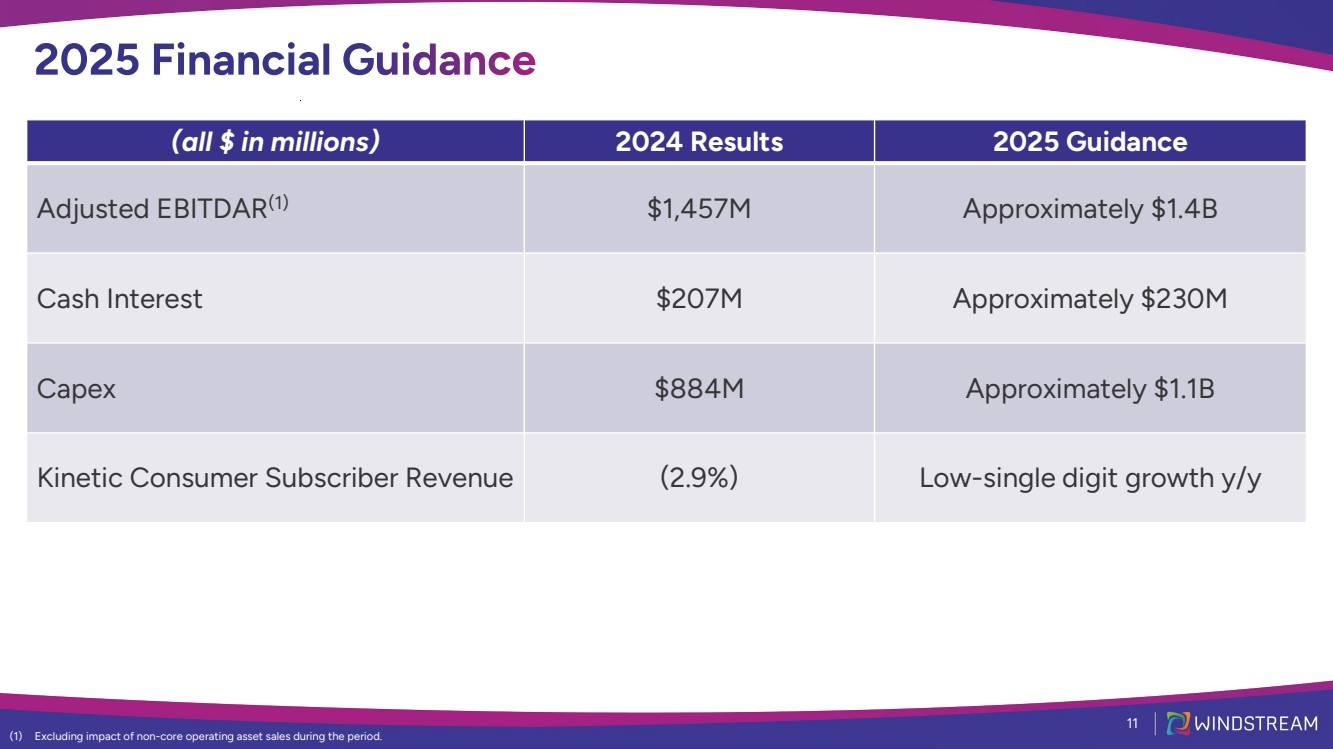
| 11 (all $ in millions) 2024 Results 2025 Guidance Adjusted EBITDAR(1) $1,457M Approximately $1.4B Cash Interest $207M Approximately $230M Capex $884M Approximately $1.1B Kinetic Consumer Subscriber Revenue (2.9%) Low-single digit growth y/y (1) Excluding impact of non-core operating asset sales during the period. |
| Quarterly supplemental schedules (Pro Forma) Appendix 12 |

| 13 |

| 14 |
| 15 |

| 16 |
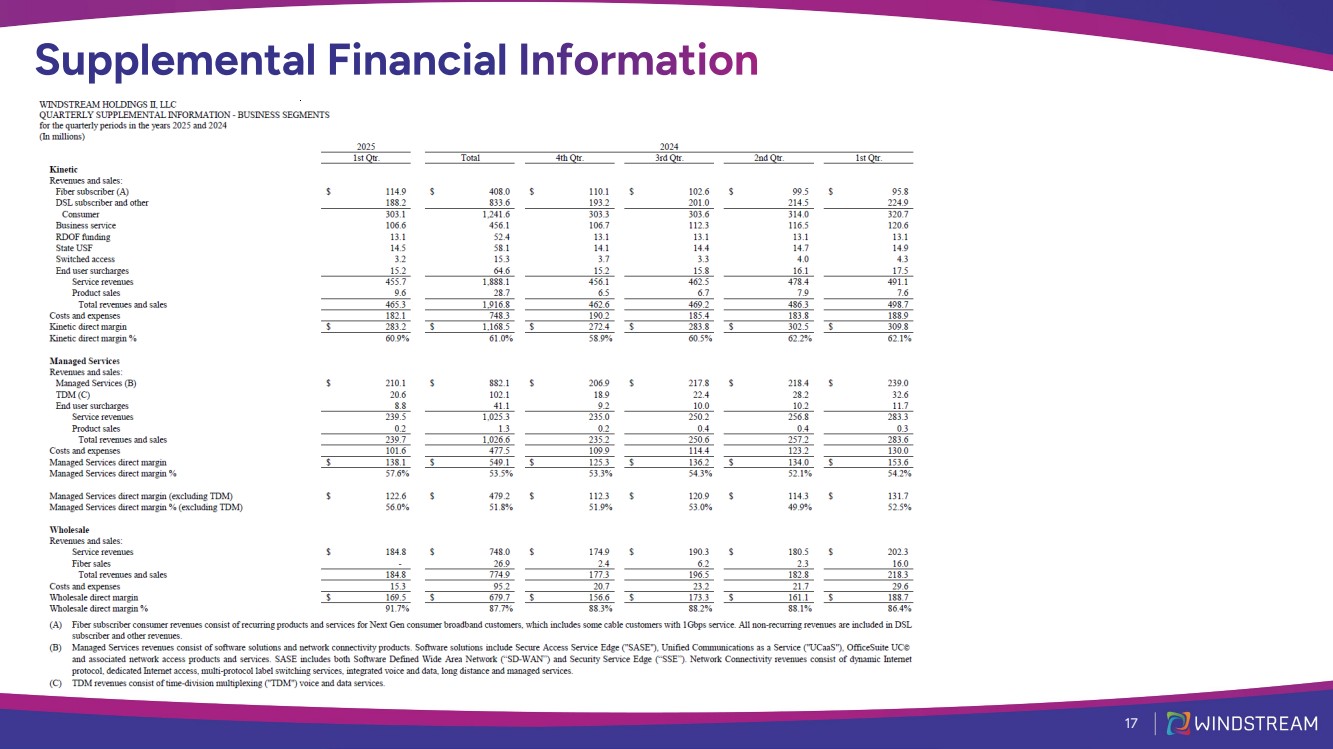
| 17 |
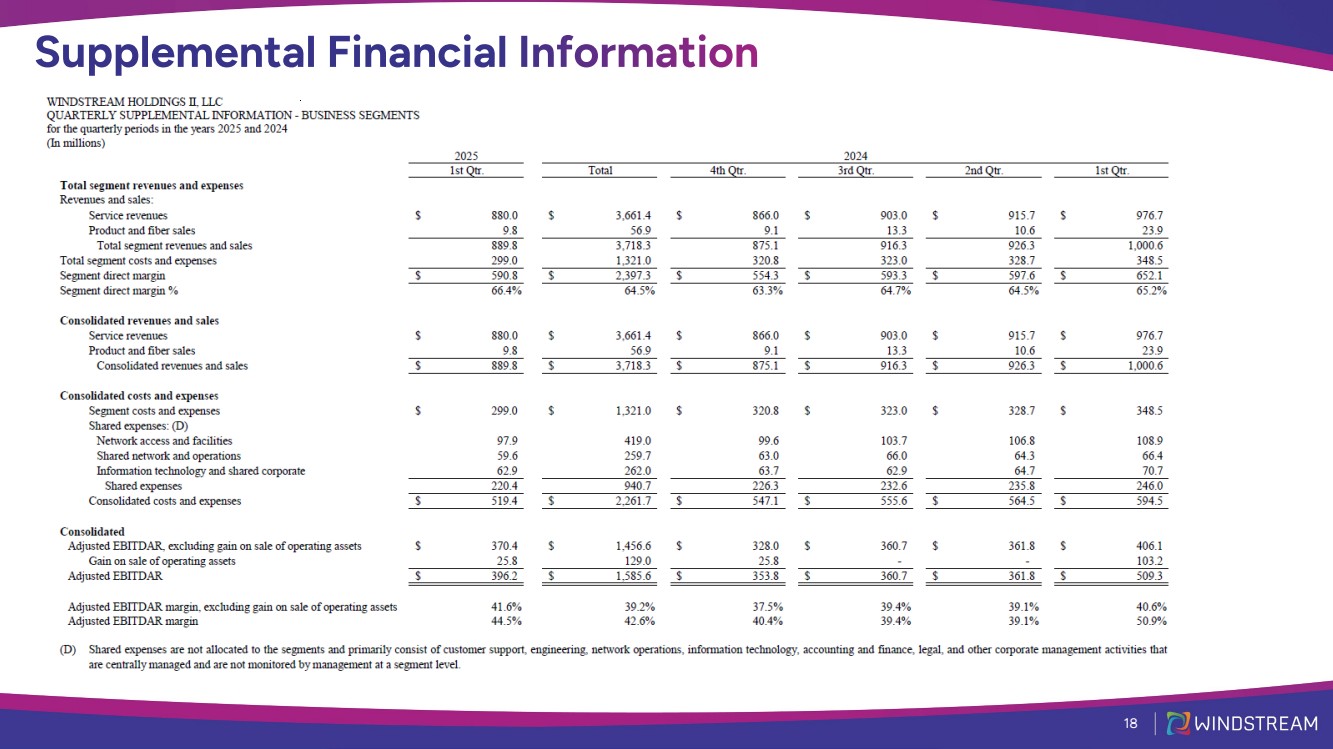
| 18 |
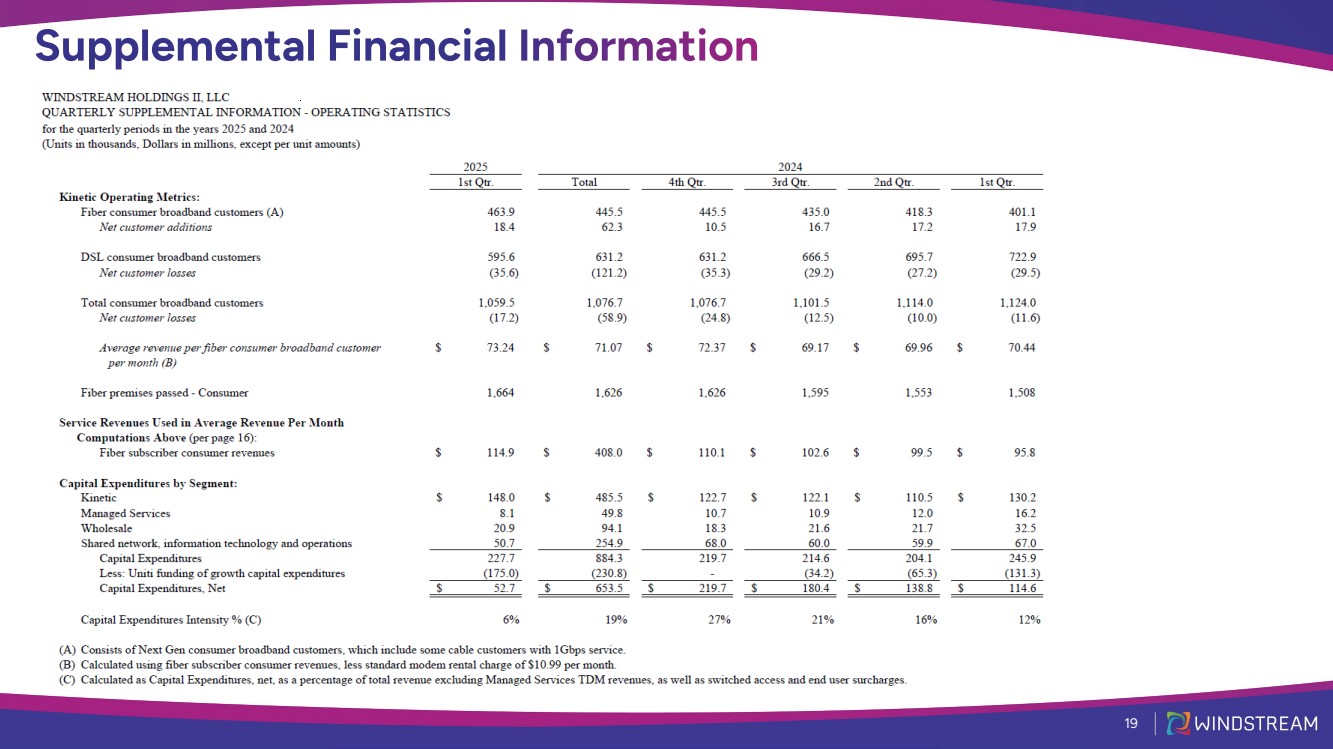
| 19 |
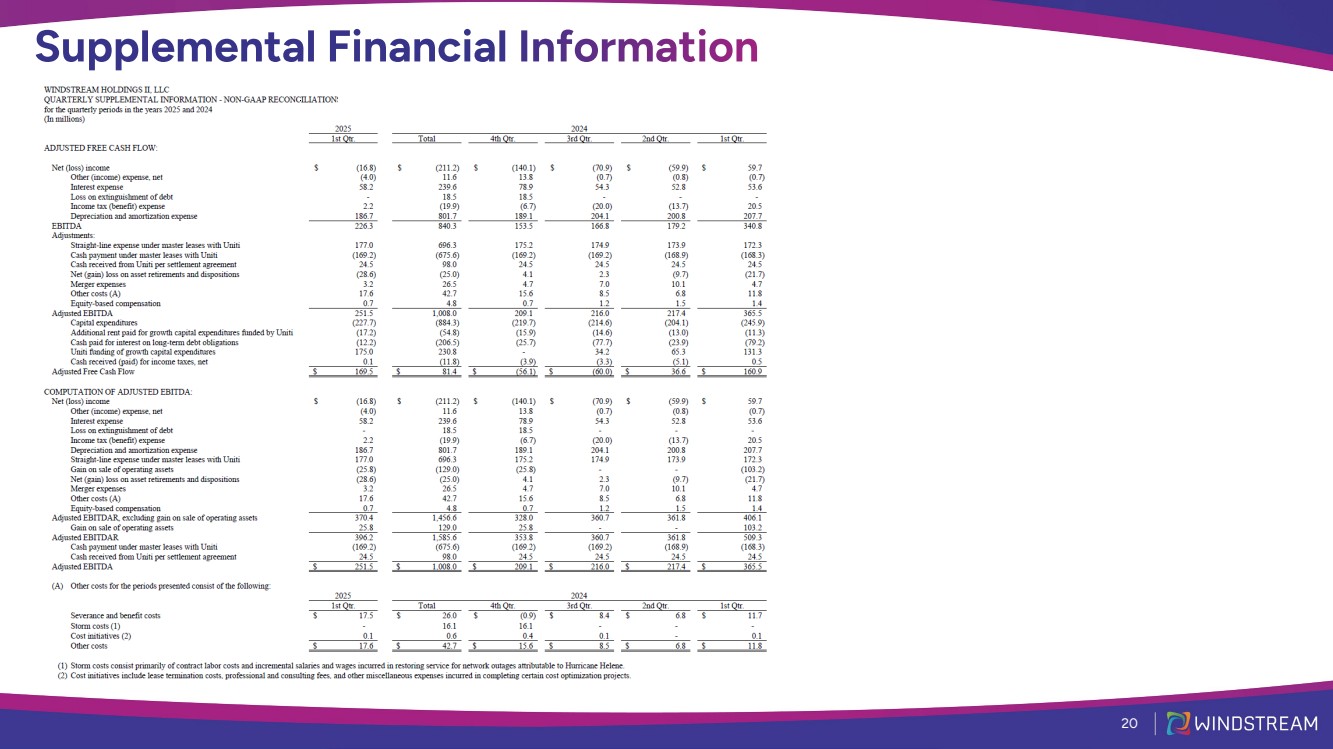
| 20 |
| 21 |