Pay vs Performance Disclosure - USD ($)
Feb. 01, 2025
Feb. 03, 2024
Jan. 28, 2023
Jan. 29, 2022
Jan. 30, 2021
Pay Versus Performance
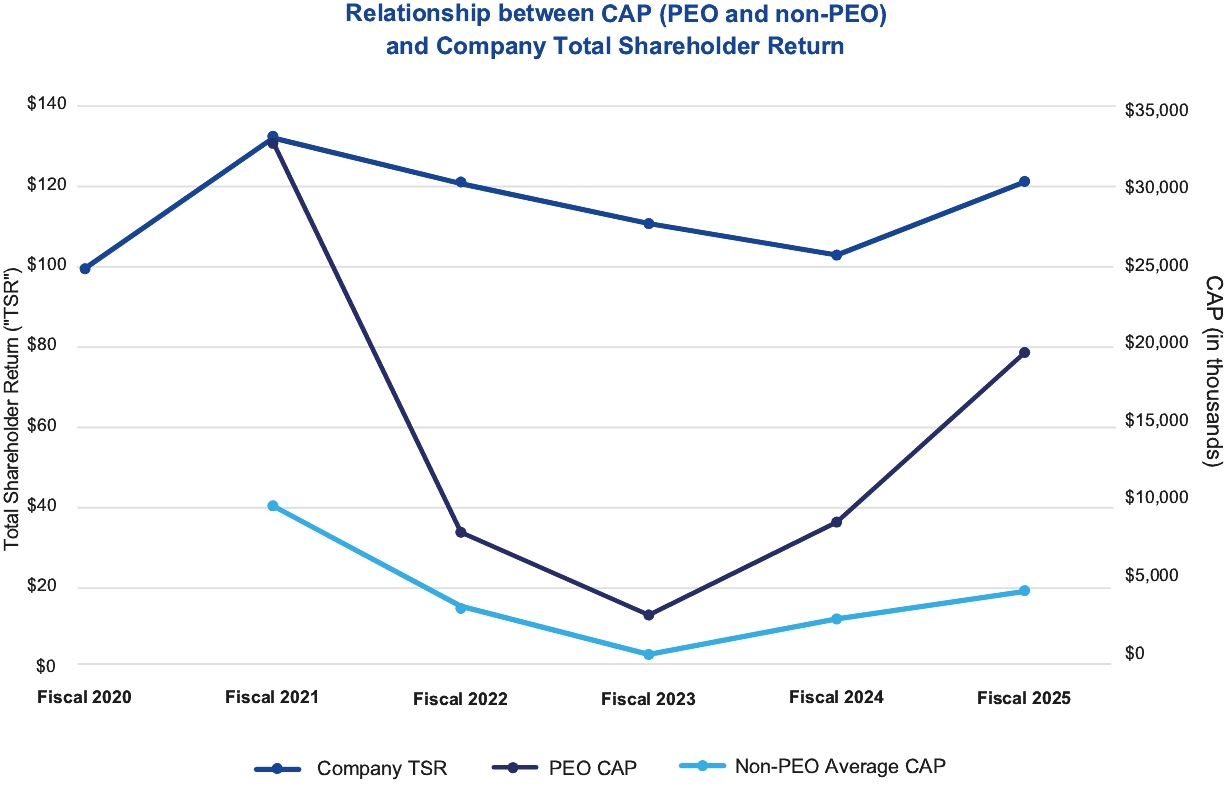
As required by Section 953(a) of the Dodd-Frank Wall Street Reform and Consumer Protection Act, and Item 402(v) of Regulation S-K (“Item 402(v)”), the Company is providing the following information regarding the relationship between the executive “Compensation Actually Paid” as defined in Item 402(v)) (“CAP”) by the Company and the financial performance of the Company over the applicable time period of the disclosure, calculated in a manner consistent with Item 402(v). For a more comprehensive description of our executive compensation program and the factors used by the Compensation Committee to determine pay for our NEOs, see the Compensation Discussion and Analysis section of this Proxy Statement. Accordingly, the table below provides information about CAP for the Company’s Principal Executive Officer (“PEO”) and the average CAP for our non-PEO NEOs alongside certain Company financial metrics during fiscal year 2025 and the four preceding fiscal years.
Fiscal Year | Summary Compensation Table Total to PEO(1) | Compensation Actually Paid to PEO(1)(2) | Average Summary Compensation Table Total for Non-PEO Named Executive Officers(3) | Average Compensation Actually Paid to Non-PEO Named Executive Officers(2)(3) | Value of Initial Fixed $100 Investment Based On: | Net Income (in millions)(6) | Company- Selected Measure: Compensable Enterprise Operating Income (in millions)(7) | |||||||||||||||||||
Company Total Shareholder Return(4) | Peer Group Total Shareholder Return(5) | |||||||||||||||||||||||||
(a) | (b) | (c) | (d) | (e) | (f) | (g) | (h) | (i) | ||||||||||||||||||
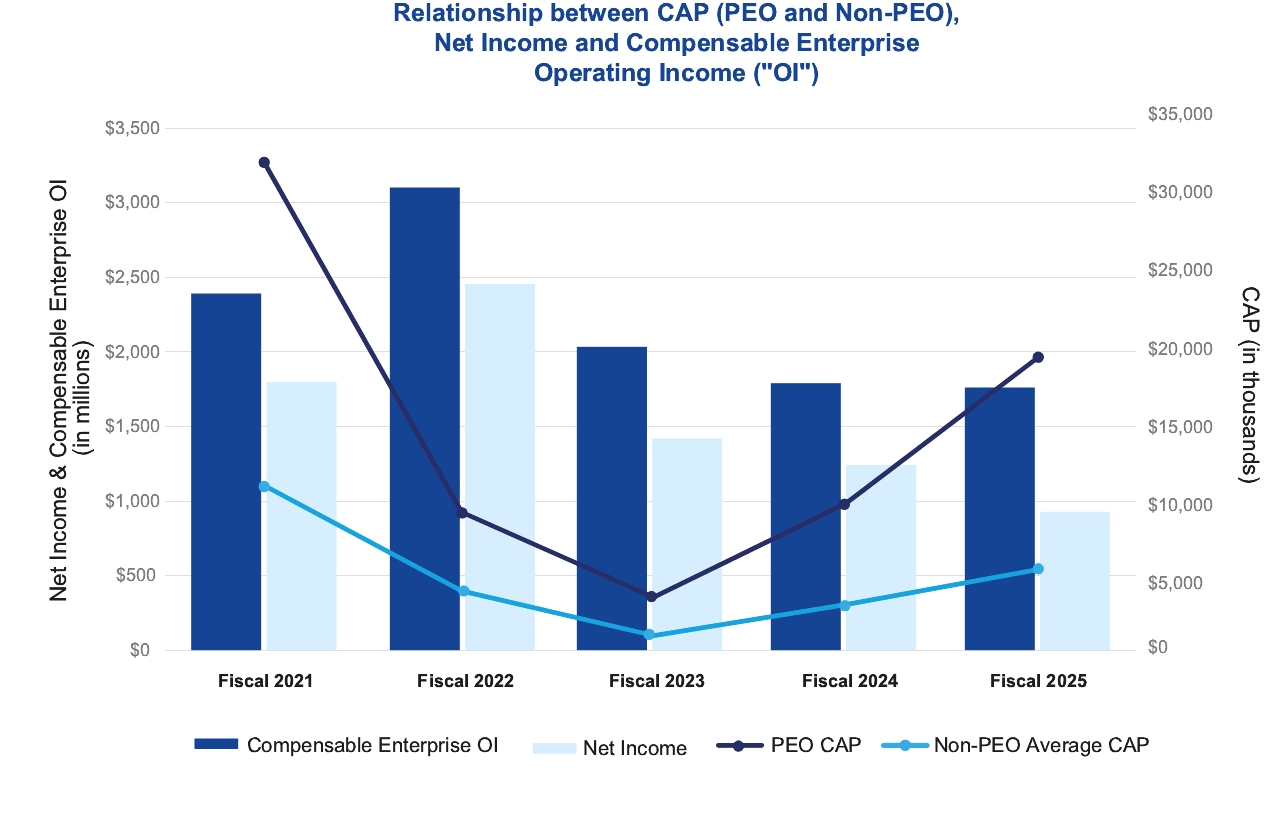
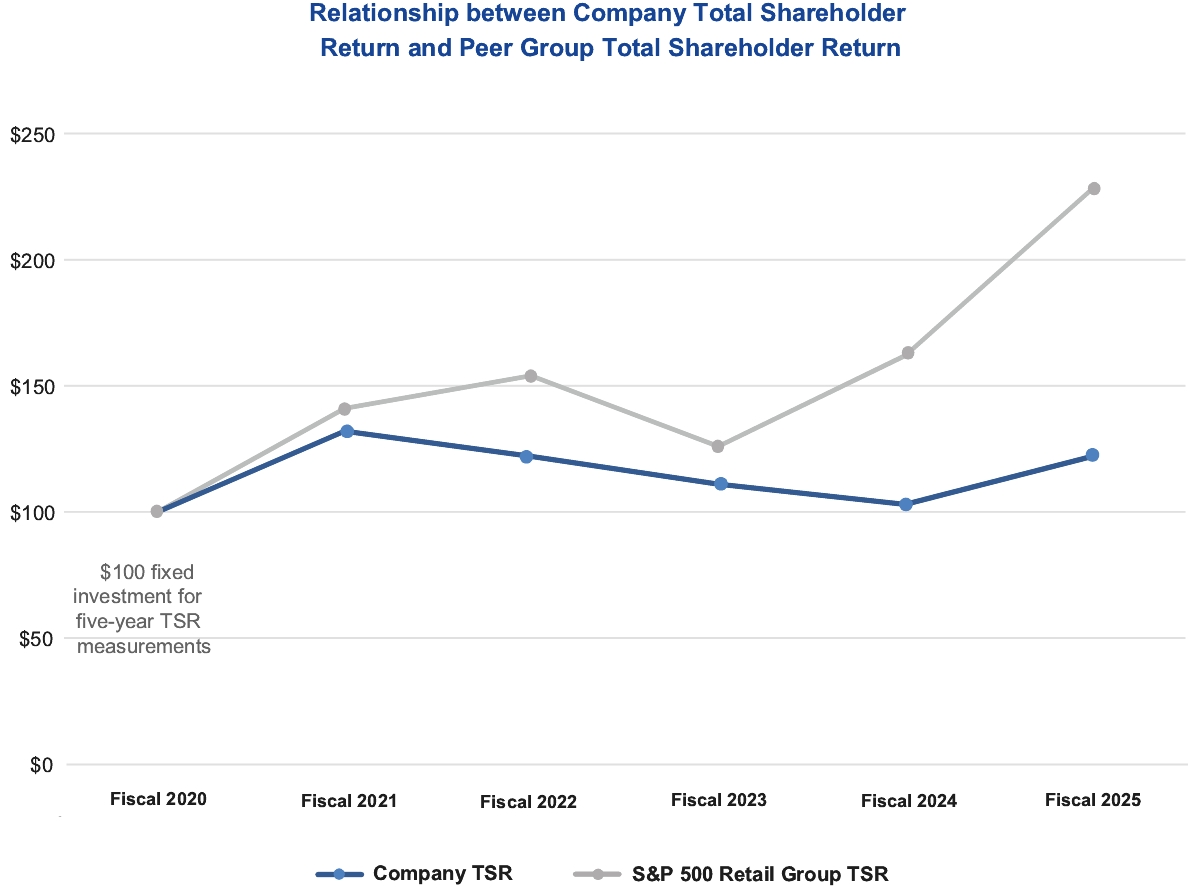
2025 | $16,150,300 | $19,506,431 | $4,348,182 | $5,002,463 | $122.43 | $227.91 | $927 | $1,761 | ||||||||||||||||||
2024* | 14,443,881 | 9,236,657 | 3,906,497 | 2,769,085 | 103.47 | 162.21 | 1,241 | 1,789 | ||||||||||||||||||
2023 | 12,837,677 | 3,250,029 | 2,924,691 | 790,759 | 110.85 | 125.62 | 1,419 | 2,033 | ||||||||||||||||||
2022 | 15,631,157 | 8,689,258 | 5,262,751 | 3,645,543 | 121.58 | 153.61 | 2,454 | 3,102 | ||||||||||||||||||
2021 | 12,033,503 | 32,672,565 | 4,581,159 | 10,201,286 | 132.06 | 141.39 | 1,798 | 2,391 | ||||||||||||||||||
* | There were 53 weeks in fiscal year 2024 as compared to 52 weeks in each of the other years shown. |
(1) | The PEO reflected in columns (b) and (c) was Ms. Barry for each of the fiscal years shown. For fiscal year 2025, see the Summary Compensation Table in this Proxy Statement. |
(2) | To calculate CAP, the following amounts were deducted from and added to Summary Compensation Table (“SCT”) total compensation for fiscal year 2025 for Ms. Barry as well as for our non-PEO NEOs in accordance with the requirements of Item 402(v)(2)(iii): |
Adjustments(x) | Fiscal Year 2025 | |||||||
PEO | Avg. Non- PEO NEOs | |||||||
Summary Compensation Table Total | $16,150,300 | $4,348,182 | ||||||
Deduct amounts reported in the Stock Awards and Option Awards column of Summary Compensation Table(y) | (12,500,197) | (2,400,107) | ||||||
Add fair value(z) of current year equity awards at end of current fiscal year | 14,439,764 | 2,755,914 | ||||||
Add change in fair value(z) of prior years' equity awards that remained unvested at end of current fiscal year | 1,843,718 | 344,878 | ||||||
Add change in fair value(z) of prior years' equity awards that vested during current fiscal year | (427,154) | (46,404) | ||||||
Deduct fair value(z) of prior years’ equity awards that failed to meet the applicable vesting conditions during the current fiscal year | — | — | ||||||
CAP Total | $19,506,431 | $5,002,463 | ||||||
(x) | All applicable adjustments are listed herein. Regarding those items referenced in Item 402(v) that are not reflected: (1) no equity awards were granted during fiscal year 2025 that vested within the same fiscal year; (2) dividend equivalent share accruals and vestings are not broken out separately as they are included in the fair value of the equity award to which they apply; (3) no equity awards were modified during fiscal year 2025; and (4) the company does not offer pension plans to U.S.-based employees. |
(y) | Reflects the grant date fair value of equity-based awards as discussed in the Summary Compensation Table and the Grants of Plan-Based Awards sections. |
(z) | Reflects the measurement date fair value of equity-based awards, measured in accordance with ASC Topic 718 and in accordance with the SEC’s methodology for determining CAP. The valuation methods and underlying assumptions are consistent with those disclosed in our financial statements as of the grant date for each award, including awards subject to performance conditions which are valued at the probable outcome of the award at each measurement date, and are further described in Note 1, Summary of Significant Accounting Policies, and Note 8, Shareholders’ Equity, of the Notes to Consolidated Financial Statements, included in Item 8, Financial Statements and Supplementary Data, of our Annual Report on Form 10-K for the fiscal year ended February 1, 2025. |
(3) | The non-PEO NEOs reflected in columns (d) and (e) represent the following individuals for each of the fiscal years shown: 2025 – Mr. Bilunas, Mr. Bonfig, Mr. Harmon, Ms. Scarlett; 2024 – Mr. Bilunas, Mr. Harmon, Mr. Hartman, and Ms. Scarlett; 2023 – Mr. Bilunas, Mr. Hartman, Ms. Scarlett, and Mr. Tilzer; 2022 – Mr. Bilunas, Mr. Bonfig, Mr. Harmon, and Ms. Scarlett; and 2021 – Mr. Bilunas, Mr. Hartman, Mr. Mohan, Ms. Scarlett, and Mr. Saksena, collectively, our non-PEO NEOs for each covered year as reported in the “Total” column of the Summary Compensation Table in this and prior years’ proxy statements. |
(4) | Total shareholder return as calculated based on a fixed investment of $100 in our Common Stock assuming reinvestment of dividends and measured from the market close on January 31, 2020 (the last trading day of our fiscal 2020) through and including the end of the fiscal year for each year reported in the table. |
(5) | Total shareholder return as calculated based on a fixed investment of $100 in the Standard & Poor (S&P) 500 Consumer Discretionary Distribution & Retail Index (the “S&P 500 Retail Group”), which is the peer group used for this Pay versus Performance analysis and of which the Company is a component, assuming reinvestment of dividends and measured from the market close on January 31, 2020 (the last trading day of our fiscal 2020) through and including the end of the fiscal year for each year reported in the table. |
(6) | As reported in the Annual Report for Form 10-K for the fiscal year ended February 1, 2025, these amounts reflect “Net Earnings” of the Company. |
(7) | For purposes of Item 402(v)(2)(iii), we have identified Compensable Enterprise Operating Income for the Company-selected measure reflected in column (i), which is based on adjusted operating income from continuing operations, adjusted as described in the Compensation Discussion and Analysis — Executive Compensation Elements — Short-Term Incentive section of the proxy statement for each fiscal year shown. Although Compensable Enterprise Operating Income is one important financial performance measure, among others, that the Compensation Committee considers when making executive compensation decisions with the intent of aligning compensation with Company performance and has been selected as the primary performance metric under our Short-Term Incentive Plan, the Compensation Committee has not historically and does not currently evaluate CAP as calculated pursuant to Item 402(v)(2) as part of its executive compensation determinations; accordingly, the Compensation Committee does not actually use any financial performance measure specifically to link executive CAP to Company performance. |
(1) | The PEO reflected in columns (b) and (c) was Ms. Barry for each of the fiscal years shown. For fiscal year 2025, see the Summary Compensation Table in this Proxy Statement. |
(3) | The non-PEO NEOs reflected in columns (d) and (e) represent the following individuals for each of the fiscal years shown: 2025 – Mr. Bilunas, Mr. Bonfig, Mr. Harmon, Ms. Scarlett; 2024 – Mr. Bilunas, Mr. Harmon, Mr. Hartman, and Ms. Scarlett; 2023 – Mr. Bilunas, Mr. Hartman, Ms. Scarlett, and Mr. Tilzer; 2022 – Mr. Bilunas, Mr. Bonfig, Mr. Harmon, and Ms. Scarlett; and 2021 – Mr. Bilunas, Mr. Hartman, Mr. Mohan, Ms. Scarlett, and Mr. Saksena, collectively, our non-PEO NEOs for each covered year as reported in the “Total” column of the Summary Compensation Table in this and prior years’ proxy statements. |
(5) | Total shareholder return as calculated based on a fixed investment of $100 in the Standard & Poor (S&P) 500 Consumer Discretionary Distribution & Retail Index (the “S&P 500 Retail Group”), which is the peer group used for this Pay versus Performance analysis and of which the Company is a component, assuming reinvestment of dividends and measured from the market close on January 31, 2020 (the last trading day of our fiscal 2020) through and including the end of the fiscal year for each year reported in the table. |
(2) | To calculate CAP, the following amounts were deducted from and added to Summary Compensation Table (“SCT”) total compensation for fiscal year 2025 for Ms. Barry as well as for our non-PEO NEOs in accordance with the requirements of Item 402(v)(2)(iii): |
Adjustments(x) | Fiscal Year 2025 | |||||||
PEO | Avg. Non- PEO NEOs | |||||||
Summary Compensation Table Total | $16,150,300 | $4,348,182 | ||||||
Deduct amounts reported in the Stock Awards and Option Awards column of Summary Compensation Table(y) | (12,500,197) | (2,400,107) | ||||||
Add fair value(z) of current year equity awards at end of current fiscal year | 14,439,764 | 2,755,914 | ||||||
Add change in fair value(z) of prior years' equity awards that remained unvested at end of current fiscal year | 1,843,718 | 344,878 | ||||||
Add change in fair value(z) of prior years' equity awards that vested during current fiscal year | (427,154) | (46,404) | ||||||
Deduct fair value(z) of prior years’ equity awards that failed to meet the applicable vesting conditions during the current fiscal year | — | — | ||||||
CAP Total | $19,506,431 | $5,002,463 | ||||||
(x) | All applicable adjustments are listed herein. Regarding those items referenced in Item 402(v) that are not reflected: (1) no equity awards were granted during fiscal year 2025 that vested within the same fiscal year; (2) dividend equivalent share accruals and vestings are not broken out separately as they are included in the fair value of the equity award to which they apply; (3) no equity awards were modified during fiscal year 2025; and (4) the company does not offer pension plans to U.S.-based employees. |
(y) | Reflects the grant date fair value of equity-based awards as discussed in the Summary Compensation Table and the Grants of Plan-Based Awards sections. |
(z) | Reflects the measurement date fair value of equity-based awards, measured in accordance with ASC Topic 718 and in accordance with the SEC’s methodology for determining CAP. The valuation methods and underlying assumptions are consistent with those disclosed in our financial statements as of the grant date for each award, including awards subject to performance conditions which are valued at the probable outcome of the award at each measurement date, and are further described in Note 1, Summary of Significant Accounting Policies, and Note 8, Shareholders’ Equity, of the Notes to Consolidated Financial Statements, included in Item 8, Financial Statements and Supplementary Data, of our Annual Report on Form 10-K for the fiscal year ended February 1, 2025. |
Tabular List of Most Important Performance Measures
In accordance with the requirements of Item 402(v)(6), we have identified an unranked list of the most important financial performance measures, which represent the most important financial metrics used by the Company to link fiscal 2025 CAP, for our PEO and other NEOs, to Company performance. These metrics are described further under the Compensation Discussion and Analysis — Executive Compensation Elements section, specifically under the subheadings “Short-Term Incentive” and “Long-Term Incentive.”
Most Important Performance Measures | |||||
• | Compensable Enterprise Operating Income | ||||
• | Compensable Enterprise Revenue | ||||
• | Relative TSR | ||||
As noted above in this section, the Compensation Committee has not historically and does not currently evaluate CAP as calculated pursuant to Item 402(v)(2) as part of its executive compensation determinations; accordingly, the Compensation Committee does not actually use any financial or non-financial performance measures specifically to link NEO CAP to Company performance.
All information provided above under the “Pay Versus Performance” heading will not be deemed to be incorporated by reference in any filing of our Company under the Securities Act of 1933, as amended, whether made before or after the date hereof and irrespective of any general incorporation language in any such filing.
(7) | For purposes of Item 402(v)(2)(iii), we have identified Compensable Enterprise Operating Income for the Company-selected measure reflected in column (i), which is based on adjusted operating income from continuing operations, adjusted as described in the Compensation Discussion and Analysis — Executive Compensation Elements — Short-Term Incentive section of the proxy statement for each fiscal year shown. Although Compensable Enterprise Operating Income is one important financial performance measure, among others, that the Compensation Committee considers when making executive compensation decisions with the intent of aligning compensation with Company performance and has been selected as the primary performance metric under our Short-Term Incentive Plan, the Compensation Committee has not historically and does not currently evaluate CAP as calculated pursuant to Item 402(v)(2) as part of its executive compensation determinations; accordingly, the Compensation Committee does not actually use any financial performance measure specifically to link executive CAP to Company performance. |