Shareholder Report
Feb. 28, 2025
USD ($)
Holding
What Were The Fund Costs For The Last Six Months ?
(Based on a hypothetical $10,000 investment)
| Fund | Costs of a $10,000 investment | Costs paid as a percentage of a $10,000 investment* |
| Invesco Equal Weight 0-30 Year Treasury ETF | $7 | 0.15% |
| * |
Annualized.
|
What Are Key Statistics About The Fund?
(as of February 28, 2025)
| Fund net assets | $1,049,900,096 |
| Total number of portfolio holdings | 31 |
| Portfolio turnover rate | 11% |
What Comprised The Fund's Holdings?
(as of February 28, 2025)
Top ten holdings*
(% of net assets)
(% of net assets)
| U.S. Treasury Bonds, 2.25%, 02/15/2052 | 3.35% |
| U.S. Treasury Bonds, 1.88%, 02/15/2051 | 3.35% |
| U.S. Treasury Bonds, 2.00%, 02/15/2050 | 3.35% |
| U.S. Treasury Bonds, 4.63%, 02/15/2055 | 3.35% |
| U.S. Treasury Bonds, 3.63%, 02/15/2053 | 3.35% |
| U.S. Treasury Bonds, 4.25%, 02/15/2054 | 3.35% |
| U.S. Treasury Bonds, 3.00%, 02/15/2049 | 3.34% |
| U.S. Treasury Bonds, 3.00%, 02/15/2048 | 3.34% |
| U.S. Treasury Bonds, 3.00%, 02/15/2047 | 3.34% |
| U.S. Treasury Bonds, 2.50%, 02/15/2046 | 3.34% |
| * Excluding money market fund holdings, if any. |
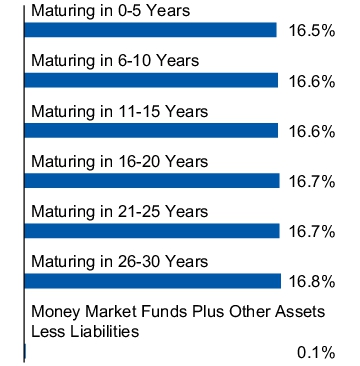
Duration allocation
(% of net assets)
(% of net assets)
Top ten holdings*
(% of net assets)
(% of net assets)
| U.S. Treasury Bonds, 2.25%, 02/15/2052 | 3.35% |
| U.S. Treasury Bonds, 1.88%, 02/15/2051 | 3.35% |
| U.S. Treasury Bonds, 2.00%, 02/15/2050 | 3.35% |
| U.S. Treasury Bonds, 4.63%, 02/15/2055 | 3.35% |
| U.S. Treasury Bonds, 3.63%, 02/15/2053 | 3.35% |
| U.S. Treasury Bonds, 4.25%, 02/15/2054 | 3.35% |
| U.S. Treasury Bonds, 3.00%, 02/15/2049 | 3.34% |
| U.S. Treasury Bonds, 3.00%, 02/15/2048 | 3.34% |
| U.S. Treasury Bonds, 3.00%, 02/15/2047 | 3.34% |
| U.S. Treasury Bonds, 2.50%, 02/15/2046 | 3.34% |
| * Excluding money market fund holdings, if any. |
What Were The Fund Costs For The Last Six Months ?
(Based on a hypothetical $10,000 investment)
| Fund | Costs of a $10,000 investment | Costs paid as a percentage of a $10,000 investment* |
| Invesco Preferred ETF | $25 | 0.50% |
| * |
Annualized.
|
What Are Key Statistics About The Fund?
(as of February 28, 2025)
| Fund net assets | $4,308,766,775 |
| Total number of portfolio holdings | 261 |
| Portfolio turnover rate | 4% |
What Comprised The Fund's Holdings?
(as of February 28, 2025)
Top ten holdings*
(% of net assets)
(% of net assets)
| JPMorgan Chase & Co., Series EE, Pfd., 6.00% | 1.77% |
| JPMorgan Chase & Co., Series DD, Pfd., 5.75% | 1.60% |
| Wells Fargo & Co., Series Z, Pfd., 4.75% | 1.56% |
| JPMorgan Chase & Co., Series MM, Pfd., 4.20% | 1.45% |
| JPMorgan Chase & Co., Series LL, Pfd., 4.63% | 1.45% |
| AT&T, Inc., Series C, Pfd., 4.75% | 1.31% |
| Bank of America Corp., Series GG, Pfd., 6.00% | 1.30% |
| Bank of America Corp., Series KK, Pfd., 5.38% | 1.25% |
| AT&T, Inc., Pfd., 5.35% 11/01/2066 | 1.19% |
| JPMorgan Chase & Co., Series JJ, Pfd., 4.55% | 1.16% |
| * Excluding money market fund holdings, if any. |
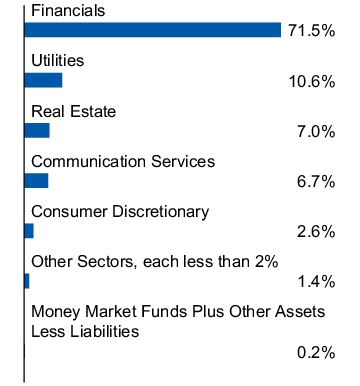
Sector allocation
(% of net assets)
(% of net assets)
Top ten holdings*
(% of net assets)
(% of net assets)
| JPMorgan Chase & Co., Series EE, Pfd., 6.00% | 1.77% |
| JPMorgan Chase & Co., Series DD, Pfd., 5.75% | 1.60% |
| Wells Fargo & Co., Series Z, Pfd., 4.75% | 1.56% |
| JPMorgan Chase & Co., Series MM, Pfd., 4.20% | 1.45% |
| JPMorgan Chase & Co., Series LL, Pfd., 4.63% | 1.45% |
| AT&T, Inc., Series C, Pfd., 4.75% | 1.31% |
| Bank of America Corp., Series GG, Pfd., 6.00% | 1.30% |
| Bank of America Corp., Series KK, Pfd., 5.38% | 1.25% |
| AT&T, Inc., Pfd., 5.35% 11/01/2066 | 1.19% |
| JPMorgan Chase & Co., Series JJ, Pfd., 4.55% | 1.16% |
| * Excluding money market fund holdings, if any. |
What Were The Fund Costs For The Last Six Months ?
(Based on a hypothetical $10,000 investment)
| Fund | Costs of a $10,000 investment | Costs paid as a percentage of a $10,000 investment* |
| Invesco Fundamental High Yield® Corporate Bond ETF | $25 | 0.50% |
| * |
Annualized. |
What Are Key Statistics About The Fund?
(as of February 28, 2025)
| Fund net assets | $332,873,166 |
| Total number of portfolio holdings | 262 |
| Portfolio turnover rate | 17% |
What Comprised The Fund's Holdings?
(as of February 28, 2025)
Top ten holdings*
(% of net assets)
(% of net assets)
| Synchrony Financial, 7.25%, 02/02/2033 | 1.21% |
| United AirLines, Inc., 4.63%, 04/15/2029 | 1.10% |
| Windsor Holdings III LLC, 8.50%, 06/15/2030 | 0.99% |
| Ford Motor Credit Co. LLC, 3.38%, 11/13/2025 | 0.99% |
| Ford Motor Co., 3.25%, 02/12/2032 | 0.98% |
| PG&E Corp., 5.25%, 07/01/2030 | 0.87% |
| Walgreens Boots Alliance, Inc., 3.45%, 06/01/2026 | 0.85% |
| Tenet Healthcare Corp., 6.13%, 06/15/2030 | 0.81% |
| Walgreens Boots Alliance, Inc., 3.20%, 04/15/2030 | 0.80% |
| DPL, Inc., 4.13%, 07/01/2025 | 0.80% |
| * Excluding money market fund holdings, if any. |
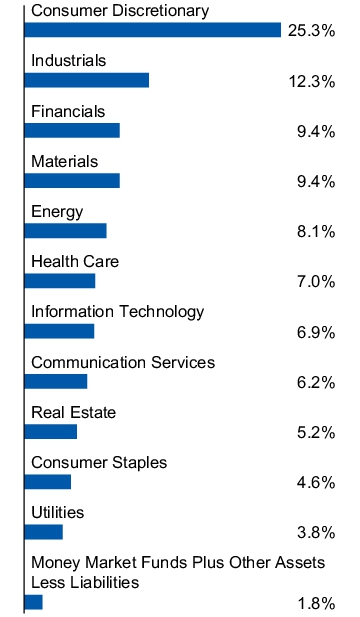
Sector allocation
(% of net assets)
(% of net assets)
Top ten holdings*
(% of net assets)
(% of net assets)
| Synchrony Financial, 7.25%, 02/02/2033 | 1.21% |
| United AirLines, Inc., 4.63%, 04/15/2029 | 1.10% |
| Windsor Holdings III LLC, 8.50%, 06/15/2030 | 0.99% |
| Ford Motor Credit Co. LLC, 3.38%, 11/13/2025 | 0.99% |
| Ford Motor Co., 3.25%, 02/12/2032 | 0.98% |
| PG&E Corp., 5.25%, 07/01/2030 | 0.87% |
| Walgreens Boots Alliance, Inc., 3.45%, 06/01/2026 | 0.85% |
| Tenet Healthcare Corp., 6.13%, 06/15/2030 | 0.81% |
| Walgreens Boots Alliance, Inc., 3.20%, 04/15/2030 | 0.80% |
| DPL, Inc., 4.13%, 07/01/2025 | 0.80% |
| * Excluding money market fund holdings, if any. |
What Were The Fund Costs For The Last Six Months ?
(Based on a hypothetical $10,000 investment)
| Fund | Costs of a $10,000 investment | Costs paid as a percentage of a $10,000 investment* |
| Invesco National AMT-Free Municipal Bond ETF | $14 | 0.28% |
| * |
Annualized.
|
What Are Key Statistics About The Fund?
(as of February 28, 2025)
| Fund net assets | $3,122,085,403 |
| Total number of portfolio holdings | 3,269 |
| Portfolio turnover rate | 0% |
What Comprised The Fund's Holdings?
(as of February 28, 2025)
Top ten holdings
(% of net assets)
(% of net assets)
| Massachusetts (Commonwealth of), Series 2022 E, GO Bonds, 5.00%, 11/01/2048 | 0.59% |
| San Diego Unified School District (Election of 2012), Series 2020 M-2, GO Bonds, 4.00%, 07/01/2050 | 0.45% |
| Colorado (State of) Health Facilities Authority (Adventhealth Obligated Group), Series 2021 A, Ref. RB, 4.00%, 11/15/2050 | 0.45% |
| California (State of), Series 2023, Ref. GO Bonds, 5.00%, 09/01/2043 | 0.36% |
| Grand Parkway Transportation Corp. (TELA Supported), Series 2018 A, RB, 5.00%, 10/01/2043 | 0.34% |
| Triborough Bridge & Tunnel Authority (MTA Bridges & Tunnels), Series 2017 C-2, RB, 5.00%, 11/15/2042 | 0.32% |
| New York (City of), NY Municipal Water Finance Authority, Series 2021 BB-1, Ref. RB, 5.00%, 06/15/2044 | 0.31% |
| Licking Heights Local School District, Series 2022, GO Bonds, 5.50%, 10/01/2059 | 0.31% |
| Baltimore (City of), MD (Water), Series 2017 A, RB, 5.00%, 07/01/2046 | 0.31% |
| University of California, Series 2016 AR, Ref. RB, 5.00%, 05/15/2046 | 0.31% |
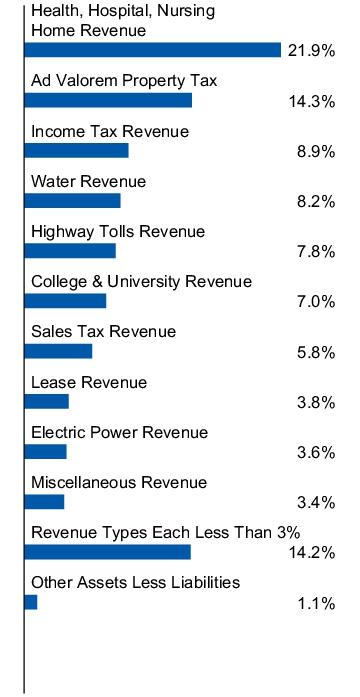
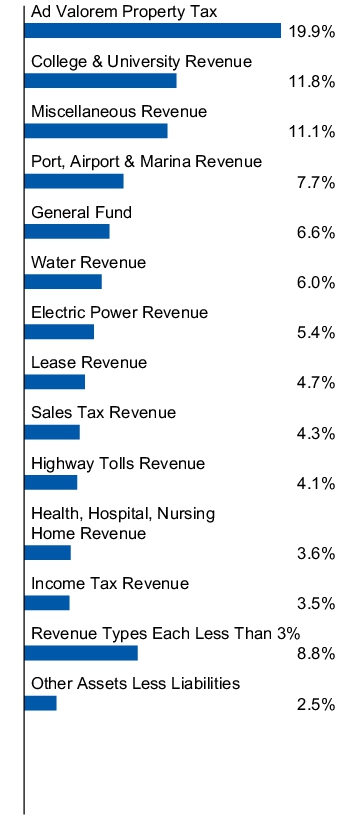
Revenue type allocation
(% of net assets)
(% of net assets)
Top ten holdings
(% of net assets)
(% of net assets)
| Massachusetts (Commonwealth of), Series 2022 E, GO Bonds, 5.00%, 11/01/2048 | 0.59% |
| San Diego Unified School District (Election of 2012), Series 2020 M-2, GO Bonds, 4.00%, 07/01/2050 | 0.45% |
| Colorado (State of) Health Facilities Authority (Adventhealth Obligated Group), Series 2021 A, Ref. RB, 4.00%, 11/15/2050 | 0.45% |
| California (State of), Series 2023, Ref. GO Bonds, 5.00%, 09/01/2043 | 0.36% |
| Grand Parkway Transportation Corp. (TELA Supported), Series 2018 A, RB, 5.00%, 10/01/2043 | 0.34% |
| Triborough Bridge & Tunnel Authority (MTA Bridges & Tunnels), Series 2017 C-2, RB, 5.00%, 11/15/2042 | 0.32% |
| New York (City of), NY Municipal Water Finance Authority, Series 2021 BB-1, Ref. RB, 5.00%, 06/15/2044 | 0.31% |
| Licking Heights Local School District, Series 2022, GO Bonds, 5.50%, 10/01/2059 | 0.31% |
| Baltimore (City of), MD (Water), Series 2017 A, RB, 5.00%, 07/01/2046 | 0.31% |
| University of California, Series 2016 AR, Ref. RB, 5.00%, 05/15/2046 | 0.31% |
What Were The Fund Costs For The Last Six Months ?
(Based on a hypothetical $10,000 investment)
| Fund | Costs of a $10,000 investment | Costs paid as a percentage of a $10,000 investment* |
| Invesco Taxable Municipal Bond ETF | $14 | 0.28% |
| * |
Annualized. |
What Are Key Statistics About The Fund?
(as of February 28, 2025)
| Fund net assets | $982,967,405 |
| Total number of portfolio holdings | 628 |
| Portfolio turnover rate | 3% |
What Comprised The Fund's Holdings?
(as of February 28, 2025)
Top ten holdings
(% of net assets)
(% of net assets)
| California (State of), Series 2009, GO Bonds, 7.55%, 04/01/2039 | 1.32% |
| Illinois (State of), Series 2010 2, GO Bonds, 6.90%, 03/01/2035 | 1.03% |
| Board of Regents of the University of Texas System, Series 2010 C, RB, 4.64%, 08/15/2030 | 1.01% |
| California (State of), Series 2009, GO Bonds, 7.35%, 11/01/2039 | 0.99% |
| Metro, Series 2019, GO Bonds, 3.25%, 06/01/2028 | 0.99% |
| California (State of), Series 2010, GO Bonds, 7.60%, 11/01/2040 | 0.91% |
| New York (City of), NY, Series 2010 G-1, GO Bonds, 5.97%, 03/01/2036 | 0.90% |
| California (State of), Series 2009, GO Bonds, 7.50%, 04/01/2034 | 0.88% |
| California (State of), Series 2023, GO Bonds, 5.10%, 03/01/2029 | 0.84% |
| Massachusetts (Commonwealth of), Series 2010 A, GO Bonds, 4.91%, 05/01/2029 | 0.80% |
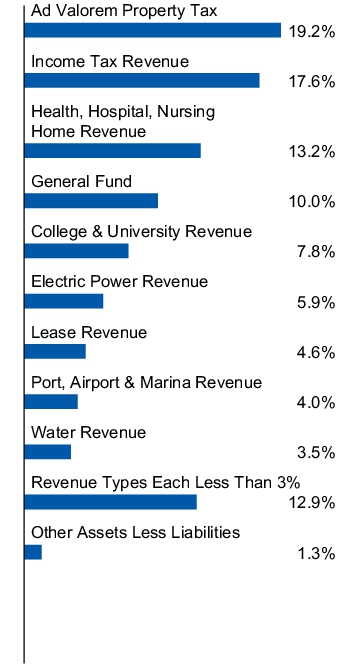
Revenue type allocation
(% of net assets)
(% of net assets)
Top ten holdings
(% of net assets)
(% of net assets)
| California (State of), Series 2009, GO Bonds, 7.55%, 04/01/2039 | 1.32% |
| Illinois (State of), Series 2010 2, GO Bonds, 6.90%, 03/01/2035 | 1.03% |
| Board of Regents of the University of Texas System, Series 2010 C, RB, 4.64%, 08/15/2030 | 1.01% |
| California (State of), Series 2009, GO Bonds, 7.35%, 11/01/2039 | 0.99% |
| Metro, Series 2019, GO Bonds, 3.25%, 06/01/2028 | 0.99% |
| California (State of), Series 2010, GO Bonds, 7.60%, 11/01/2040 | 0.91% |
| New York (City of), NY, Series 2010 G-1, GO Bonds, 5.97%, 03/01/2036 | 0.90% |
| California (State of), Series 2009, GO Bonds, 7.50%, 04/01/2034 | 0.88% |
| California (State of), Series 2023, GO Bonds, 5.10%, 03/01/2029 | 0.84% |
| Massachusetts (Commonwealth of), Series 2010 A, GO Bonds, 4.91%, 05/01/2029 | 0.80% |
What Were The Fund Costs For The Last Six Months ?
(Based on a hypothetical $10,000 investment)
| Fund | Costs of a $10,000 investment | Costs paid as a percentage of a $10,000 investment* |
| Invesco California AMT-Free Municipal Bond ETF | $14 | 0.28% |
| * |
Annualized. |
What Are Key Statistics About The Fund?
(as of February 28, 2025)
| Fund net assets | $724,107,226 |
| Total number of portfolio holdings | 667 |
| Portfolio turnover rate | 1% |
What Comprised The Fund's Holdings?
(as of February 28, 2025)
Top ten holdings
(% of net assets)
(% of net assets)
| California (State of) Health Facilities Financing Authority (Kaiser Permanente), Subseries 2017 A-2, RB, 5.00%, 11/01/2047 | 0.96% |
| California (State of) Health Facilities Financing Authority (Kaiser Permanente), Subseries 2017 A-2, RB, 4.00%, 11/01/2044 | 0.95% |
| Regents of the University of California Medical Center, Series 2022 P, RB, 5.00%, 05/15/2047 | 0.77% |
| California (State of) Health Facilities Financing Authority (Cedars-Sinai Medical Center), Series 2021 A, Ref. RB, 4.00%, 08/15/2048 | 0.73% |
| Los Angeles Unified School District, Series 2020 RYQ, GO Bonds, 4.00%, 07/01/2044 | 0.71% |
| Sacramento (City of), CA Area Flood Control Agency (Consolidated Capital Assessment District No.2), Series 2016, Ref. RB, 5.00%, 10/01/2047 | 0.71% |
| California (State of) Educational Facilities Authority (Stanford University), Series 2019 V-1, RB, 5.00%, 05/01/2049 | 0.70% |
| San Diego Unified School District (Election of 2012), Series 2019 L, GO Bonds, 4.00%, 07/01/2049 | 0.63% |
| California (State of), Series 2023, Ref. GO Bonds, 5.00%, 10/01/2042 | 0.63% |
| Sacramento (City of), CA Municipal Utility District (Green Bonds), Series 2020 H, RB, 5.00%, 08/15/2050 | 0.58% |
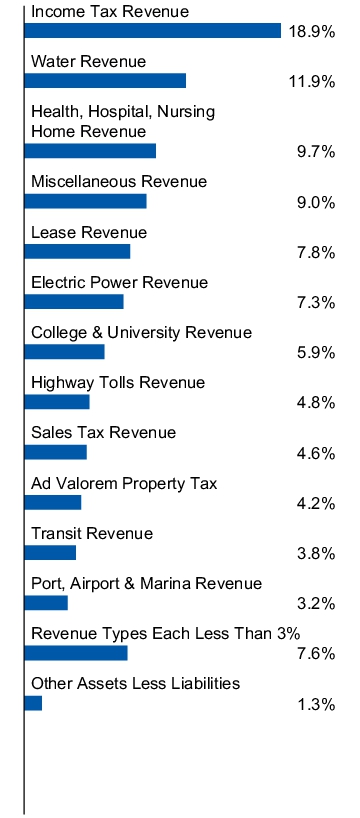
Revenue type allocation
(% of net assets)
(% of net assets)
Top ten holdings
(% of net assets)
(% of net assets)
| California (State of) Health Facilities Financing Authority (Kaiser Permanente), Subseries 2017 A-2, RB, 5.00%, 11/01/2047 | 0.96% |
| California (State of) Health Facilities Financing Authority (Kaiser Permanente), Subseries 2017 A-2, RB, 4.00%, 11/01/2044 | 0.95% |
| Regents of the University of California Medical Center, Series 2022 P, RB, 5.00%, 05/15/2047 | 0.77% |
| California (State of) Health Facilities Financing Authority (Cedars-Sinai Medical Center), Series 2021 A, Ref. RB, 4.00%, 08/15/2048 | 0.73% |
| Los Angeles Unified School District, Series 2020 RYQ, GO Bonds, 4.00%, 07/01/2044 | 0.71% |
| Sacramento (City of), CA Area Flood Control Agency (Consolidated Capital Assessment District No.2), Series 2016, Ref. RB, 5.00%, 10/01/2047 | 0.71% |
| California (State of) Educational Facilities Authority (Stanford University), Series 2019 V-1, RB, 5.00%, 05/01/2049 | 0.70% |
| San Diego Unified School District (Election of 2012), Series 2019 L, GO Bonds, 4.00%, 07/01/2049 | 0.63% |
| California (State of), Series 2023, Ref. GO Bonds, 5.00%, 10/01/2042 | 0.63% |
| Sacramento (City of), CA Municipal Utility District (Green Bonds), Series 2020 H, RB, 5.00%, 08/15/2050 | 0.58% |
What Were The Fund Costs For The Last Six Months ?
(Based on a hypothetical $10,000 investment)
| Fund | Costs of a $10,000 investment | Costs paid as a percentage of a $10,000 investment* |
| Invesco New York AMT-Free Municipal Bond ETF | $14 | 0.28% |
| * |
Annualized. |
What Are Key Statistics About The Fund?
(as of February 28, 2025)
| Fund net assets | $139,392,170 |
| Total number of portfolio holdings | 409 |
| Portfolio turnover rate | 3% |
What Comprised The Fund's Holdings?
(as of February 28, 2025)
Top ten holdings
(% of net assets)
(% of net assets)
| New York (State of) Power Authority (Green Transmission) (Green Bonds), Series 2022, RB, 4.00%, 11/15/2052 | 2.75% |
| Battery Park (City of), NY Authority (Green Bonds), Series 2019 A, RB, 5.00%, 11/01/2049 | 1.89% |
| Triborough Bridge & Tunnel Authority (MTA Bridges & Tunnels), Series 2021 A, RB, 5.00%, 11/15/2051 | 1.89% |
| New York (State of) Dormitory Authority (Bidding Group 3), Series 2017 B, Ref. RB, 4.00%, 02/15/2044 | 1.75% |
| Triborough Bridge & Tunnel Authority (MTA Bridges & Tunnels), Series 2022 A, Ref. RB, 5.00%, 05/15/2047 | 1.63% |
| New York (City of), NY Municipal Water Finance Authority, Series 2021 AA-1, RB, 5.00%, 06/15/2048 | 1.51% |
| Long Island (City of), NY Power Authority, Series 2016 B, Ref. RB, 5.00%, 09/01/2041 | 1.47% |
| New York Convention Center Development Corp. (Hotel Unit Fee Secured), Series 2015, Ref. RB, 5.00%, 11/15/2045 | 1.44% |
| New York (City of), NY Municipal Water Finance Authority, Series 2023 D, Ref. RB, 4.13%, 06/15/2047 | 1.43% |
| New York State Urban Development Corp. (Bidding Group 3), Series 2019 A, Ref. RB, 4.00%, 03/15/2044 | 1.40% |
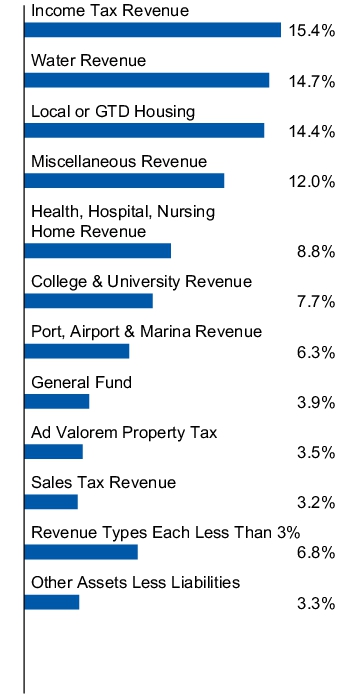
Revenue type allocation
(% of net assets)
(% of net assets)
Top ten holdings
(% of net assets)
(% of net assets)
| New York (State of) Power Authority (Green Transmission) (Green Bonds), Series 2022, RB, 4.00%, 11/15/2052 | 2.75% |
| Battery Park (City of), NY Authority (Green Bonds), Series 2019 A, RB, 5.00%, 11/01/2049 | 1.89% |
| Triborough Bridge & Tunnel Authority (MTA Bridges & Tunnels), Series 2021 A, RB, 5.00%, 11/15/2051 | 1.89% |
| New York (State of) Dormitory Authority (Bidding Group 3), Series 2017 B, Ref. RB, 4.00%, 02/15/2044 | 1.75% |
| Triborough Bridge & Tunnel Authority (MTA Bridges & Tunnels), Series 2022 A, Ref. RB, 5.00%, 05/15/2047 | 1.63% |
| New York (City of), NY Municipal Water Finance Authority, Series 2021 AA-1, RB, 5.00%, 06/15/2048 | 1.51% |
| Long Island (City of), NY Power Authority, Series 2016 B, Ref. RB, 5.00%, 09/01/2041 | 1.47% |
| New York Convention Center Development Corp. (Hotel Unit Fee Secured), Series 2015, Ref. RB, 5.00%, 11/15/2045 | 1.44% |
| New York (City of), NY Municipal Water Finance Authority, Series 2023 D, Ref. RB, 4.13%, 06/15/2047 | 1.43% |
| New York State Urban Development Corp. (Bidding Group 3), Series 2019 A, Ref. RB, 4.00%, 03/15/2044 | 1.40% |
What Were The Fund Costs For The Last Six Months ?
(Based on a hypothetical $10,000 investment)
| Fund | Costs of a $10,000 investment | Costs paid as a percentage of a $10,000 investment* |
| Invesco Floating Rate Municipal Income ETF | $12 | 0.25% |
| * |
Annualized. |
What Are Key Statistics About The Fund?
(as of February 28, 2025)
| Fund net assets | $28,522,643 |
| Total number of portfolio holdings | 32 |
What Comprised The Fund's Holdings?
(as of February 28, 2025)
Top ten holdings
(% of net assets)
(% of net assets)
| West Palm Beach (City of), FL, Series 2008 C, VRD RB, 2.30%, 10/01/2038 | 5.26% |
| Emmaus (Borough of), PA General Authority, Series 1996, VRD RB, 2.35%, 12/01/2028 | 4.91% |
| New York (City of), NY Municipal Water Finance Authority, Series 2012, VRD RB, 1.75%, 06/15/2046 | 4.82% |
| Texas (State of), Series 2015 B, VRD GO Bonds, 2.25%, 06/01/2046 | 4.24% |
| Florida Keys Aqueduct Authority, Series 2008, Ref. VRD RB, 2.35%, 09/01/2035 | 4.21% |
| New York (State of) Dormitory Authority (Rockefeller University), Series 2008 A, VRD RB, 1.80%, 07/01/2039 | 4.21% |
| New York (City of), NY Transitional Finance Authority, Subseries 2012 C-4, VRD RB, 1.45%, 11/01/2036 | 4.21% |
| Orlando (City of), FL Utilities Commission, Series 2015 B, Ref. VRD RB, 2.04%, 10/01/2039 | 4.21% |
| Connecticut (State of) Housing Finance Authority, Series 2020 E-3, Ref. VRD RB, 1.95%, 11/15/2050 | 4.21% |
| New York City Housing Development Corp., Series 2006 A, VRD RB, 2.30%, 10/15/2041 | 4.21% |
Revenue type allocation
(% of net assets)
(% of net assets)
Top ten holdings
(% of net assets)
(% of net assets)
| West Palm Beach (City of), FL, Series 2008 C, VRD RB, 2.30%, 10/01/2038 | 5.26% |
| Emmaus (Borough of), PA General Authority, Series 1996, VRD RB, 2.35%, 12/01/2028 | 4.91% |
| New York (City of), NY Municipal Water Finance Authority, Series 2012, VRD RB, 1.75%, 06/15/2046 | 4.82% |
| Texas (State of), Series 2015 B, VRD GO Bonds, 2.25%, 06/01/2046 | 4.24% |
| Florida Keys Aqueduct Authority, Series 2008, Ref. VRD RB, 2.35%, 09/01/2035 | 4.21% |
| New York (State of) Dormitory Authority (Rockefeller University), Series 2008 A, VRD RB, 1.80%, 07/01/2039 | 4.21% |
| New York (City of), NY Transitional Finance Authority, Subseries 2012 C-4, VRD RB, 1.45%, 11/01/2036 | 4.21% |
| Orlando (City of), FL Utilities Commission, Series 2015 B, Ref. VRD RB, 2.04%, 10/01/2039 | 4.21% |
| Connecticut (State of) Housing Finance Authority, Series 2020 E-3, Ref. VRD RB, 1.95%, 11/15/2050 | 4.21% |
| New York City Housing Development Corp., Series 2006 A, VRD RB, 2.30%, 10/15/2041 | 4.21% |
What Were The Fund Costs For The Last Six Months ?
(Based on a hypothetical $10,000 investment)
| Fund | Costs of a $10,000 investment | Costs paid as a percentage of a $10,000 investment* |
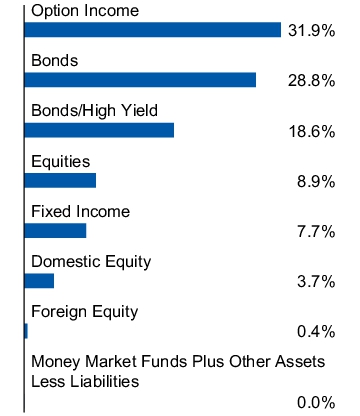
| Invesco CEF Income Composite ETF | $21 | 0.41%† |
| * |
Annualized. |
|
† |
Reflects fee waivers and/or expense reimbursements, without which expenses would have been higher. |
What Are Key Statistics About The Fund?
(as of February 28, 2025)
| Fund net assets | $829,157,988 |
| Total number of portfolio holdings | 111 |
| Portfolio turnover rate | 9% |
What Comprised The Fund's Holdings?
(as of February 28, 2025)
Top ten holdings*
(% of net assets)
(% of net assets)
| Eaton Vance Tax-Managed Global Diversified Equity Income Fund | 4.35% |
| BlackRock Health Sciences Term Trust | 3.00% |
| BlackRock Technology and Private Equity Term Trust | 2.85% |
| Eaton Vance Tax-Managed Diversified Equity Income Fund | 2.80% |
| Nuveen Preferred & Income Opportunities Fund | 2.61% |
| Nuveen S&P 500 Buy-Write Income Fund | 2.46% |
| Eaton Vance Tax-Managed Buy-Write Opportunities Fund | 2.46% |
| BlackRock Capital Allocation Term Trust | 2.43% |
| BlackRock ESG Capital Allocation Term Trust | 2.42% |
| BlackRock Enhanced Equity Dividend Trust | 2.40% |
| * Excluding money market fund holdings, if any. |
Asset allocation
(% of net assets)
(% of net assets)
Top ten holdings*
(% of net assets)
(% of net assets)
| Eaton Vance Tax-Managed Global Diversified Equity Income Fund | 4.35% |
| BlackRock Health Sciences Term Trust | 3.00% |
| BlackRock Technology and Private Equity Term Trust | 2.85% |
| Eaton Vance Tax-Managed Diversified Equity Income Fund | 2.80% |
| Nuveen Preferred & Income Opportunities Fund | 2.61% |
| Nuveen S&P 500 Buy-Write Income Fund | 2.46% |
| Eaton Vance Tax-Managed Buy-Write Opportunities Fund | 2.46% |
| BlackRock Capital Allocation Term Trust | 2.43% |
| BlackRock ESG Capital Allocation Term Trust | 2.42% |
| BlackRock Enhanced Equity Dividend Trust | 2.40% |
| * Excluding money market fund holdings, if any. |
What Were The Fund Costs For The Last Six Months ?
(Based on a hypothetical $10,000 investment)
| Fund | Costs of a $10,000 investment | Costs paid as a percentage of a $10,000 investment* |
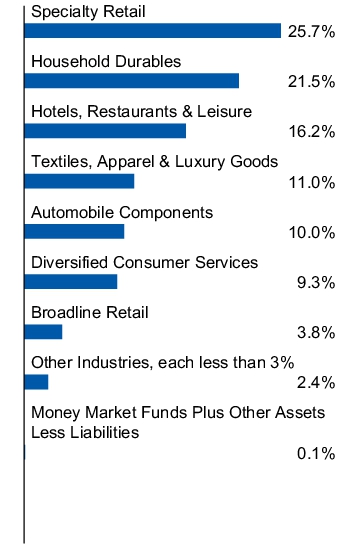
| Invesco S&P SmallCap Consumer Discretionary ETF | $14 | 0.29% |
| * |
Annualized. |
What Are Key Statistics About The Fund?
(as of February 28, 2025)
| Fund net assets | $24,799,192 |
| Total number of portfolio holdings | 86 |
| Portfolio turnover rate | 17% |
What Comprised The Fund's Holdings?
(as of February 28, 2025)
Top ten holdings*
(% of net assets)
(% of net assets)
| V.F. Corp. | 4.41% |
| Bath & Body Works, Inc. | 4.24% |
| Brinker International, Inc. | 3.91% |
| Group 1 Automotive, Inc. | 3.19% |
| Stride, Inc. | 3.13% |
| Etsy, Inc. | 3.07% |
| Champion Homes, Inc. | 2.89% |
| Asbury Automotive Group, Inc. | 2.81% |
| Meritage Homes Corp. | 2.80% |
| Shake Shack, Inc., Class A | 2.32% |
| * Excluding money market fund holdings, if any. |
Industry allocation
(% of net assets)
(% of net assets)
Top ten holdings*
(% of net assets)
(% of net assets)
| V.F. Corp. | 4.41% |
| Bath & Body Works, Inc. | 4.24% |
| Brinker International, Inc. | 3.91% |
| Group 1 Automotive, Inc. | 3.19% |
| Stride, Inc. | 3.13% |
| Etsy, Inc. | 3.07% |
| Champion Homes, Inc. | 2.89% |
| Asbury Automotive Group, Inc. | 2.81% |
| Meritage Homes Corp. | 2.80% |
| Shake Shack, Inc., Class A | 2.32% |
| * Excluding money market fund holdings, if any. |
What Were The Fund Costs For The Last Six Months ?
(Based on a hypothetical $10,000 investment)
| Fund | Costs of a $10,000 investment | Costs paid as a percentage of a $10,000 investment* |
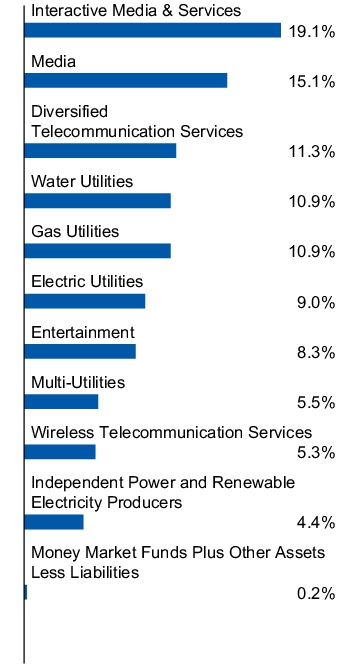
| Invesco S&P SmallCap Utilities & Communication Services ETF | $14 | 0.29% |
| * |
Annualized. |
What Are Key Statistics About The Fund?
(as of February 28, 2025)
| Fund net assets | $14,439,238 |
| Total number of portfolio holdings | 38 |
| Portfolio turnover rate | 14% |
What Comprised The Fund's Holdings?
(as of February 28, 2025)
Top ten holdings*
(% of net assets)
(% of net assets)
| Lumen Technologies, Inc. | 6.46% |
| EchoStar Corp., Class A | 5.10% |
| Telephone and Data Systems, Inc. | 4.75% |
| MDU Resources Group, Inc. | 4.75% |
| Madison Square Garden Sports Corp., Class A | 4.60% |
| Otter Tail Corp. | 4.50% |
| MGE Energy, Inc. | 4.49% |
| IAC, Inc. | 4.42% |
| Avista Corp. | 4.27% |
| Cogent Communications Holdings, Inc. | 4.17% |
| * Excluding money market fund holdings, if any. |
Industry allocation
(% of net assets)
(% of net assets)
Top ten holdings*
(% of net assets)
(% of net assets)
| Lumen Technologies, Inc. | 6.46% |
| EchoStar Corp., Class A | 5.10% |
| Telephone and Data Systems, Inc. | 4.75% |
| MDU Resources Group, Inc. | 4.75% |
| Madison Square Garden Sports Corp., Class A | 4.60% |
| Otter Tail Corp. | 4.50% |
| MGE Energy, Inc. | 4.49% |
| IAC, Inc. | 4.42% |
| Avista Corp. | 4.27% |
| Cogent Communications Holdings, Inc. | 4.17% |
| * Excluding money market fund holdings, if any. |
What Were The Fund Costs For The Last Six Months ?
(Based on a hypothetical $10,000 investment)
| Fund | Costs of a $10,000 investment | Costs paid as a percentage of a $10,000 investment* |
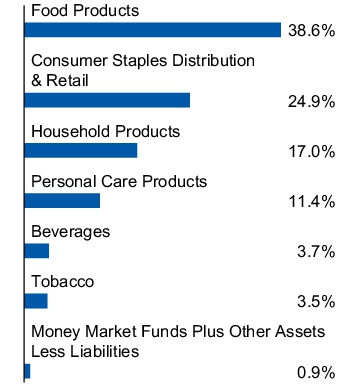
| Invesco S&P SmallCap Consumer Staples ETF | $14 | 0.29% |
| * |
Annualized. |
What Are Key Statistics About The Fund?
(as of February 28, 2025)
| Fund net assets | $49,305,923 |
| Total number of portfolio holdings | 29 |
| Portfolio turnover rate | 10% |
What Comprised The Fund's Holdings?
(as of February 28, 2025)
Top ten holdings*
(% of net assets)
(% of net assets)
| Cal-Maine Foods, Inc. | 9.48% |
| Simply Good Foods Co. (The) | 8.88% |
| WD-40 Co. | 8.34% |
| Interparfums, Inc. | 6.42% |
| Chefs' Warehouse, Inc. (The) | 5.76% |
| PriceSmart, Inc. | 5.72% |
| United Natural Foods, Inc. | 4.78% |
| J&J Snack Foods Corp. | 4.74% |
| Energizer Holdings, Inc. | 4.17% |
| Edgewell Personal Care Co. | 4.10% |
| * Excluding money market fund holdings, if any. |
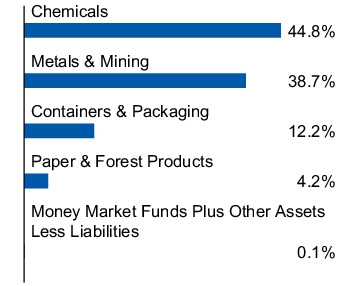
Industry allocation
(% of net assets)
(% of net assets)
Top ten holdings*
(% of net assets)
(% of net assets)
| Cal-Maine Foods, Inc. | 9.48% |
| Simply Good Foods Co. (The) | 8.88% |
| WD-40 Co. | 8.34% |
| Interparfums, Inc. | 6.42% |
| Chefs' Warehouse, Inc. (The) | 5.76% |
| PriceSmart, Inc. | 5.72% |
| United Natural Foods, Inc. | 4.78% |
| J&J Snack Foods Corp. | 4.74% |
| Energizer Holdings, Inc. | 4.17% |
| Edgewell Personal Care Co. | 4.10% |
| * Excluding money market fund holdings, if any. |
What Were The Fund Costs For The Last Six Months ?
(Based on a hypothetical $10,000 investment)
| Fund | Costs of a $10,000 investment | Costs paid as a percentage of a $10,000 investment* |
| Invesco S&P SmallCap Energy ETF | $13 | 0.29% |
| * |
Annualized. |
What Are Key Statistics About The Fund?
(as of February 28, 2025)
| Fund net assets | $75,642,005 |
| Total number of portfolio holdings | 35 |
| Portfolio turnover rate | 20% |
What Comprised The Fund's Holdings?
(as of February 28, 2025)
Top ten holdings*
(% of net assets)
(% of net assets)
| Archrock, Inc. | 7.99% |
| Magnolia Oil & Gas Corp., Class A | 7.52% |
| SM Energy Co. | 6.29% |
| Core Natural Resources, Inc. | 6.01% |
| Cactus, Inc., Class A | 5.89% |
| California Resources Corp. | 5.37% |
| Northern Oil and Gas, Inc. | 5.26% |
| Patterson-UTI Energy, Inc. | 5.09% |
| Liberty Energy, Inc., Class A | 4.51% |
| Oceaneering International, Inc. | 3.85% |
| * Excluding money market fund holdings, if any. |
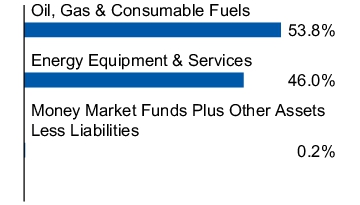
Industry allocation
(% of net assets)
(% of net assets)
Top ten holdings*
(% of net assets)
(% of net assets)
| Archrock, Inc. | 7.99% |
| Magnolia Oil & Gas Corp., Class A | 7.52% |
| SM Energy Co. | 6.29% |
| Core Natural Resources, Inc. | 6.01% |
| Cactus, Inc., Class A | 5.89% |
| California Resources Corp. | 5.37% |
| Northern Oil and Gas, Inc. | 5.26% |
| Patterson-UTI Energy, Inc. | 5.09% |
| Liberty Energy, Inc., Class A | 4.51% |
| Oceaneering International, Inc. | 3.85% |
| * Excluding money market fund holdings, if any. |
What Were The Fund Costs For The Last Six Months ?
(Based on a hypothetical $10,000 investment)
| Fund | Costs of a $10,000 investment | Costs paid as a percentage of a $10,000 investment* |
| Invesco S&P SmallCap Financials ETF | $15 | 0.29% |
| * |
Annualized. |
What Are Key Statistics About The Fund?
(as of February 28, 2025)
| Fund net assets | $21,248,938 |
| Total number of portfolio holdings | 169 |
| Portfolio turnover rate | 7% |
What Comprised The Fund's Holdings?
(as of February 28, 2025)
Top ten holdings*
(% of net assets)
(% of net assets)
| Mr. Cooper Group, Inc. | 2.00% |
| Jackson Financial, Inc., Class A | 1.88% |
| Terreno Realty Corp. | 1.88% |
| Lincoln National Corp. | 1.85% |
| Essential Properties Realty Trust, Inc. | 1.60% |
| Moelis & Co., Class A | 1.39% |
| Radian Group, Inc. | 1.37% |
| CareTrust REIT, Inc. | 1.35% |
| Piper Sandler Cos. | 1.28% |
| ServisFirst Bancshares, Inc. | 1.28% |
| * Excluding money market fund holdings, if any. |
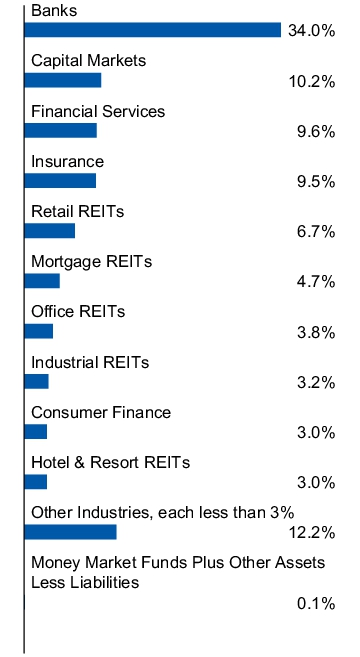
Industry allocation
(% of net assets)
(% of net assets)
Top ten holdings*
(% of net assets)
(% of net assets)
| Mr. Cooper Group, Inc. | 2.00% |
| Jackson Financial, Inc., Class A | 1.88% |
| Terreno Realty Corp. | 1.88% |
| Lincoln National Corp. | 1.85% |
| Essential Properties Realty Trust, Inc. | 1.60% |
| Moelis & Co., Class A | 1.39% |
| Radian Group, Inc. | 1.37% |
| CareTrust REIT, Inc. | 1.35% |
| Piper Sandler Cos. | 1.28% |
| ServisFirst Bancshares, Inc. | 1.28% |
| * Excluding money market fund holdings, if any. |
What Were The Fund Costs For The Last Six Months ?
(Based on a hypothetical $10,000 investment)
| Fund | Costs of a $10,000 investment | Costs paid as a percentage of a $10,000 investment* |
| Invesco S&P SmallCap Health Care ETF | $14 | 0.29% |
| * |
Annualized. |
What Are Key Statistics About The Fund?
(as of February 28, 2025)
| Fund net assets | $173,930,169 |
| Total number of portfolio holdings | 77 |
| Portfolio turnover rate | 29% |
What Comprised The Fund's Holdings?
(as of February 28, 2025)
Top ten holdings*
(% of net assets)
(% of net assets)
| Hims & Hers Health, Inc. | 5.57% |
| Glaukos Corp. | 4.28% |
| Merit Medical Systems, Inc. | 3.84% |
| Corcept Therapeutics, Inc. | 3.65% |
| Inspire Medical Systems, Inc. | 3.59% |
| Alkermes PLC | 3.59% |
| Krystal Biotech, Inc. | 2.93% |
| Prestige Consumer Healthcare, Inc. | 2.70% |
| Integer Holdings Corp. | 2.67% |
| TG Therapeutics, Inc. | 2.59% |
| * Excluding money market fund holdings, if any. |
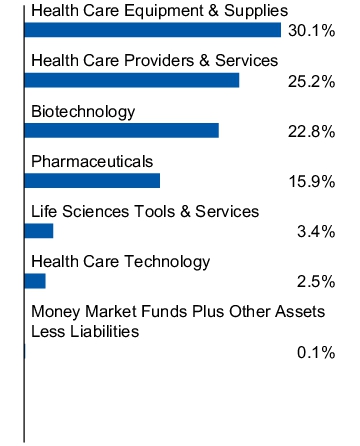
Industry allocation
(% of net assets)
(% of net assets)
Top ten holdings*
(% of net assets)
(% of net assets)
| Hims & Hers Health, Inc. | 5.57% |
| Glaukos Corp. | 4.28% |
| Merit Medical Systems, Inc. | 3.84% |
| Corcept Therapeutics, Inc. | 3.65% |
| Inspire Medical Systems, Inc. | 3.59% |
| Alkermes PLC | 3.59% |
| Krystal Biotech, Inc. | 2.93% |
| Prestige Consumer Healthcare, Inc. | 2.70% |
| Integer Holdings Corp. | 2.67% |
| TG Therapeutics, Inc. | 2.59% |
| * Excluding money market fund holdings, if any. |
What Were The Fund Costs For The Last Six Months ?
(Based on a hypothetical $10,000 investment)
| Fund | Costs of a $10,000 investment | Costs paid as a percentage of a $10,000 investment* |
| Invesco S&P SmallCap Industrials ETF | $14 | 0.29% |
| * |
Annualized. |
What Are Key Statistics About The Fund?
(as of February 28, 2025)
| Fund net assets | $208,660,801 |
| Total number of portfolio holdings | 98 |
| Portfolio turnover rate | 16% |
What Comprised The Fund's Holdings?
(as of February 28, 2025)
Top ten holdings*
(% of net assets)
(% of net assets)
| Alaska Air Group, Inc. | 3.86% |
| SPX Technologies, Inc. | 2.84% |
| Armstrong World Industries, Inc. | 2.82% |
| JBT Marel Corp. | 2.58% |
| Robert Half, Inc. | 2.52% |
| CSW Industrials, Inc. | 2.17% |
| Zurn Elkay Water Solutions Corp. | 2.12% |
| Federal Signal Corp. | 2.09% |
| Air Lease Corp., Class A | 2.09% |
| Gates Industrial Corp. PLC | 2.06% |
| * Excluding money market fund holdings, if any. |
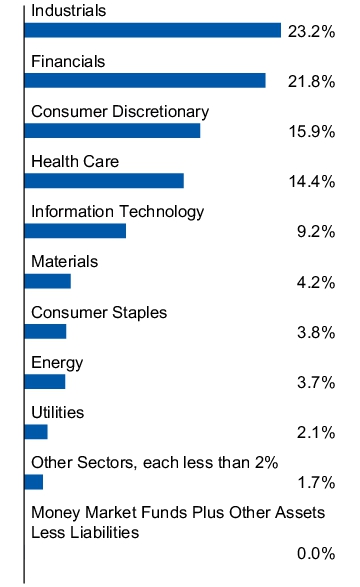
Industry allocation
(% of net assets)
(% of net assets)

Top ten holdings*
(% of net assets)
(% of net assets)
| Alaska Air Group, Inc. | 3.86% |
| SPX Technologies, Inc. | 2.84% |
| Armstrong World Industries, Inc. | 2.82% |
| JBT Marel Corp. | 2.58% |
| Robert Half, Inc. | 2.52% |
| CSW Industrials, Inc. | 2.17% |
| Zurn Elkay Water Solutions Corp. | 2.12% |
| Federal Signal Corp. | 2.09% |
| Air Lease Corp., Class A | 2.09% |
| Gates Industrial Corp. PLC | 2.06% |
| * Excluding money market fund holdings, if any. |
What Were The Fund Costs For The Last Six Months ?
(Based on a hypothetical $10,000 investment)
| Fund | Costs of a $10,000 investment | Costs paid as a percentage of a $10,000 investment* |
| Invesco S&P SmallCap Information Technology ETF | $14 | 0.29% |
| * |
Annualized.
|
What Are Key Statistics About The Fund?
(as of February 28, 2025)
| Fund net assets | $273,538,561 |
| Total number of portfolio holdings | 70 |
| Portfolio turnover rate | 20% |
What Comprised The Fund's Holdings?
(as of February 28, 2025)
Top ten holdings*
(% of net assets)
(% of net assets)
| Qorvo, Inc. | 4.42% |
| Badger Meter, Inc. | 3.98% |
| ACI Worldwide, Inc. | 3.87% |
| InterDigital, Inc. | 3.49% |
| Sandisk Corp. | 3.48% |
| SPS Commerce, Inc. | 3.22% |
| Itron, Inc. | 3.16% |
| Box, Inc., Class A | 3.01% |
| MARA Holdings, Inc. | 2.88% |
| Sanmina Corp. | 2.88% |
| * Excluding money market fund holdings, if any. |
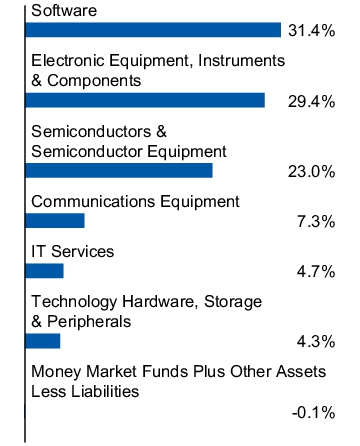
Industry allocation
(% of net assets)
(% of net assets)
Top ten holdings*
(% of net assets)
(% of net assets)
| Qorvo, Inc. | 4.42% |
| Badger Meter, Inc. | 3.98% |
| ACI Worldwide, Inc. | 3.87% |
| InterDigital, Inc. | 3.49% |
| Sandisk Corp. | 3.48% |
| SPS Commerce, Inc. | 3.22% |
| Itron, Inc. | 3.16% |
| Box, Inc., Class A | 3.01% |
| MARA Holdings, Inc. | 2.88% |
| Sanmina Corp. | 2.88% |
| * Excluding money market fund holdings, if any. |
What Were The Fund Costs For The Last Six Months ?
(Based on a hypothetical $10,000 investment)
| Fund | Costs of a $10,000 investment | Costs paid as a percentage of a $10,000 investment* |
| Invesco S&P SmallCap Materials ETF | $14 | 0.29% |
| * |
Annualized. |
What Are Key Statistics About The Fund?
(as of February 28, 2025)
| Fund net assets | $15,862,922 |
| Total number of portfolio holdings | 28 |
| Portfolio turnover rate | 10% |
What Comprised The Fund's Holdings?
(as of February 28, 2025)
Top ten holdings*
(% of net assets)
(% of net assets)
| ATI, Inc. | 14.88% |
| Balchem Corp. | 10.15% |
| Sealed Air Corp. | 8.93% |
| H.B. Fuller Co. | 5.56% |
| MP Materials Corp. | 5.26% |
| Sensient Technologies Corp. | 4.80% |
| Innospec, Inc. | 4.68% |
| Warrior Met Coal, Inc. | 4.52% |
| Sylvamo Corp. | 4.24% |
| Minerals Technologies, Inc. | 3.97% |
| * Excluding money market fund holdings, if any. |
Industry allocation
(% of net assets)
(% of net assets)
Top ten holdings*
(% of net assets)
(% of net assets)
| ATI, Inc. | 14.88% |
| Balchem Corp. | 10.15% |
| Sealed Air Corp. | 8.93% |
| H.B. Fuller Co. | 5.56% |
| MP Materials Corp. | 5.26% |
| Sensient Technologies Corp. | 4.80% |
| Innospec, Inc. | 4.68% |
| Warrior Met Coal, Inc. | 4.52% |
| Sylvamo Corp. | 4.24% |
| Minerals Technologies, Inc. | 3.97% |
| * Excluding money market fund holdings, if any. |
What Were The Fund Costs For The Last Six Months ?
(Based on a hypothetical $10,000 investment)
| Fund | Costs of a $10,000 investment | Costs paid as a percentage of a $10,000 investment* |
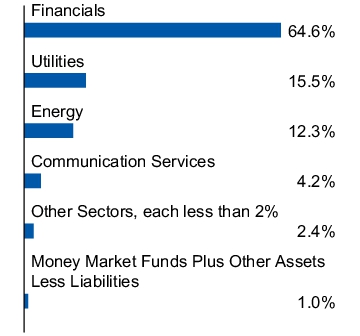
| Invesco KBW High Dividend Yield Financial ETF | $18 | 0.35% |
| * |
Annualized. |
What Are Key Statistics About The Fund?
(as of February 28, 2025)
| Fund net assets | $436,667,802 |
| Total number of portfolio holdings | 42 |
| Portfolio turnover rate | 45% |
What Comprised The Fund's Holdings?
(as of February 28, 2025)
Top ten holdings*
(% of net assets)
(% of net assets)
| Invesco Mortgage Capital, Inc. | 4.59% |
| Orchid Island Capital, Inc. | 4.52% |
| Two Harbors Investment Corp. | 4.18% |
| Dynex Capital, Inc. | 3.63% |
| AGNC Investment Corp. | 3.63% |
| ARMOUR Residential REIT, Inc. | 3.45% |
| New York Mortgage Trust, Inc. | 3.43% |
| Ellington Financial, Inc. | 3.32% |
| Annaly Capital Management, Inc. | 3.25% |
| Trinity Capital, Inc., BDC | 3.63% |
| * Excluding money market fund holdings, if any. |
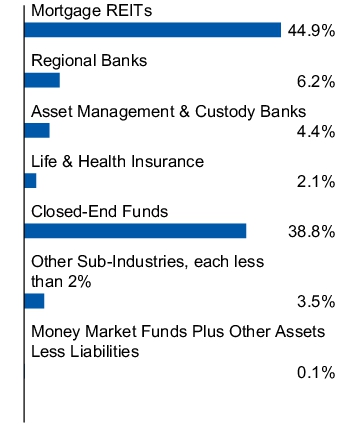
Sub-industry allocation
(% of net assets)
(% of net assets)
Top ten holdings*
(% of net assets)
(% of net assets)
| Invesco Mortgage Capital, Inc. | 4.59% |
| Orchid Island Capital, Inc. | 4.52% |
| Two Harbors Investment Corp. | 4.18% |
| Dynex Capital, Inc. | 3.63% |
| AGNC Investment Corp. | 3.63% |
| ARMOUR Residential REIT, Inc. | 3.45% |
| New York Mortgage Trust, Inc. | 3.43% |
| Ellington Financial, Inc. | 3.32% |
| Annaly Capital Management, Inc. | 3.25% |
| Trinity Capital, Inc., BDC | 3.63% |
| * Excluding money market fund holdings, if any. |
What Were The Fund Costs For The Last Six Months ?
(Based on a hypothetical $10,000 investment)
| Fund | Costs of a $10,000 investment | Costs paid as a percentage of a $10,000 investment* |
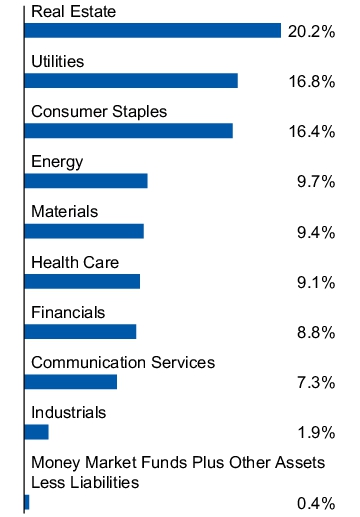
| Invesco KBW Premium Yield Equity REIT ETF | $16 | 0.35% |
| * |
Annualized. |
What Are Key Statistics About The Fund?
(as of February 28, 2025)
| Fund net assets | $222,748,900 |
| Total number of portfolio holdings | 33 |
| Portfolio turnover rate | 51% |
What Comprised The Fund's Holdings?
(as of February 28, 2025)
Top ten holdings*
(% of net assets)
(% of net assets)
| Global Net Lease, Inc. | 7.70% |
| SITE Centers Corp. | 5.67% |
| Brandywine Realty Trust | 4.90% |
| Community Healthcare Trust, Inc. | 4.67% |
| NexPoint Diversified Real Estate Trust | 4.42% |
| Global Medical REIT, Inc. | 4.27% |
| EPR Properties | 4.27% |
| Easterly Government Properties, Inc. | 3.80% |
| CTO Realty Growth, Inc. | 3.43% |
| Clipper Realty, Inc. | 3.14% |
| * Excluding money market fund holdings, if any. |
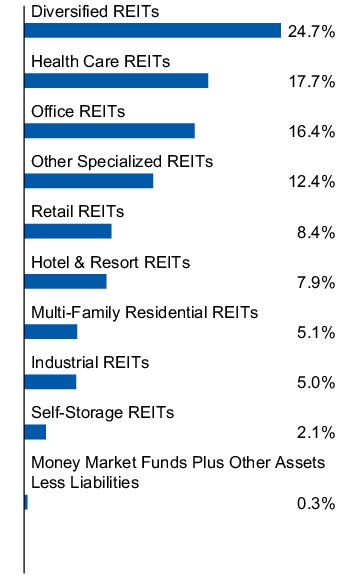
Sub-industry allocation
(% of net assets)
(% of net assets)
Top ten holdings*
(% of net assets)
(% of net assets)
| Global Net Lease, Inc. | 7.70% |
| SITE Centers Corp. | 5.67% |
| Brandywine Realty Trust | 4.90% |
| Community Healthcare Trust, Inc. | 4.67% |
| NexPoint Diversified Real Estate Trust | 4.42% |
| Global Medical REIT, Inc. | 4.27% |
| EPR Properties | 4.27% |
| Easterly Government Properties, Inc. | 3.80% |
| CTO Realty Growth, Inc. | 3.43% |
| Clipper Realty, Inc. | 3.14% |
| * Excluding money market fund holdings, if any. |
What Were The Fund Costs For The Last Six Months ?
(Based on a hypothetical $10,000 investment)
| Fund | Costs of a $10,000 investment | Costs paid as a percentage of a $10,000 investment* |
| Invesco KBW Property & Casualty Insurance ETF | $18 | 0.35% |
| * |
Annualized. |
What Are Key Statistics About The Fund?
(as of February 28, 2025)
| Fund net assets | $387,737,441 |
| Total number of portfolio holdings | 26 |
| Portfolio turnover rate | 5% |
What Comprised The Fund's Holdings?
(as of February 28, 2025)
Top ten holdings*
(% of net assets)
(% of net assets)
| American International Group, Inc. | 9.05% |
| Progressive Corp. (The) | 8.80% |
| Chubb Ltd. | 8.29% |
| Travelers Cos., Inc. (The) | 8.15% |
| Allstate Corp. (The) | 8.05% |
| AXIS Capital Holdings Ltd. | 4.37% |
| Hanover Insurance Group, Inc. (The) | 4.33% |
| W.R. Berkley Corp. | 4.10% |
| Hartford Financial Services Group, Inc. (The) | 4.02% |
| Cincinnati Financial Corp. | 3.88% |
| * Excluding money market fund holdings, if any. |
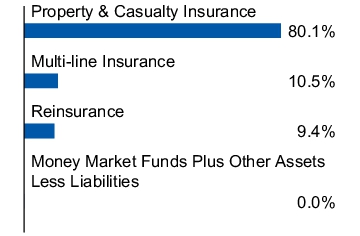
Sub-industry allocation
(% of net assets)
(% of net assets)
Top ten holdings*
(% of net assets)
(% of net assets)
| American International Group, Inc. | 9.05% |
| Progressive Corp. (The) | 8.80% |
| Chubb Ltd. | 8.29% |
| Travelers Cos., Inc. (The) | 8.15% |
| Allstate Corp. (The) | 8.05% |
| AXIS Capital Holdings Ltd. | 4.37% |
| Hanover Insurance Group, Inc. (The) | 4.33% |
| W.R. Berkley Corp. | 4.10% |
| Hartford Financial Services Group, Inc. (The) | 4.02% |
| Cincinnati Financial Corp. | 3.88% |
| * Excluding money market fund holdings, if any. |
What Were The Fund Costs For The Last Six Months ?
(Based on a hypothetical $10,000 investment)
| Fund | Costs of a $10,000 investment | Costs paid as a percentage of a $10,000 investment* |
| Invesco S&P 500® High Beta ETF | $12 | 0.25% |
| * |
Annualized. |
What Are Key Statistics About The Fund?
(as of February 28, 2025)
| Fund net assets | $298,801,869 |
| Total number of portfolio holdings | 104 |
| Portfolio turnover rate | 42% |
What Comprised The Fund's Holdings?
(as of February 28, 2025)
Top ten holdings*
(% of net assets)
(% of net assets)
| Super Micro Computer, Inc. | 2.18% |
| NVIDIA Corp. | 1.89% |
| Monolithic Power Systems, Inc. | 1.63% |
| Micron Technology, Inc. | 1.60% |
| Broadcom, Inc. | 1.54% |
| Intel Corp. | 1.53% |
| Teradyne, Inc. | 1.53% |
| Tesla, Inc. | 1.50% |
| KLA Corp. | 1.43% |
| Lam Research Corp. | 1.43% |
| * Excluding money market fund holdings, if any. |
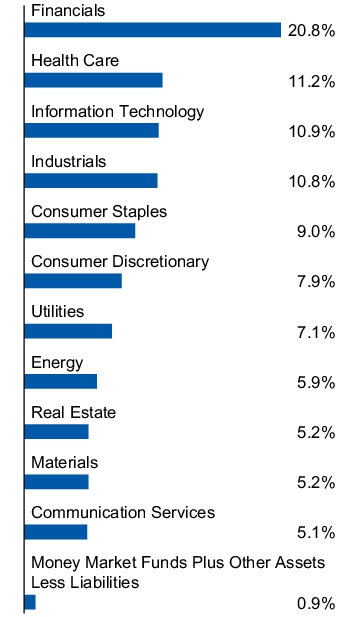
Sector allocation
(% of net assets)
(% of net assets)
Top ten holdings*
(% of net assets)
(% of net assets)
| Super Micro Computer, Inc. | 2.18% |
| NVIDIA Corp. | 1.89% |
| Monolithic Power Systems, Inc. | 1.63% |
| Micron Technology, Inc. | 1.60% |
| Broadcom, Inc. | 1.54% |
| Intel Corp. | 1.53% |
| Teradyne, Inc. | 1.53% |
| Tesla, Inc. | 1.50% |
| KLA Corp. | 1.43% |
| Lam Research Corp. | 1.43% |
| * Excluding money market fund holdings, if any. |
What Were The Fund Costs For The Last Six Months ?
(Based on a hypothetical $10,000 investment)
| Fund | Costs of a $10,000 investment | Costs paid as a percentage of a $10,000 investment* |
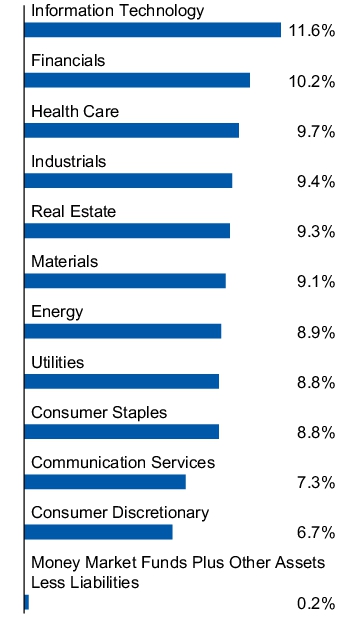
| Invesco S&P SmallCap Low Volatility ETF | $12 | 0.25% |
| * |
Annualized. |
What Are Key Statistics About The Fund?
(as of February 28, 2025)
| Fund net assets | $290,853,510 |
| Total number of portfolio holdings | 123 |
| Portfolio turnover rate | 38% |
What Comprised The Fund's Holdings?
(as of February 28, 2025)
Top ten holdings*
(% of net assets)
(% of net assets)
| Ellington Financial, Inc. | 1.14% |
| Four Corners Property Trust, Inc. | 1.13% |
| Madison Square Garden Sports Corp., Class A | 1.11% |
| LTC Properties, Inc. | 1.11% |
| Getty Realty Corp. | 1.09% |
| Innoviva, Inc. | 1.09% |
| Essential Properties Realty Trust, Inc. | 1.09% |
| Phillips Edison & Co., Inc. | 1.08% |
| Avista Corp. | 1.05% |
| Alexander & Baldwin, Inc. | 1.03% |
| * Excluding money market fund holdings, if any. |
Sector allocation
(% of net assets)
(% of net assets)
Top ten holdings*
(% of net assets)
(% of net assets)
| Ellington Financial, Inc. | 1.14% |
| Four Corners Property Trust, Inc. | 1.13% |
| Madison Square Garden Sports Corp., Class A | 1.11% |
| LTC Properties, Inc. | 1.11% |
| Getty Realty Corp. | 1.09% |
| Innoviva, Inc. | 1.09% |
| Essential Properties Realty Trust, Inc. | 1.09% |
| Phillips Edison & Co., Inc. | 1.08% |
| Avista Corp. | 1.05% |
| Alexander & Baldwin, Inc. | 1.03% |
| * Excluding money market fund holdings, if any. |
What Were The Fund Costs For The Last Six Months ?
(Based on a hypothetical $10,000 investment)
| Fund | Costs of a $10,000 investment | Costs paid as a percentage of a $10,000 investment* |
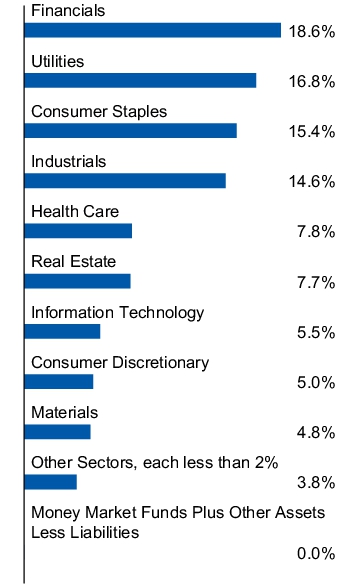
| Invesco S&P MidCap Low Volatility ETF | $13 | 0.25% |
| * |
Annualized. |
What Are Key Statistics About The Fund?
(as of February 28, 2025)
| Fund net assets | $785,872,030 |
| Total number of portfolio holdings | 83 |
| Portfolio turnover rate | 28% |
What Comprised The Fund's Holdings?
(as of February 28, 2025)
Top ten holdings*
(% of net assets)
(% of net assets)
| ALLETE, Inc. | 1.98% |
| AptarGroup, Inc. | 1.56% |
| EPR Properties | 1.53% |
| IDACORP, Inc. | 1.50% |
| OGE Energy Corp. | 1.50% |
| American Homes 4 Rent, Class A | 1.49% |
| Old Republic International Corp. | 1.47% |
| Portland General Electric Co. | 1.46% |
| Agree Realty Corp. | 1.43% |
| NNN REIT, Inc. | 1.42% |
| * Excluding money market fund holdings, if any. |
Sector allocation
(% of net assets)
(% of net assets)
Top ten holdings*
(% of net assets)
(% of net assets)
| ALLETE, Inc. | 1.98% |
| AptarGroup, Inc. | 1.56% |
| EPR Properties | 1.53% |
| IDACORP, Inc. | 1.50% |
| OGE Energy Corp. | 1.50% |
| American Homes 4 Rent, Class A | 1.49% |
| Old Republic International Corp. | 1.47% |
| Portland General Electric Co. | 1.46% |
| Agree Realty Corp. | 1.43% |
| NNN REIT, Inc. | 1.42% |
| * Excluding money market fund holdings, if any. |
What Were The Fund Costs For The Last Six Months ?
(Based on a hypothetical $10,000 investment)
| Fund | Costs of a $10,000 investment | Costs paid as a percentage of a $10,000 investment* |
| Invesco S&P 500® Low Volatility ETF | $13 | 0.25% |
| * |
Annualized. |
What Are Key Statistics About The Fund?
(as of February 28, 2025)
| Fund net assets | $7,710,343,598 |
| Total number of portfolio holdings | 102 |
| Portfolio turnover rate | 37% |
What Comprised The Fund's Holdings?
(as of February 28, 2025)
Top ten holdings*
(% of net assets)
(% of net assets)
| Coca-Cola Co. (The) | 1.31% |
| Marsh & McLennan Cos., Inc. | 1.30% |
| Berkshire Hathaway, Inc., Class B | 1.27% |
| Republic Services, Inc. | 1.22% |
| Linde PLC | 1.18% |
| Procter & Gamble Co. (The) | 1.17% |
| Atmos Energy Corp. | 1.16% |
| Evergy, Inc. | 1.15% |
| Automatic Data Processing, Inc. | 1.15% |
| Johnson & Johnson | 1.13% |
| * Excluding money market fund holdings, if any. |
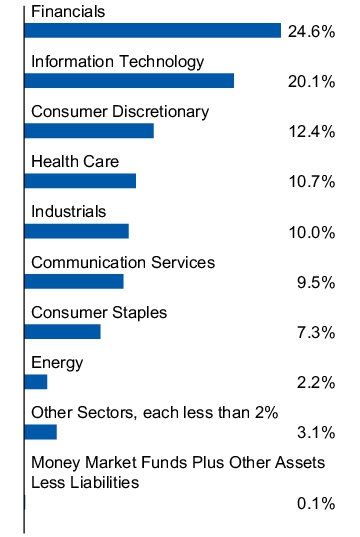
Sector allocation
(% of net assets)
(% of net assets)
Top ten holdings*
(% of net assets)
(% of net assets)
| Coca-Cola Co. (The) | 1.31% |
| Marsh & McLennan Cos., Inc. | 1.30% |
| Berkshire Hathaway, Inc., Class B | 1.27% |
| Republic Services, Inc. | 1.22% |
| Linde PLC | 1.18% |
| Procter & Gamble Co. (The) | 1.17% |
| Atmos Energy Corp. | 1.16% |
| Evergy, Inc. | 1.15% |
| Automatic Data Processing, Inc. | 1.15% |
| Johnson & Johnson | 1.13% |
| * Excluding money market fund holdings, if any. |
What Were The Fund Costs For The Last Six Months ?
(Based on a hypothetical $10,000 investment)
| Fund | Costs of a $10,000 investment | Costs paid as a percentage of a $10,000 investment* |
| Invesco Senior Loan ETF | $32 | 0.63%† |
| * |
Annualized.
|
|
†
|
Reflects fee waivers and/or expense reimbursements, without which expenses would have been higher.
|
What Are Key Statistics About The Fund?
(as of February 28, 2025)
| Fund net assets | $10,143,529,421 |
| Total number of portfolio holdings | 181 |
| Portfolio turnover rate | 79% |
What Comprised The Fund's Holdings?
(as of February 28, 2025)
Top ten holdings*
(% of net assets)
(% of net assets)
| Ultimate Software Group, Inc., First Lien Term Loan, 7.93%, 02/10/2031 | 1.82% |
| athenahealth Group, Inc., Term Loan, 7.32%, 02/15/2029 | 1.72% |
| AssuredPartners, Inc., Term Loan B-5, 7.82%, 02/14/2031 | 1.65% |
| Mozart Debt Merger Sub, Inc. (Medline Industries), Incremental Term Loan B, 6.57%, 10/23/2028 | 1.56% |
| Peraton Corp., First Lien Term Loan B, 8.17%, 02/01/2028 | 1.52% |
| McAfee LLC, Term Loan B, 7.31%, 03/01/2029 | 1.51% |
| AI Aqua Merger Sub, Inc., Term loan B, 7.31%, 07/31/2028 | 1.40% |
| Sedgwick Claims Management Services, Inc., Term Loan, 7.31%, 07/31/2031 | 1.40% |
| Proofpoint, Inc., Term Loan B, 7.32%, 08/31/2028 | 1.35% |
| Cloud Software Group, Inc., Term Loan B, 7.83%, 03/30/2029 | 1.35% |
| * Excluding money market fund holdings, if any. |
Credit quality rating breakdown**
(% of net assets)
(% of net assets)
| Baa2 | 0.9% |
| Baa3 | 1.2% |
| Ba1 | 5.7% |
| Ba2 | 2.1% |
| Ba3 | 9.8% |
| B1 | 17.2% |
| B2 | 33.3% |
| B3 | 12.3% |
| Caa1 | 1.9% |
| Caa2 | 0.8% |
| Ca | 0.0% |
| NR | 2.5% |
| WR | 8.1% |
| Money Market Funds Plus Other Assets Less Liabilities | 4.2% |
| ** Source: Moody's. A credit rating is an assessment provided by a nationally recognized statistical rating organization (NRSRO) of the creditworthiness of an issuer with respect to debt obligations, including specific securities, money market instruments or other debts. Ratings are measured on a scale that generally ranges from Aaa (highest) to C (lowest); ratings are subject to change without notice. “NR” indicates the debtor was not rated, and should not be interpreted as indicating low quality. For more information on Moody's rating methodology, please visit moodys.com and select “Methodologies & Frameworks” under "Ratings & Assessments" on the homepage. |
Top ten holdings*
(% of net assets)
(% of net assets)
| Ultimate Software Group, Inc., First Lien Term Loan, 7.93%, 02/10/2031 | 1.82% |
| athenahealth Group, Inc., Term Loan, 7.32%, 02/15/2029 | 1.72% |
| AssuredPartners, Inc., Term Loan B-5, 7.82%, 02/14/2031 | 1.65% |
| Mozart Debt Merger Sub, Inc. (Medline Industries), Incremental Term Loan B, 6.57%, 10/23/2028 | 1.56% |
| Peraton Corp., First Lien Term Loan B, 8.17%, 02/01/2028 | 1.52% |
| McAfee LLC, Term Loan B, 7.31%, 03/01/2029 | 1.51% |
| AI Aqua Merger Sub, Inc., Term loan B, 7.31%, 07/31/2028 | 1.40% |
| Sedgwick Claims Management Services, Inc., Term Loan, 7.31%, 07/31/2031 | 1.40% |
| Proofpoint, Inc., Term Loan B, 7.32%, 08/31/2028 | 1.35% |
| Cloud Software Group, Inc., Term Loan B, 7.83%, 03/30/2029 | 1.35% |
| * Excluding money market fund holdings, if any. |
What Were The Fund Costs For The Last Six Months ?
(Based on a hypothetical $10,000 investment)
| Fund | Costs of a $10,000 investment | Costs paid as a percentage of a $10,000 investment* |
| Invesco Fundamental Investment Grade Corporate Bond ETF | $11 | 0.22% |
| * |
Annualized. |
What Are Key Statistics About The Fund?
(as of February 28, 2025)
| Fund net assets | $81,024,688 |
| Total number of portfolio holdings | 783 |
| Portfolio turnover rate | 9% |
What Comprised The Fund's Holdings?
(as of February 28, 2025)
Top ten holdings*
(% of net assets)
(% of net assets)
| JPMorgan Chase & Co., 2.95%, 10/01/2026 | 1.00% |
| Bank of America Corp., 3.25%, 10/21/2027 | 0.85% |
| Apple, Inc., 3.25%, 02/23/2026 | 0.47% |
| Apple, Inc., 1.65%, 02/08/2031 | 0.47% |
| Exxon Mobil Corp., 3.04%, 03/01/2026 | 0.43% |
| Berkshire Hathaway Energy Co., 3.70%, 07/15/2030 | 0.43% |
| Berkshire Hathaway, Inc., 3.13%, 03/15/2026 | 0.43% |
| Walmart, Inc., 3.90%, 09/09/2025 | 0.42% |
| Capital One Financial Corp., 3.80%, 01/31/2028 | 0.41% |
| Microsoft Corp., 3.30%, 02/06/2027 | 0.40% |
| * Excluding money market fund holdings, if any. |
Sector allocation
(% of net assets)
(% of net assets)
Top ten holdings*
(% of net assets)
(% of net assets)
| JPMorgan Chase & Co., 2.95%, 10/01/2026 | 1.00% |
| Bank of America Corp., 3.25%, 10/21/2027 | 0.85% |
| Apple, Inc., 3.25%, 02/23/2026 | 0.47% |
| Apple, Inc., 1.65%, 02/08/2031 | 0.47% |
| Exxon Mobil Corp., 3.04%, 03/01/2026 | 0.43% |
| Berkshire Hathaway Energy Co., 3.70%, 07/15/2030 | 0.43% |
| Berkshire Hathaway, Inc., 3.13%, 03/15/2026 | 0.43% |
| Walmart, Inc., 3.90%, 09/09/2025 | 0.42% |
| Capital One Financial Corp., 3.80%, 01/31/2028 | 0.41% |
| Microsoft Corp., 3.30%, 02/06/2027 | 0.40% |
| * Excluding money market fund holdings, if any. |
What Were The Fund Costs For The Last Six Months ?
(Based on a hypothetical $10,000 investment)
| Fund | Costs of a $10,000 investment | Costs paid as a percentage of a $10,000 investment* |
| Invesco KBW Bank ETF | $19 | 0.35% |
| * |
Annualized. |
What Are Key Statistics About The Fund?
(as of February 28, 2025)
| Fund net assets | $3,668,247,209 |
| Total number of portfolio holdings | 27 |
| Portfolio turnover rate | 4% |
What Comprised The Fund's Holdings?
(as of February 28, 2025)
Top ten holdings*
(% of net assets)
(% of net assets)
| JPMorgan Chase & Co. | 8.64% |
| Wells Fargo & Co. | 8.39% |
| Goldman Sachs Group, Inc. (The) | 8.34% |
| Morgan Stanley | 8.25% |
| Bank of America Corp. | 7.91% |
| Citigroup, Inc. | 4.60% |
| Bank of New York Mellon Corp. (The) | 4.43% |
| Capital One Financial Corp. | 4.26% |
| State Street Corp. | 4.10% |
| Truist Financial Corp. | 3.96% |
| * Excluding money market fund holdings, if any. |
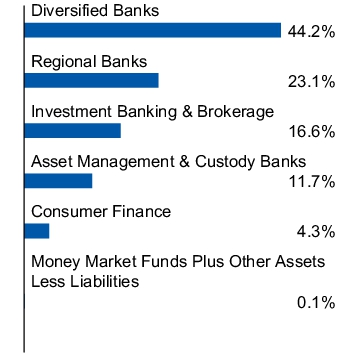
Sub-industry allocation
(% of net assets)
(% of net assets)
Top ten holdings*
(% of net assets)
(% of net assets)
| JPMorgan Chase & Co. | 8.64% |
| Wells Fargo & Co. | 8.39% |
| Goldman Sachs Group, Inc. (The) | 8.34% |
| Morgan Stanley | 8.25% |
| Bank of America Corp. | 7.91% |
| Citigroup, Inc. | 4.60% |
| Bank of New York Mellon Corp. (The) | 4.43% |
| Capital One Financial Corp. | 4.26% |
| State Street Corp. | 4.10% |
| Truist Financial Corp. | 3.96% |
| * Excluding money market fund holdings, if any. |
What Were The Fund Costs For The Last Six Months ?
(Based on a hypothetical $10,000 investment)
| Fund | Costs of a $10,000 investment | Costs paid as a percentage of a $10,000 investment* |
| Invesco KBW Regional Banking ETF | $18 | 0.35% |
| * |
Annualized. |
What Are Key Statistics About The Fund?
(as of February 28, 2025)
| Fund net assets | $54,935,399 |
| Total number of portfolio holdings | 53 |
| Portfolio turnover rate | 7% |
What Comprised The Fund's Holdings?
(as of February 28, 2025)
Top ten holdings*
(% of net assets)
(% of net assets)
| Webster Financial Corp. | 3.99% |
| Pinnacle Financial Partners, Inc. | 3.82% |
| Cullen/Frost Bankers, Inc. | 3.80% |
| Commerce Bancshares, Inc. | 3.79% |
| Wintrust Financial Corp. | 3.58% |
| Old National Bancorp | 2.24% |
| Popular, Inc. | 2.21% |
| Flagstar Financial, Inc. | 2.19% |
| Hancock Whitney Corp. | 2.11% |
| Bank OZK | 2.10% |
| * Excluding money market fund holdings, if any. |
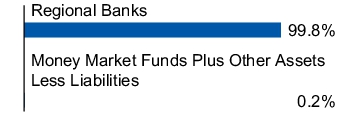
Sub-industry allocation
(% of net assets)
(% of net assets)
Top ten holdings*
(% of net assets)
(% of net assets)
| Webster Financial Corp. | 3.99% |
| Pinnacle Financial Partners, Inc. | 3.82% |
| Cullen/Frost Bankers, Inc. | 3.80% |
| Commerce Bancshares, Inc. | 3.79% |
| Wintrust Financial Corp. | 3.58% |
| Old National Bancorp | 2.24% |
| Popular, Inc. | 2.21% |
| Flagstar Financial, Inc. | 2.19% |
| Hancock Whitney Corp. | 2.11% |
| Bank OZK | 2.10% |
| * Excluding money market fund holdings, if any. |
What Were The Fund Costs For The Last Six Months ?
(Based on a hypothetical $10,000 investment)
| Fund | Costs of a $10,000 investment | Costs paid as a percentage of a $10,000 investment* |
| Invesco Dorsey Wright SmallCap Momentum ETF | $29 | 0.60% |
| * |
Annualized. |
What Are Key Statistics About The Fund?
(as of February 28, 2025)
| Fund net assets | $735,944,038 |
| Total number of portfolio holdings | 204 |
| Portfolio turnover rate | 92% |
What Comprised The Fund's Holdings?
(as of February 28, 2025)
Top ten holdings*
(% of net assets)
(% of net assets)
| Dave, Inc. | 1.78% |
| Mr. Cooper Group, Inc. | 1.62% |
| ADMA Biologics, Inc. | 1.52% |
| Limbach Holdings, Inc. | 1.42% |
| Kinetik Holdings, Inc., Class A | 1.35% |
| Byrna Technologies, Inc. | 1.28% |
| Kadant, Inc. | 1.25% |
| Modine Manufacturing Co. | 1.23% |
| Climb Global Solutions, Inc. | 1.22% |
| Rigetti Computing, Inc. | 1.20% |
| * Excluding money market fund holdings, if any. |
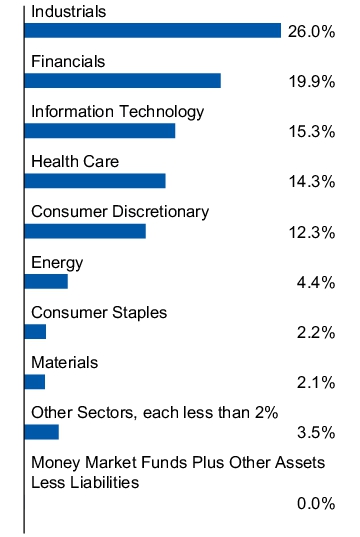
Sector allocation
(% of net assets)
(% of net assets)
Top ten holdings*
(% of net assets)
(% of net assets)
| Dave, Inc. | 1.78% |
| Mr. Cooper Group, Inc. | 1.62% |
| ADMA Biologics, Inc. | 1.52% |
| Limbach Holdings, Inc. | 1.42% |
| Kinetik Holdings, Inc., Class A | 1.35% |
| Byrna Technologies, Inc. | 1.28% |
| Kadant, Inc. | 1.25% |
| Modine Manufacturing Co. | 1.23% |
| Climb Global Solutions, Inc. | 1.22% |
| Rigetti Computing, Inc. | 1.20% |
| * Excluding money market fund holdings, if any. |
What Were The Fund Costs For The Last Six Months ?
(Based on a hypothetical $10,000 investment)
| Fund | Costs of a $10,000 investment | Costs paid as a percentage of a $10,000 investment* |
| Invesco S&P 500® High Dividend Low Volatility ETF | $15 | 0.30% |
| * |
Annualized. |
What Are Key Statistics About The Fund?
(as of February 28, 2025)
| Fund net assets | $3,479,207,437 |
| Total number of portfolio holdings | 53 |
| Portfolio turnover rate | 23% |
What Comprised The Fund's Holdings?
(as of February 28, 2025)
Top ten holdings*
(% of net assets)
(% of net assets)
| Altria Group, Inc. | 3.10% |
| Crown Castle, Inc. | 3.03% |
| Verizon Communications, Inc. | 3.01% |
| LyondellBasell Industries N.V., Class A | 2.87% |
| Dow, Inc. | 2.66% |
| Pfizer, Inc. | 2.65% |
| VICI Properties, Inc. | 2.63% |
| Realty Income Corp. | 2.55% |
| AT&T, Inc. | 2.43% |
| Healthpeak Properties, Inc. | 2.41% |
| * Excluding money market fund holdings, if any. |
Sector allocation
(% of net assets)
(% of net assets)
Top ten holdings*
(% of net assets)
(% of net assets)
| Altria Group, Inc. | 3.10% |
| Crown Castle, Inc. | 3.03% |
| Verizon Communications, Inc. | 3.01% |
| LyondellBasell Industries N.V., Class A | 2.87% |
| Dow, Inc. | 2.66% |
| Pfizer, Inc. | 2.65% |
| VICI Properties, Inc. | 2.63% |
| Realty Income Corp. | 2.55% |
| AT&T, Inc. | 2.43% |
| Healthpeak Properties, Inc. | 2.41% |
| * Excluding money market fund holdings, if any. |
What Were The Fund Costs For The Last Six Months ?
(Based on a hypothetical $10,000 investment)
| Fund | Costs of a $10,000 investment | Costs paid as a percentage of a $10,000 investment* |
| Invesco Variable Rate Preferred ETF | $25 | 0.50% |
| * |
Annualized.
|
What Are Key Statistics About The Fund?
(as of February 28, 2025)
| Fund net assets | $2,029,637,387 |
| Total number of portfolio holdings | 316 |
| Portfolio turnover rate | 9% |
What Comprised The Fund's Holdings?
(as of February 28, 2025)
Top ten holdings*
(% of net assets)
(% of net assets)
| Wells Fargo & Co., Series BB, 3.90% | 1.42% |
| Citigroup Capital XIII, Pfd., 10.92% | 1.12% |
| JPMorgan Chase & Co., Series NN, 6.88% | 1.09% |
| Charles Schwab Corp. (The), Series G, 5.38% | 1.02% |
| BP Capital Markets PLC, 4.88% | 1.00% |
| Goldman Sachs Group, Inc. (The), Series X, 7.50% | 0.98% |
| JPMorgan Chase & Co., Series OO, 6.50% | 0.96% |
| Bank of America Corp., Series FF, 5.88% | 0.94% |
| CVS Health Corp., 7.00%, 03/10/2055 | 0.94% |
| Citigroup, Inc., Series X, 3.88% | 0.93% |
| * Excluding money market fund holdings, if any. |
Sector allocation
(% of net assets)
(% of net assets)
Top ten holdings*
(% of net assets)
(% of net assets)
| Wells Fargo & Co., Series BB, 3.90% | 1.42% |
| Citigroup Capital XIII, Pfd., 10.92% | 1.12% |
| JPMorgan Chase & Co., Series NN, 6.88% | 1.09% |
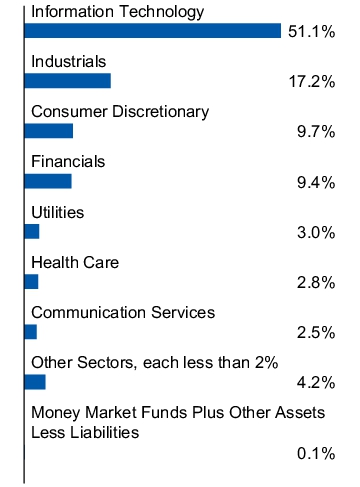
| Charles Schwab Corp. (The), Series G, 5.38% | 1.02% |
| BP Capital Markets PLC, 4.88% | 1.00% |
| Goldman Sachs Group, Inc. (The), Series X, 7.50% | 0.98% |
| JPMorgan Chase & Co., Series OO, 6.50% | 0.96% |
| Bank of America Corp., Series FF, 5.88% | 0.94% |
| CVS Health Corp., 7.00%, 03/10/2055 | 0.94% |
| Citigroup, Inc., Series X, 3.88% | 0.93% |
| * Excluding money market fund holdings, if any. |
What Were The Fund Costs For The Last Six Months ?
(Based on a hypothetical $10,000 investment)
| Fund | Costs of a $10,000 investment | Costs paid as a percentage of a $10,000 investment* |
| Invesco Russell 1000 Equal Weight ETF | $10 | 0.20% |
| * |
Annualized. |
What Are Key Statistics About The Fund?
(as of February 28, 2025)
| Fund net assets | $633,691,565 |
| Total number of portfolio holdings | 998 |
| Portfolio turnover rate | 14% |
What Comprised The Fund's Holdings?
(as of February 28, 2025)
Top ten holdings*
(% of net assets)
(% of net assets)
| AT&T, Inc. | 0.65% |
| T-Mobile US, Inc. | 0.64% |
| Cisco Systems, Inc. | 0.60% |
| Frontier Communications Parent, Inc. | 0.57% |
| Iridium Communications, Inc. | 0.57% |
| Verizon Communications, Inc. | 0.56% |
| Roku, Inc., Class A | 0.56% |
| Liberty Broadband Corp., Class C | 0.54% |
| Ubiquiti, Inc. | 0.54% |
| Juniper Networks, Inc. | 0.53% |
| * Excluding money market fund holdings, if any. |
Sector allocation
(% of net assets)
(% of net assets)
Top ten holdings*
(% of net assets)
(% of net assets)
| AT&T, Inc. | 0.65% |
| T-Mobile US, Inc. | 0.64% |
| Cisco Systems, Inc. | 0.60% |
| Frontier Communications Parent, Inc. | 0.57% |
| Iridium Communications, Inc. | 0.57% |
| Verizon Communications, Inc. | 0.56% |
| Roku, Inc., Class A | 0.56% |
| Liberty Broadband Corp., Class C | 0.54% |
| Ubiquiti, Inc. | 0.54% |
| Juniper Networks, Inc. | 0.53% |
| * Excluding money market fund holdings, if any. |
What Were The Fund Costs For The Last Six Months ?
(Based on a hypothetical $10,000 investment)
| Fund | Costs of a $10,000 investment | Costs paid as a percentage of a $10,000 investment* |
| Invesco S&P 500® ex-Rate Sensitive Low Volatility ETF | $13 | 0.25% |
| * |
Annualized.
|
What Are Key Statistics About The Fund?
(as of February 28, 2025)
| Fund net assets | $40,646,535 |
| Total number of portfolio holdings | 102 |
| Portfolio turnover rate | 37% |
What Comprised The Fund's Holdings?
(as of February 28, 2025)
Top ten holdings*
(% of net assets)
(% of net assets)
| Coca-Cola Co. (The) | 1.32% |
| Marsh & McLennan Cos., Inc. | 1.30% |
| Berkshire Hathaway, Inc., Class B | 1.28% |
| Republic Services, Inc. | 1.22% |
| Linde PLC | 1.18% |
| Procter & Gamble Co. (The) | 1.17% |
| Atmos Energy Corp. | 1.16% |
| Evergy, Inc. | 1.15% |
| Automatic Data Processing, Inc. | 1.15% |
| Johnson & Johnson | 1.13% |
| * Excluding money market fund holdings, if any. |
Sector allocation
(% of net assets)
(% of net assets)
Top ten holdings*
(% of net assets)
(% of net assets)
| Coca-Cola Co. (The) | 1.32% |
| Marsh & McLennan Cos., Inc. | 1.30% |
| Berkshire Hathaway, Inc., Class B | 1.28% |
| Republic Services, Inc. | 1.22% |
| Linde PLC | 1.18% |
| Procter & Gamble Co. (The) | 1.17% |
| Atmos Energy Corp. | 1.16% |
| Evergy, Inc. | 1.15% |
| Automatic Data Processing, Inc. | 1.15% |
| Johnson & Johnson | 1.13% |
| * Excluding money market fund holdings, if any. |
What Were The Fund Costs For The Last Six Months ?
(Based on a hypothetical $10,000 investment)
| Fund | Costs of a $10,000 investment | Costs paid as a percentage of a $10,000 investment* |
| Invesco S&P 500® Momentum ETF | $7 | 0.13% |
| * |
Annualized. |
What Are Key Statistics About The Fund?
(as of February 28, 2025)
| Fund net assets | $5,667,745,184 |
| Total number of portfolio holdings | 101 |
| Portfolio turnover rate | 21% |
What Comprised The Fund's Holdings?
(as of February 28, 2025)
Top ten holdings*
(% of net assets)
(% of net assets)
| Amazon.com, Inc. | 9.59% |
| NVIDIA Corp. | 8.44% |
| Meta Platforms, Inc., Class A | 7.08% |
| Berkshire Hathaway, Inc., Class B | 6.24% |
| Broadcom, Inc. | 6.21% |
| Eli Lilly and Co. | 6.02% |
| JPMorgan Chase & Co. | 5.46% |
| Costco Wholesale Corp. | 4.12% |
| Walmart, Inc. | 2.63% |
| General Electric Co. | 2.30% |
| * Excluding money market fund holdings, if any. |
Sector allocation
(% of net assets)
(% of net assets)
Top ten holdings*
(% of net assets)
(% of net assets)
| Amazon.com, Inc. | 9.59% |
| NVIDIA Corp. | 8.44% |
| Meta Platforms, Inc., Class A | 7.08% |
| Berkshire Hathaway, Inc., Class B | 6.24% |
| Broadcom, Inc. | 6.21% |
| Eli Lilly and Co. | 6.02% |
| JPMorgan Chase & Co. | 5.46% |
| Costco Wholesale Corp. | 4.12% |
| Walmart, Inc. | 2.63% |
| General Electric Co. | 2.30% |
| * Excluding money market fund holdings, if any. |
What Were The Fund Costs For The Last Six Months ?
(Based on a hypothetical $10,000 investment)
| Fund | Costs of a $10,000 investment | Costs paid as a percentage of a $10,000 investment* |
| Invesco S&P 500® Enhanced Value ETF | $7 | 0.13% |
| * |
Annualized.
|
What Are Key Statistics About The Fund?
(as of February 28, 2025)
| Fund net assets | $94,762,200 |
| Total number of portfolio holdings | 102 |
| Portfolio turnover rate | 15% |
What Comprised The Fund's Holdings?
(as of February 28, 2025)
Top ten holdings*
(% of net assets)
(% of net assets)
| Berkshire Hathaway, Inc., Class B | 5.49% |
| Bank of America Corp. | 4.93% |
| Exxon Mobil Corp. | 4.90% |
| Wells Fargo & Co. | 4.62% |
| Chevron Corp. | 4.50% |
| CVS Health Corp. | 3.42% |
| AT&T, Inc. | 3.35% |
| Citigroup, Inc. | 3.09% |
| Verizon Communications, Inc. | 3.03% |
| Comcast Corp., Class A | 2.97% |
| * Excluding money market fund holdings, if any. |
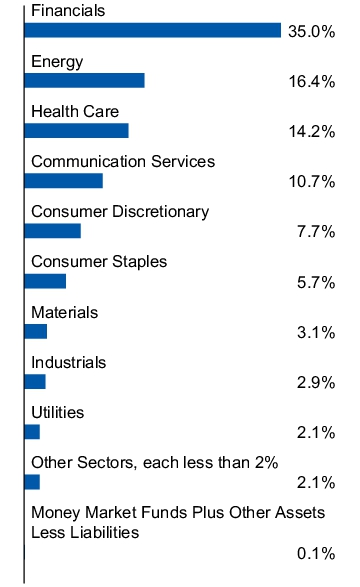
Sector allocation
(% of net assets)
(% of net assets)
Top ten holdings*
(% of net assets)
(% of net assets)
| Berkshire Hathaway, Inc., Class B | 5.49% |
| Bank of America Corp. | 4.93% |
| Exxon Mobil Corp. | 4.90% |
| Wells Fargo & Co. | 4.62% |
| Chevron Corp. | 4.50% |
| CVS Health Corp. | 3.42% |
| AT&T, Inc. | 3.35% |
| Citigroup, Inc. | 3.09% |
| Verizon Communications, Inc. | 3.03% |
| Comcast Corp., Class A | 2.97% |
| * Excluding money market fund holdings, if any. |
What Were The Fund Costs For The Last Six Months ?
(Based on a hypothetical $10,000 investment)
| Fund | Costs of a $10,000 investment | Costs paid as a percentage of a $10,000 investment* |
| Invesco Short Term Treasury ETF | $4 | 0.08% |
| * |
Annualized.
|
What Are Key Statistics About The Fund?
(as of February 28, 2025)
| Fund net assets | $2,033,620,848 |
| Total number of portfolio holdings | 84 |
What Comprised The Fund's Holdings?
(as of February 28, 2025)
Top ten holdings*
(% of net assets)
(% of net assets)
| U.S. Treasury Bills, 4.24%-4.50%, 04/03/2025 | 3.36% |
| U.S. Treasury Bills, 4.31%, 05/08/2025 | 2.70% |
| U.S. Treasury Bills, 4.00%-5.24%, 04/17/2025 | 2.59% |
| U.S. Treasury Bills, 4.39%, 05/22/2025 | 2.45% |
| U.S. Treasury Bills, 4.39%, 05/29/2025 | 2.40% |
| U.S. Treasury Bills, 4.04%-5.18%, 05/15/2025 | 2.39% |
| U.S. Treasury Bills, 4.19%-4.45%, 04/01/2025 | 2.22% |
| U.S. Treasury Bills, 4.23%-4.28%, 05/06/2025 | 2.14% |
| U.S. Treasury Bills, 4.24%-4.50%, 04/10/2025 | 2.02% |
| U.S. Treasury Bills, 4.22%-4.49%, 04/24/2025 | 1.96% |
| * Excluding money market fund holdings, if any. |
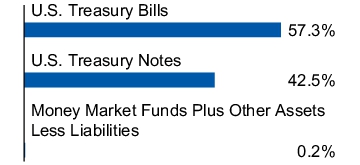
Security type allocation
(% of net assets)
(% of net assets)
Top ten holdings*
(% of net assets)
(% of net assets)
| U.S. Treasury Bills, 4.24%-4.50%, 04/03/2025 | 3.36% |
| U.S. Treasury Bills, 4.31%, 05/08/2025 | 2.70% |
| U.S. Treasury Bills, 4.00%-5.24%, 04/17/2025 | 2.59% |
| U.S. Treasury Bills, 4.39%, 05/22/2025 | 2.45% |
| U.S. Treasury Bills, 4.39%, 05/29/2025 | 2.40% |
| U.S. Treasury Bills, 4.04%-5.18%, 05/15/2025 | 2.39% |
| U.S. Treasury Bills, 4.19%-4.45%, 04/01/2025 | 2.22% |
| U.S. Treasury Bills, 4.23%-4.28%, 05/06/2025 | 2.14% |
| U.S. Treasury Bills, 4.24%-4.50%, 04/10/2025 | 2.02% |
| U.S. Treasury Bills, 4.22%-4.49%, 04/24/2025 | 1.96% |
| * Excluding money market fund holdings, if any. |
What Were The Fund Costs For The Last Six Months ?
(Based on a hypothetical $10,000 investment)
| Fund | Costs of a $10,000 investment | Costs paid as a percentage of a $10,000 investment* |
| Invesco S&P SmallCap High Dividend Low Volatility ETF | $15 | 0.30% |
| * |
Annualized. |
What Are Key Statistics About The Fund?
(as of February 28, 2025)
| Fund net assets | $67,087,076 |
| Total number of portfolio holdings | 62 |
| Portfolio turnover rate | 49% |
What Comprised The Fund's Holdings?
(as of February 28, 2025)
Top ten holdings*
(% of net assets)
(% of net assets)
| Two Harbors Investment Corp. | 3.33% |
| Global Net Lease, Inc. | 3.30% |
| Innovative Industrial Properties, Inc. | 3.15% |
| Ready Capital Corp. | 2.99% |
| Universal Health Realty Income Trust | 2.94% |
| Easterly Government Properties, Inc. | 2.90% |
| Apollo Commercial Real Estate Finance, Inc. | 2.87% |
| ARMOUR Residential REIT, Inc. | 2.87% |
| New York Mortgage Trust, Inc. | 2.85% |
| Brandywine Realty Trust | 2.81% |
| * Excluding money market fund holdings, if any. |
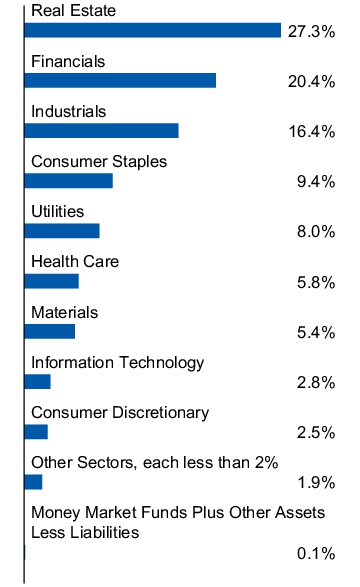
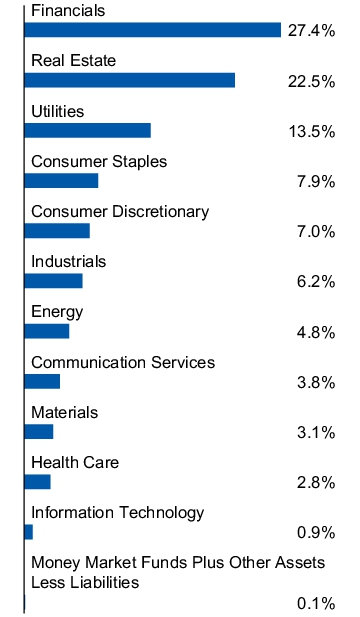
Sector allocation
(% of net assets)
(% of net assets)
Top ten holdings*
(% of net assets)
(% of net assets)
| Two Harbors Investment Corp. | 3.33% |
| Global Net Lease, Inc. | 3.30% |
| Innovative Industrial Properties, Inc. | 3.15% |
| Ready Capital Corp. | 2.99% |
| Universal Health Realty Income Trust | 2.94% |
| Easterly Government Properties, Inc. | 2.90% |
| Apollo Commercial Real Estate Finance, Inc. | 2.87% |
| ARMOUR Residential REIT, Inc. | 2.87% |
| New York Mortgage Trust, Inc. | 2.85% |
| Brandywine Realty Trust | 2.81% |
| * Excluding money market fund holdings, if any. |
What Were The Fund Costs For The Last Six Months ?
(Based on a hypothetical $10,000 investment)
| Fund | Costs of a $10,000 investment | Costs paid as a percentage of a $10,000 investment* |
| Invesco S&P SmallCap Quality ETF | $14 | 0.29% |
| * |
Annualized. |
What Are Key Statistics About The Fund?
(as of February 28, 2025)
| Fund net assets | $447,540,119 |
| Total number of portfolio holdings | 122 |
| Portfolio turnover rate | 32% |
What Comprised The Fund's Holdings?
(as of February 28, 2025)
Top ten holdings*
(% of net assets)
(% of net assets)
| Hims & Hers Health, Inc. | 3.38% |
| Armstrong World Industries, Inc. | 2.66% |
| Corcept Therapeutics, Inc. | 2.21% |
| PJT Partners, Inc., Class A | 2.20% |
| Robert Half, Inc. | 2.01% |
| InterDigital, Inc. | 1.99% |
| Artisan Partners Asset Management, Inc., Class A | 1.94% |
| Alkermes PLC | 1.93% |
| Badger Meter, Inc. | 1.80% |
| Installed Building Products, Inc. | 1.69% |
| * Excluding money market fund holdings, if any. |
Sector allocation
(% of net assets)
(% of net assets)
Top ten holdings*
(% of net assets)
(% of net assets)
| Hims & Hers Health, Inc. | 3.38% |
| Armstrong World Industries, Inc. | 2.66% |
| Corcept Therapeutics, Inc. | 2.21% |
| PJT Partners, Inc., Class A | 2.20% |
| Robert Half, Inc. | 2.01% |
| InterDigital, Inc. | 1.99% |
| Artisan Partners Asset Management, Inc., Class A | 1.94% |
| Alkermes PLC | 1.93% |
| Badger Meter, Inc. | 1.80% |
| Installed Building Products, Inc. | 1.69% |
| * Excluding money market fund holdings, if any. |
What Were The Fund Costs For The Last Six Months ?
(Based on a hypothetical $10,000 investment)
| Fund | Costs of a $10,000 investment | Costs paid as a percentage of a $10,000 investment* |
| Invesco S&P 500 Minimum Variance ETF | $5 | 0.10% |
| * |
Annualized. |
What Are Key Statistics About The Fund?
(as of February 28, 2025)
| Fund net assets | $5,778,870 |
| Total number of portfolio holdings | 77 |
| Portfolio turnover rate | 23% |
What Comprised The Fund's Holdings?
(as of February 28, 2025)
Top ten holdings*
(% of net assets)
(% of net assets)
| T-Mobile US, Inc. | 3.77% |
| Cisco Systems, Inc. | 3.63% |
| GE Vernova, Inc. | 3.57% |
| Aon PLC, Class A | 3.31% |
| Abbott Laboratories | 3.29% |
| Amazon.com, Inc. | 3.20% |
| Berkshire Hathaway, Inc., Class B | 3.16% |
| Apple, Inc. | 3.02% |
| Arthur J. Gallagher & Co. | 2.96% |
| NVIDIA Corp. | 2.96% |
| * Excluding money market fund holdings, if any. |
Sector allocation
(% of net assets)
(% of net assets)
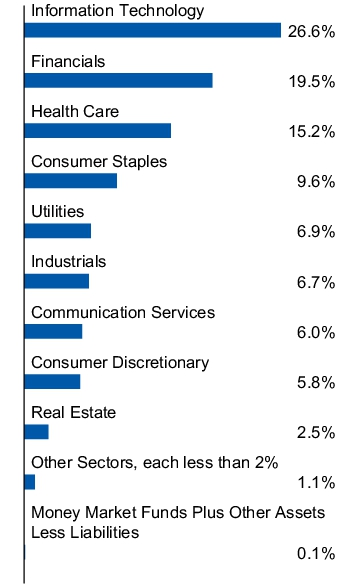
Top ten holdings*
(% of net assets)
(% of net assets)
| T-Mobile US, Inc. | 3.77% |
| Cisco Systems, Inc. | 3.63% |
| GE Vernova, Inc. | 3.57% |
| Aon PLC, Class A | 3.31% |
| Abbott Laboratories | 3.29% |
| Amazon.com, Inc. | 3.20% |
| Berkshire Hathaway, Inc., Class B | 3.16% |
| Apple, Inc. | 3.02% |
| Arthur J. Gallagher & Co. | 2.96% |
| NVIDIA Corp. | 2.96% |
| * Excluding money market fund holdings, if any. |
What Were The Fund Costs For The Last Six Months ?
(Based on a hypothetical $10,000 investment)
| Fund | Costs of a $10,000 investment | Costs paid as a percentage of a $10,000 investment* |
| Invesco MSCI USA ETF | $2 | 0.04% |
| * |
Annualized. |
What Are Key Statistics About The Fund?
(as of February 28, 2025)
| Fund net assets | $6,046,647,858 |
| Total number of portfolio holdings | 580 |
| Portfolio turnover rate | 1% |
What Comprised The Fund's Holdings?
(as of February 28, 2025)
Top ten holdings*
(% of net assets)
(% of net assets)
| Apple, Inc. | 6.97% |
| NVIDIA Corp. | 5.87% |
| Microsoft Corp. | 5.38% |
| Amazon.com, Inc. | 3.85% |
| Meta Platforms, Inc., Class A | 2.79% |
| Alphabet, Inc., Class A | 1.91% |
| Broadcom, Inc. | 1.70% |
| Alphabet, Inc., Class C | 1.65% |
| Tesla, Inc. | 1.62% |
| JPMorgan Chase & Co. | 1.43% |
| * Excluding money market fund holdings, if any. |
Sector allocation
(% of net assets)
(% of net assets)

Top ten holdings*
(% of net assets)
(% of net assets)
| Apple, Inc. | 6.97% |
| NVIDIA Corp. | 5.87% |
| Microsoft Corp. | 5.38% |
| Amazon.com, Inc. | 3.85% |
| Meta Platforms, Inc., Class A | 2.79% |
| Alphabet, Inc., Class A | 1.91% |
| Broadcom, Inc. | 1.70% |
| Alphabet, Inc., Class C | 1.65% |
| Tesla, Inc. | 1.62% |
| JPMorgan Chase & Co. | 1.43% |
| * Excluding money market fund holdings, if any. |
What Were The Fund Costs For The Last Six Months ?
(Based on a hypothetical $10,000 investment)
| Fund | Costs of a $10,000 investment | Costs paid as a percentage of a $10,000 investment* |
| Invesco Solar ETF | $31 | 0.70% |
| * |
Annualized. |
What Are Key Statistics About The Fund?
(as of February 28, 2025)
| Fund net assets | $773,404,556 |
| Total number of portfolio holdings | 35 |
| Portfolio turnover rate | 20% |
What Comprised The Fund's Holdings?
(as of February 28, 2025)
Top ten holdings*
(% of net assets)
(% of net assets)
| Nextracker, Inc., Class A | 10.88% |
| Enphase Energy, Inc. | 8.30% |
| First Solar, Inc. | 7.29% |
| GCL Technology Holdings Ltd. | 6.89% |
| Xinyi Solar Holdings Ltd. | 4.85% |
| HA Sustainable Infrastructure Capital, Inc. | 4.24% |
| Neoen S.A. | 4.02% |
| Sunrun, Inc. | 3.94% |
| SolarEdge Technologies, Inc. | 3.54% |
| Clearway Energy, Inc., Class C | 3.51% |
| * Excluding money market fund holdings, if any. |
Industry allocation
(% of net assets)
(% of net assets)
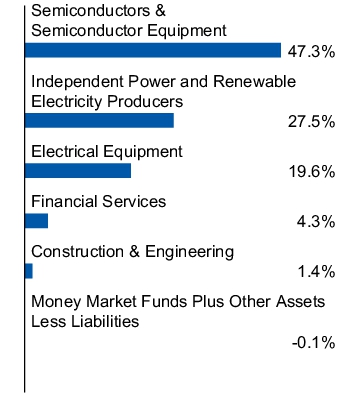
Top ten holdings*
(% of net assets)
(% of net assets)
| Nextracker, Inc., Class A | 10.88% |
| Enphase Energy, Inc. | 8.30% |
| First Solar, Inc. | 7.29% |
| GCL Technology Holdings Ltd. | 6.89% |
| Xinyi Solar Holdings Ltd. | 4.85% |
| HA Sustainable Infrastructure Capital, Inc. | 4.24% |
| Neoen S.A. | 4.02% |
| Sunrun, Inc. | 3.94% |
| SolarEdge Technologies, Inc. | 3.54% |
| Clearway Energy, Inc., Class C | 3.51% |
| * Excluding money market fund holdings, if any. |
What Were The Fund Costs For The Last Six Months ?
(Based on a hypothetical $10,000 investment)
| Fund | Costs of a $10,000 investment | Costs paid as a percentage of a $10,000 investment* |
| Invesco S&P 500 Revenue ETF | $20 | 0.39% |
| * |
Annualized. |
What Are Key Statistics About The Fund?
(as of February 28, 2025)
| Fund net assets | $5,184,117,913 |
| Total number of portfolio holdings | 504 |
| Portfolio turnover rate | 9% |
What Comprised The Fund's Holdings?
(as of February 28, 2025)
Top ten holdings*
(% of net assets)
(% of net assets)
| Walmart, Inc. | 3.98% |
| Amazon.com, Inc. | 3.25% |
| CVS Health Corp. | 2.66% |
| Berkshire Hathaway, Inc., Class B | 2.34% |
| Apple, Inc. | 2.18% |
| McKesson Corp. | 2.08% |
| UnitedHealth Group, Inc. | 1.99% |
| Exxon Mobil Corp. | 1.92% |
| Cencora, Inc. | 1.83% |
| JPMorgan Chase & Co. | 1.70% |
| * Excluding money market fund holdings, if any. |
Sector allocation
(% of net assets)
(% of net assets)
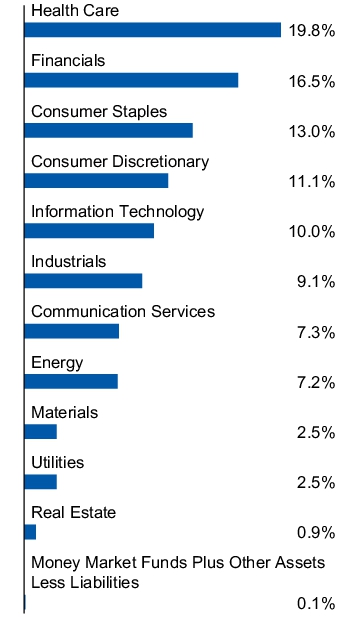
Top ten holdings*
(% of net assets)
(% of net assets)
| Walmart, Inc. | 3.98% |
| Amazon.com, Inc. | 3.25% |
| CVS Health Corp. | 2.66% |
| Berkshire Hathaway, Inc., Class B | 2.34% |
| Apple, Inc. | 2.18% |
| McKesson Corp. | 2.08% |
| UnitedHealth Group, Inc. | 1.99% |
| Exxon Mobil Corp. | 1.92% |
| Cencora, Inc. | 1.83% |
| JPMorgan Chase & Co. | 1.70% |
| * Excluding money market fund holdings, if any. |
What Were The Fund Costs For The Last Six Months ?
(Based on a hypothetical $10,000 investment)
| Fund | Costs of a $10,000 investment | Costs paid as a percentage of a $10,000 investment* |
| Invesco S&P MidCap 400 Revenue ETF | $19 | 0.39% |
| * |
Annualized. |
What Are Key Statistics About The Fund?
(as of February 28, 2025)
| Fund net assets | $887,027,849 |
| Total number of portfolio holdings | 401 |
| Portfolio turnover rate | 15% |
What Comprised The Fund's Holdings?
(as of February 28, 2025)
Top ten holdings*
(% of net assets)
(% of net assets)
| TD SYNNEX Corp. | 2.99% |
| Performance Food Group Co. | 2.64% |
| American Airlines Group, Inc. | 2.05% |
| US Foods Holding Corp. | 1.80% |
| Lithia Motors, Inc., Class A | 1.47% |
| Penske Automotive Group, Inc. | 1.45% |
| AutoNation, Inc. | 1.29% |
| HF Sinclair Corp. | 1.27% |
| Flex Ltd. | 1.22% |
| Arrow Electronics, Inc. | 1.18% |
| * Excluding money market fund holdings, if any. |
Sector allocation
(% of net assets)
(% of net assets)
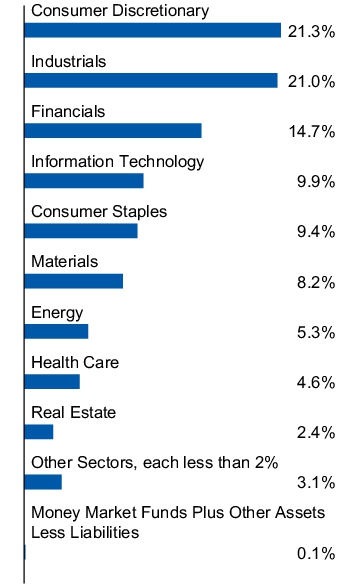
Top ten holdings*
(% of net assets)
(% of net assets)
| TD SYNNEX Corp. | 2.99% |
| Performance Food Group Co. | 2.64% |
| American Airlines Group, Inc. | 2.05% |
| US Foods Holding Corp. | 1.80% |
| Lithia Motors, Inc., Class A | 1.47% |
| Penske Automotive Group, Inc. | 1.45% |
| AutoNation, Inc. | 1.29% |
| HF Sinclair Corp. | 1.27% |
| Flex Ltd. | 1.22% |
| Arrow Electronics, Inc. | 1.18% |
| * Excluding money market fund holdings, if any. |
What Were The Fund Costs For The Last Six Months ?
(Based on a hypothetical $10,000 investment)
| Fund | Costs of a $10,000 investment | Costs paid as a percentage of a $10,000 investment* |
| Invesco S&P SmallCap 600 Revenue ETF | $19 | 0.39% |
| * |
Annualized. |
What Are Key Statistics About The Fund?
(as of February 28, 2025)
| Fund net assets | $1,733,439,172 |
| Total number of portfolio holdings | 598 |
| Portfolio turnover rate | 20% |
What Comprised The Fund's Holdings?
(as of February 28, 2025)
Top ten holdings*
(% of net assets)
(% of net assets)
| World Kinect Corp. | 3.79% |
| EchoStar Corp., Class A | 3.01% |
| United Natural Foods, Inc. | 2.90% |
| Group 1 Automotive, Inc. | 1.67% |
| Asbury Automotive Group, Inc. | 1.42% |
| Lincoln National Corp. | 1.42% |
| Sonic Automotive, Inc., Class A | 1.15% |
| Kohl's Corp. | 1.06% |
| Alaska Air Group, Inc. | 0.99% |
| Dana, Inc. | 0.98% |
| * Excluding money market fund holdings, if any. |
Sector allocation
(% of net assets)
(% of net assets)
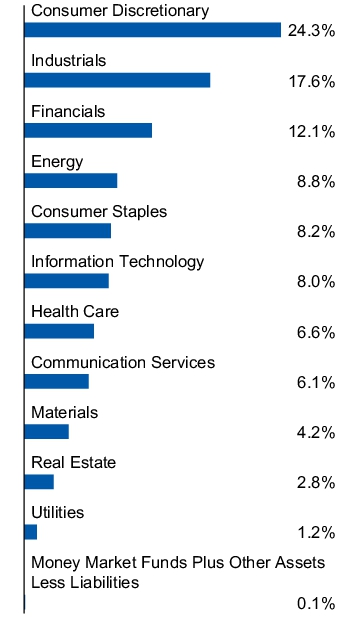
Top ten holdings*
(% of net assets)
(% of net assets)
| World Kinect Corp. | 3.79% |
| EchoStar Corp., Class A | 3.01% |
| United Natural Foods, Inc. | 2.90% |
| Group 1 Automotive, Inc. | 1.67% |
| Asbury Automotive Group, Inc. | 1.42% |
| Lincoln National Corp. | 1.42% |
| Sonic Automotive, Inc., Class A | 1.15% |
| Kohl's Corp. | 1.06% |
| Alaska Air Group, Inc. | 0.99% |
| Dana, Inc. | 0.98% |
| * Excluding money market fund holdings, if any. |
What Were The Fund Costs For The Last Six Months ?
(Based on a hypothetical $10,000 investment)
| Fund | Costs of a $10,000 investment | Costs paid as a percentage of a $10,000 investment* |
| Invesco S&P Ultra Dividend Revenue ETF | $20 | 0.39% |
| * |
Annualized. |
What Are Key Statistics About The Fund?
(as of February 28, 2025)
| Fund net assets | $827,769,656 |
| Total number of portfolio holdings | 63 |
| Portfolio turnover rate | 49% |
What Comprised The Fund's Holdings?
(as of February 28, 2025)
Top ten holdings*
(% of net assets)
(% of net assets)
| Philip Morris International, Inc. | 5.98% |
| CVS Health Corp. | 5.90% |
| Best Buy Co., Inc. | 5.20% |
| Chevron Corp. | 4.99% |
| Bristol-Myers Squibb Co. | 4.89% |
| Prudential Financial, Inc. | 4.81% |
| U.S. Bancorp | 4.68% |
| Ford Motor Co. | 4.62% |
| HF Sinclair Corp. | 4.24% |
| 3M Co. | 4.00% |
| * Excluding money market fund holdings, if any. |
Sector allocation
(% of net assets)
(% of net assets)
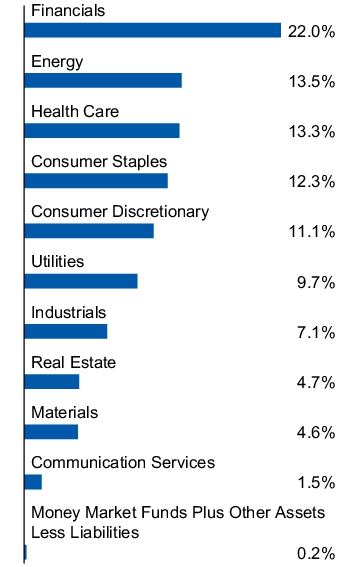
Top ten holdings*
(% of net assets)
(% of net assets)
| Philip Morris International, Inc. | 5.98% |
| CVS Health Corp. | 5.90% |
| Best Buy Co., Inc. | 5.20% |
| Chevron Corp. | 4.99% |
| Bristol-Myers Squibb Co. | 4.89% |
| Prudential Financial, Inc. | 4.81% |
| U.S. Bancorp | 4.68% |
| Ford Motor Co. | 4.62% |
| HF Sinclair Corp. | 4.24% |
| 3M Co. | 4.00% |
| * Excluding money market fund holdings, if any. |
What Were The Fund Costs For The Last Six Months ?
(Based on a hypothetical $10,000 investment)
| Fund | Costs of a $10,000 investment | Costs paid as a percentage of a $10,000 investment* |
| Invesco NASDAQ 100 ETF | $8 | 0.15% |
| * |
Annualized.
|
What Are Key Statistics About The Fund?
(as of February 28, 2025)
| Fund net assets | $42,678,756,347 |
| Total number of portfolio holdings | 104 |
| Portfolio turnover rate | 4% |
What Comprised The Fund's Holdings?
(as of February 28, 2025)
Top ten holdings*
(% of net assets)
(% of net assets)
| Apple, Inc. | 9.50% |
| NVIDIA Corp. | 7.95% |
| Microsoft Corp. | 7.67% |
| Amazon.com, Inc. | 5.80% |
| Broadcom, Inc. | 4.01% |
| Meta Platforms, Inc., Class A | 3.79% |
| Costco Wholesale Corp. | 2.97% |
| Tesla, Inc. | 2.76% |
| Netflix, Inc. | 2.68% |
| Alphabet, Inc., Class A | 2.58% |
| * Excluding money market fund holdings, if any. |
Sector allocation
(% of net assets)
(% of net assets)
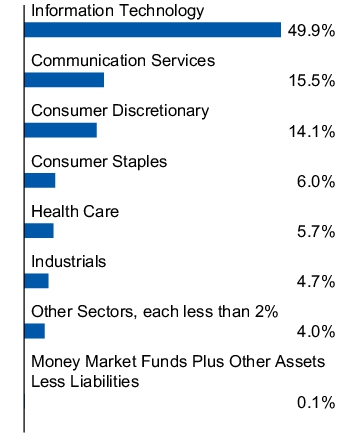
Top ten holdings*
(% of net assets)
(% of net assets)
| Apple, Inc. | 9.50% |
| NVIDIA Corp. | 7.95% |
| Microsoft Corp. | 7.67% |
| Amazon.com, Inc. | 5.80% |
| Broadcom, Inc. | 4.01% |
| Meta Platforms, Inc., Class A | 3.79% |
| Costco Wholesale Corp. | 2.97% |
| Tesla, Inc. | 2.76% |
| Netflix, Inc. | 2.68% |
| Alphabet, Inc., Class A | 2.58% |
| * Excluding money market fund holdings, if any. |
What Were The Fund Costs For The Last Six Months ?
(Based on a hypothetical $10,000 investment)
| Fund | Costs of a $10,000 investment | Costs paid as a percentage of a $10,000 investment* |
| Invesco NASDAQ Next Gen 100 ETF | $8 | 0.15% |
| * |
Annualized. |
What Are Key Statistics About The Fund?
(as of February 28, 2025)
| Fund net assets | $638,084,818 |
| Total number of portfolio holdings | 111 |
| Portfolio turnover rate | 24% |
What Comprised The Fund's Holdings?
(as of February 28, 2025)
Top ten holdings*
(% of net assets)
(% of net assets)
| Alnylam Pharmaceuticals, Inc. | 1.96% |
| eBay, Inc. | 1.91% |
| United Airlines Holdings, Inc. | 1.90% |
| Monolithic Power Systems, Inc. | 1.84% |
| Tractor Supply Co. | 1.82% |
| Expedia Group, Inc. | 1.50% |
| Super Micro Computer, Inc. | 1.50% |
| Check Point Software Technologies Ltd. | 1.49% |
| VeriSign, Inc. | 1.41% |
| Expand Energy Corp. | 1.41% |
| * Excluding money market fund holdings, if any. |
Sector allocation
(% of net assets)
(% of net assets)
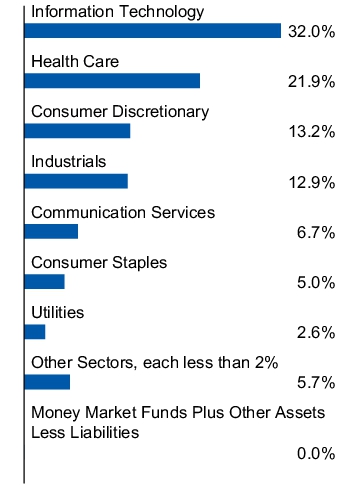
Top ten holdings*
(% of net assets)
(% of net assets)
| Alnylam Pharmaceuticals, Inc. | 1.96% |
| eBay, Inc. | 1.91% |
| United Airlines Holdings, Inc. | 1.90% |
| Monolithic Power Systems, Inc. | 1.84% |
| Tractor Supply Co. | 1.82% |
| Expedia Group, Inc. | 1.50% |
| Super Micro Computer, Inc. | 1.50% |
| Check Point Software Technologies Ltd. | 1.49% |
| VeriSign, Inc. | 1.41% |
| Expand Energy Corp. | 1.41% |
| * Excluding money market fund holdings, if any. |
What Were The Fund Costs For The Last Six Months ?
(Based on a hypothetical $10,000 investment)
| Fund | Costs of a $10,000 investment | Costs paid as a percentage of a $10,000 investment* |
| Invesco S&P 500 QVM Multi-factor ETF | $6 | 0.11% |
| * |
Annualized. |
What Are Key Statistics About The Fund?
(as of February 28, 2025)
| Fund net assets | $1,229,289,214 |
| Total number of portfolio holdings | 454 |
| Portfolio turnover rate | 7% |
What Comprised The Fund's Holdings?
(as of February 28, 2025)
Top ten holdings*
(% of net assets)
(% of net assets)
| Apple, Inc. | 8.07% |
| NVIDIA Corp. | 6.95% |
| Amazon.com, Inc. | 4.07% |
| Alphabet, Inc., Class C | 3.61% |
| Meta Platforms, Inc., Class A | 3.02% |
| Berkshire Hathaway, Inc., Class B | 2.24% |
| Broadcom, Inc. | 1.87% |
| JPMorgan Chase & Co. | 1.76% |
| Eli Lilly and Co. | 1.65% |
| Visa, Inc., Class A | 1.38% |
| * Excluding money market fund holdings, if any. |
Sector allocation
(% of net assets)
(% of net assets)
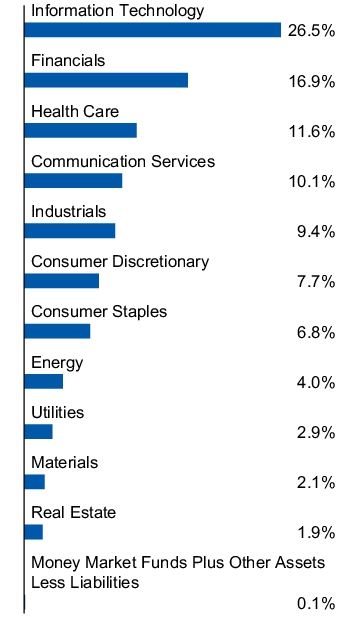
Top ten holdings*
(% of net assets)
(% of net assets)
| Apple, Inc. | 8.07% |
| NVIDIA Corp. | 6.95% |
| Amazon.com, Inc. | 4.07% |
| Alphabet, Inc., Class C | 3.61% |
| Meta Platforms, Inc., Class A | 3.02% |
| Berkshire Hathaway, Inc., Class B | 2.24% |
| Broadcom, Inc. | 1.87% |
| JPMorgan Chase & Co. | 1.76% |
| Eli Lilly and Co. | 1.65% |
| Visa, Inc., Class A | 1.38% |
| * Excluding money market fund holdings, if any. |
What Were The Fund Costs For The Last Six Months ?
(Based on a hypothetical $10,000 investment)
| Fund | Costs of a $10,000 investment | Costs paid as a percentage of a $10,000 investment* |
| Invesco S&P MidCap 400 QVM Multi-factor ETF | $7 | 0.15% |
| * |
Annualized. |
What Are Key Statistics About The Fund?
(as of February 28, 2025)
| Fund net assets | $348,210,092 |
| Total number of portfolio holdings | 362 |
| Portfolio turnover rate | 17% |
What Comprised The Fund's Holdings?
(as of February 28, 2025)
Top ten holdings*
(% of net assets)
(% of net assets)
| Interactive Brokers Group, Inc., Class A | 0.89% |
| Williams-Sonoma, Inc. | 0.85% |
| Expand Energy Corp. | 0.76% |
| EMCOR Group, Inc. | 0.76% |
| Watsco, Inc. | 0.70% |
| Fidelity National Financial, Inc. | 0.66% |
| US Foods Holding Corp. | 0.66% |
| Reliance, Inc. | 0.64% |
| Dynatrace, Inc. | 0.64% |
| Carlisle Cos., Inc. | 0.63% |
| * Excluding money market fund holdings, if any. |
Sector allocation
(% of net assets)
(% of net assets)
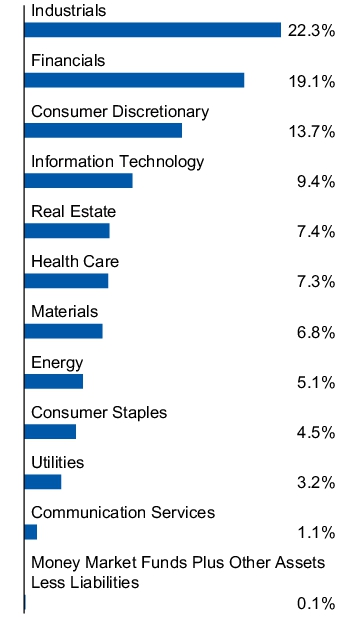
Top ten holdings*
(% of net assets)
(% of net assets)
| Interactive Brokers Group, Inc., Class A | 0.89% |
| Williams-Sonoma, Inc. | 0.85% |
| Expand Energy Corp. | 0.76% |
| EMCOR Group, Inc. | 0.76% |
| Watsco, Inc. | 0.70% |
| Fidelity National Financial, Inc. | 0.66% |
| US Foods Holding Corp. | 0.66% |
| Reliance, Inc. | 0.64% |
| Dynatrace, Inc. | 0.64% |
| Carlisle Cos., Inc. | 0.63% |
| * Excluding money market fund holdings, if any. |
What Were The Fund Costs For The Last Six Months ?
(Based on a hypothetical $10,000 investment)
| Fund | Costs of a $10,000 investment | Costs paid as a percentage of a $10,000 investment* |
| Invesco S&P SmallCap 600 QVM Multi-factor ETF | $7 | 0.15% |
| * |
Annualized. |
What Are Key Statistics About The Fund?
(as of February 28, 2025)
| Fund net assets | $192,172,527 |
| Total number of portfolio holdings | 539 |
| Portfolio turnover rate | 18% |
What Comprised The Fund's Holdings?
(as of February 28, 2025)
Top ten holdings*
(% of net assets)
(% of net assets)
| Hims & Hers Health, Inc. | 0.77% |
| V.F. Corp. | 0.66% |
| ATI, Inc. | 0.64% |
| Jackson Financial, Inc., Class A | 0.64% |
| Alaska Air Group, Inc. | 0.63% |
| Brinker International, Inc. | 0.63% |
| Mr. Cooper Group, Inc. | 0.62% |
| SPX Technologies, Inc. | 0.62% |
| Lincoln National Corp. | 0.60% |
| Armstrong World Industries, Inc. | 0.57% |
| * Excluding money market fund holdings, if any. |
Sector allocation
(% of net assets)
(% of net assets)
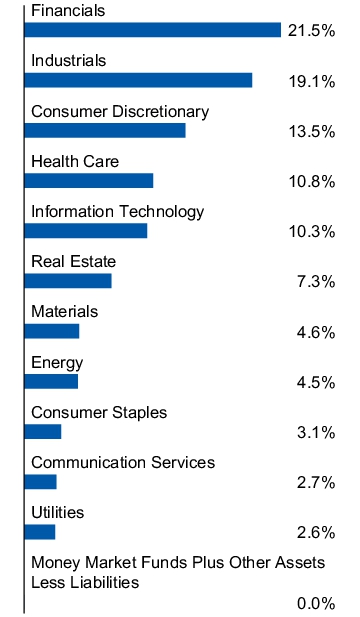
Top ten holdings*
(% of net assets)
(% of net assets)
| Hims & Hers Health, Inc. | 0.77% |
| V.F. Corp. | 0.66% |
| ATI, Inc. | 0.64% |
| Jackson Financial, Inc., Class A | 0.64% |
| Alaska Air Group, Inc. | 0.63% |
| Brinker International, Inc. | 0.63% |
| Mr. Cooper Group, Inc. | 0.62% |
| SPX Technologies, Inc. | 0.62% |
| Lincoln National Corp. | 0.60% |
| Armstrong World Industries, Inc. | 0.57% |
| * Excluding money market fund holdings, if any. |
What Were The Fund Costs For The Last Six Months ?
(Based on a hypothetical $10,000 investment)
| Fund | Costs of a $10,000 investment | Costs paid as a percentage of a $10,000 investment* |
| Invesco Nasdaq Biotechnology ETF | $9 | 0.19% |
| * |
Annualized. |
What Are Key Statistics About The Fund?
(as of February 28, 2025)
| Fund net assets | $39,938,792 |
| Total number of portfolio holdings | 270 |
| Portfolio turnover rate | 10% |
What Comprised The Fund's Holdings?
(as of February 28, 2025)
Top ten holdings*
(% of net assets)
(% of net assets)
| Gilead Sciences, Inc. | 10.20% |
| Amgen, Inc. | 9.00% |
| Vertex Pharmaceuticals, Inc. | 8.47% |
| Regeneron Pharmaceuticals, Inc. | 7.21% |
| AstraZeneca PLC, ADR | 4.24% |
| Alnylam Pharmaceuticals, Inc. | 3.04% |
| Biogen, Inc. | 1.95% |
| argenx SE, ADR | 1.93% |
| Sanofi S.A., ADR | 1.56% |
| Summit Therapeutics, Inc. | 1.46% |
| * Excluding money market fund holdings, if any. |
Industry allocation
(% of net assets)
(% of net assets)
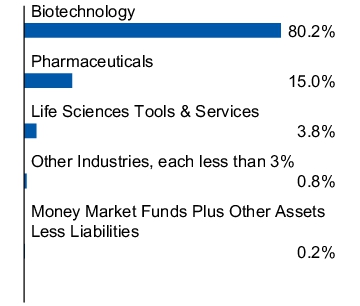
Top ten holdings*
(% of net assets)
(% of net assets)
| Gilead Sciences, Inc. | 10.20% |
| Amgen, Inc. | 9.00% |
| Vertex Pharmaceuticals, Inc. | 8.47% |
| Regeneron Pharmaceuticals, Inc. | 7.21% |
| AstraZeneca PLC, ADR | 4.24% |
| Alnylam Pharmaceuticals, Inc. | 3.04% |
| Biogen, Inc. | 1.95% |
| argenx SE, ADR | 1.93% |
| Sanofi S.A., ADR | 1.56% |
| Summit Therapeutics, Inc. | 1.46% |
| * Excluding money market fund holdings, if any. |
What Were The Fund Costs For The Last Six Months ?
(Based on a hypothetical $10,000 investment)
| Fund | Costs of a $10,000 investment | Costs paid as a percentage of a $10,000 investment* |
| Invesco PHLX Semiconductor ETF | $9 | 0.19% |
| * |
Annualized. |
What Are Key Statistics About The Fund?
(as of February 28, 2025)
| Fund net assets | $428,148,220 |
| Total number of portfolio holdings | 33 |
| Portfolio turnover rate | 14% |
What Comprised The Fund's Holdings?
(as of February 28, 2025)
Top ten holdings*
(% of net assets)
(% of net assets)
| Broadcom, Inc. | 12.77% |
| NVIDIA Corp. | 11.25% |
| Advanced Micro Devices, Inc. | 6.04% |
| KLA Corp. | 4.55% |
| Analog Devices, Inc. | 4.38% |
| Lam Research Corp. | 4.31% |
| ASML Holding N.V., New York Shares | 4.29% |
| QUALCOMM, Inc. | 4.11% |
| Marvell Technology, Inc. | 4.11% |
| Intel Corp. | 4.09% |
| * Excluding money market fund holdings, if any. |
Industry allocation
(% of net assets)
(% of net assets)
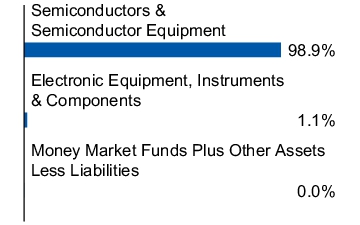
Top ten holdings*
(% of net assets)
(% of net assets)
| Broadcom, Inc. | 12.77% |
| NVIDIA Corp. | 11.25% |
| Advanced Micro Devices, Inc. | 6.04% |
| KLA Corp. | 4.55% |
| Analog Devices, Inc. | 4.38% |
| Lam Research Corp. | 4.31% |
| ASML Holding N.V., New York Shares | 4.29% |
| QUALCOMM, Inc. | 4.11% |
| Marvell Technology, Inc. | 4.11% |
| Intel Corp. | 4.09% |
| * Excluding money market fund holdings, if any. |
What Were The Fund Costs For The Last Six Months ?
(Based on a hypothetical $10,000 investment)
| Fund | Costs of a $10,000 investment | Costs paid as a percentage of a $10,000 investment* |
| Invesco ESG NASDAQ 100 ETF | $10 | 0.20% |
| * |
Annualized. |
What Are Key Statistics About The Fund?
(as of February 28, 2025)
| Fund net assets | $72,341,956 |
| Total number of portfolio holdings | 94 |
| Portfolio turnover rate | 5% |
What Comprised The Fund's Holdings?
(as of February 28, 2025)
Top ten holdings*
(% of net assets)
(% of net assets)
| Apple, Inc. | 11.08% |
| NVIDIA Corp. | 10.83% |
| Microsoft Corp. | 9.93% |
| Broadcom, Inc. | 4.19% |
| Netflix, Inc. | 3.30% |
| Amazon.com, Inc. | 3.20% |
| Cisco Systems, Inc. | 2.22% |
| Tesla, Inc. | 2.12% |
| Alphabet, Inc., Class A | 2.09% |
| Linde PLC | 2.02% |
| * Excluding money market fund holdings, if any. |
Sector allocation
(% of net assets)
(% of net assets)
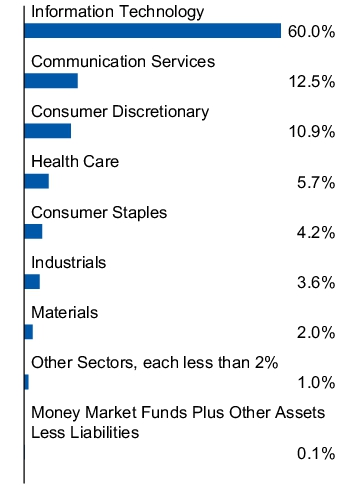
Top ten holdings*
(% of net assets)
(% of net assets)
| Apple, Inc. | 11.08% |
| NVIDIA Corp. | 10.83% |
| Microsoft Corp. | 9.93% |
| Broadcom, Inc. | 4.19% |
| Netflix, Inc. | 3.30% |
| Amazon.com, Inc. | 3.20% |
| Cisco Systems, Inc. | 2.22% |
| Tesla, Inc. | 2.12% |
| Alphabet, Inc., Class A | 2.09% |
| Linde PLC | 2.02% |
| * Excluding money market fund holdings, if any. |
What Were The Fund Costs For The Last Six Months ?
(Based on a hypothetical $10,000 investment)
| Fund | Costs of a $10,000 investment | Costs paid as a percentage of a $10,000 investment* |
| Invesco ESG NASDAQ Next Gen 100 ETF | $10 | 0.20% |
| * |
Annualized. |
What Are Key Statistics About The Fund?
(as of February 28, 2025)
| Fund net assets | $5,894,950 |
| Total number of portfolio holdings | 96 |
| Portfolio turnover rate | 19% |
What Comprised The Fund's Holdings?
(as of February 28, 2025)
Top ten holdings*
(% of net assets)
(% of net assets)
| Tractor Supply Co. | 2.63% |
| eBay, Inc. | 2.61% |
| Monolithic Power Systems, Inc. | 2.14% |
| Seagate Technology Holdings PLC | 2.09% |
| Check Point Software Technologies Ltd. | 1.83% |
| Trimble, Inc. | 1.83% |
| NetApp, Inc. | 1.78% |
| Western Digital Corp. | 1.75% |
| Super Micro Computer, Inc. | 1.70% |
| Zebra Technologies Corp., Class A | 1.67% |
| * Excluding money market fund holdings, if any. |
Sector allocation
(% of net assets)
(% of net assets)
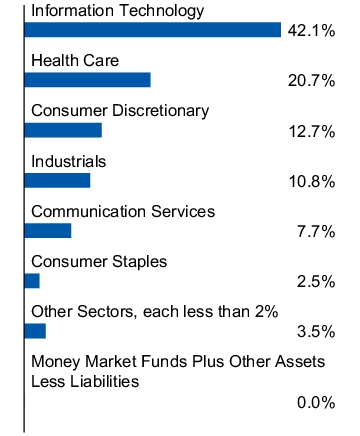
Top ten holdings*
(% of net assets)
(% of net assets)
| Tractor Supply Co. | 2.63% |
| eBay, Inc. | 2.61% |
| Monolithic Power Systems, Inc. | 2.14% |
| Seagate Technology Holdings PLC | 2.09% |
| Check Point Software Technologies Ltd. | 1.83% |
| Trimble, Inc. | 1.83% |
| NetApp, Inc. | 1.78% |
| Western Digital Corp. | 1.75% |
| Super Micro Computer, Inc. | 1.70% |
| Zebra Technologies Corp., Class A | 1.67% |
| * Excluding money market fund holdings, if any. |
What Were The Fund Costs For The Last Six Months ?
(Based on a hypothetical $10,000 investment)
| Fund | Costs of a $10,000 investment | Costs paid as a percentage of a $10,000 investment* |
| Invesco ESG S&P 500 Equal Weight ETF | $10 | 0.20% |
| * |
Annualized. |
What Are Key Statistics About The Fund?
(as of February 28, 2025)
| Fund net assets | $23,196,228 |
| Total number of portfolio holdings | 185 |
| Portfolio turnover rate | 10% |
What Comprised The Fund's Holdings?
(as of February 28, 2025)
Top ten holdings*
(% of net assets)
(% of net assets)
| CVS Health Corp. | 0.72% |
| Gilead Sciences, Inc. | 0.70% |
| Globe Life, Inc. | 0.69% |
| Abbott Laboratories | 0.68% |
| Exelon Corp. | 0.68% |
| AbbVie, Inc. | 0.68% |
| Welltower, Inc. | 0.67% |
| Ralph Lauren Corp. | 0.67% |
| Intel Corp. | 0.66% |
| Starbucks Corp. | 0.66% |
| * Excluding money market fund holdings, if any. |
Sector allocation
(% of net assets)
(% of net assets)
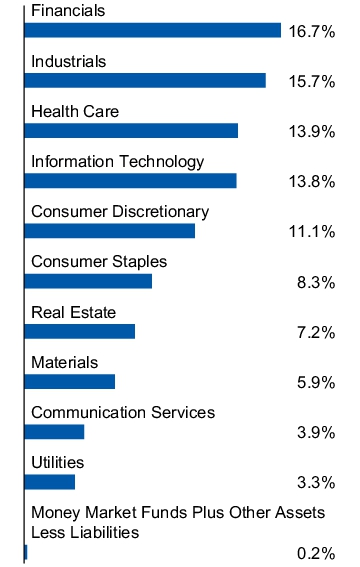
Top ten holdings*
(% of net assets)
(% of net assets)
| CVS Health Corp. | 0.72% |
| Gilead Sciences, Inc. | 0.70% |
| Globe Life, Inc. | 0.69% |
| Abbott Laboratories | 0.68% |
| Exelon Corp. | 0.68% |
| AbbVie, Inc. | 0.68% |
| Welltower, Inc. | 0.67% |
| Ralph Lauren Corp. | 0.67% |
| Intel Corp. | 0.66% |
| Starbucks Corp. | 0.66% |
| * Excluding money market fund holdings, if any. |
What Were The Fund Costs For The Last Six Months ?
(Based on a hypothetical $10,000 investment)
| Fund | Costs of a $10,000 investment | Costs paid as a percentage of a $10,000 investment* |
| Invesco NASDAQ Future Gen 200 ETF | $10 | 0.20% |
| * |
Annualized. |
What Are Key Statistics About The Fund?
(as of February 28, 2025)
| Fund net assets | $8,292,258 |
| Total number of portfolio holdings | 205 |
| Portfolio turnover rate | 37% |
What Comprised The Fund's Holdings?
(as of February 28, 2025)
Top ten holdings*
(% of net assets)
(% of net assets)
| uniQure N.V. | 1.22% |
| Microvast Holdings, Inc. | 1.19% |
| Heron Therapeutics, Inc. | 1.16% |
| Himax Technologies, Inc., ADR | 1.04% |
| MicroVision, Inc. | 0.90% |
| Axogen, Inc. | 0.80% |
| Pacira BioSciences, Inc. | 0.79% |
| Adaptive Biotechnologies Corp. | 0.77% |
| AngioDynamics, Inc. | 0.75% |
| CommScope Holding Co., Inc. | 0.75% |
| * Excluding money market fund holdings, if any. |
Sector allocation
(% of net assets)
(% of net assets)
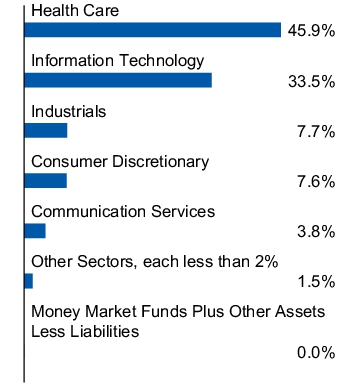
Top ten holdings*
(% of net assets)
(% of net assets)
| uniQure N.V. | 1.22% |
| Microvast Holdings, Inc. | 1.19% |
| Heron Therapeutics, Inc. | 1.16% |
| Himax Technologies, Inc., ADR | 1.04% |
| MicroVision, Inc. | 0.90% |
| Axogen, Inc. | 0.80% |
| Pacira BioSciences, Inc. | 0.79% |
| Adaptive Biotechnologies Corp. | 0.77% |
| AngioDynamics, Inc. | 0.75% |
| CommScope Holding Co., Inc. | 0.75% |
| * Excluding money market fund holdings, if any. |
What Were The Fund Costs For The Last Six Months ?
(Based on a hypothetical $10,000 investment)
| Fund | Costs of a $10,000 investment | Costs paid as a percentage of a $10,000 investment* |
| Invesco Nasdaq Free Cash Flow Achievers ETF | $20 | 0.39% |
| * |
Annualized. |
What Are Key Statistics About The Fund?
(as of February 28, 2025)
| Fund net assets | $16,031,641 |
| Total number of portfolio holdings | 52 |
| Portfolio turnover rate | 5% |
What Comprised The Fund's Holdings?
(as of February 28, 2025)
Top ten holdings*
(% of net assets)
(% of net assets)
| NVIDIA Corp. | 9.31% |
| Meta Platforms, Inc., Class A | 7.95% |
| Broadcom, Inc. | 6.83% |
| Mastercard, Inc., Class A | 5.00% |
| UnitedHealth Group, Inc. | 3.83% |
| Salesforce, Inc. | 3.48% |
| Thermo Fisher Scientific, Inc. | 3.23% |
| Intuit, Inc. | 2.93% |
| ServiceNow, Inc. | 2.93% |
| Adobe, Inc. | 2.87% |
| * Excluding money market fund holdings, if any. |
Sector allocation
(% of net assets)
(% of net assets)
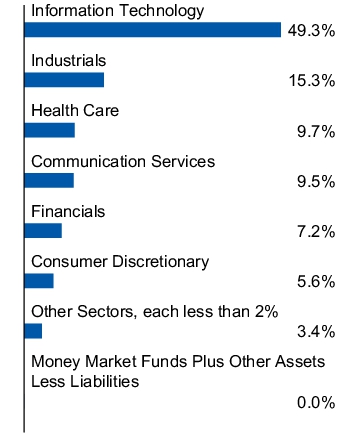
Top ten holdings*
(% of net assets)
(% of net assets)
| NVIDIA Corp. | 9.31% |
| Meta Platforms, Inc., Class A | 7.95% |
| Broadcom, Inc. | 6.83% |
| Mastercard, Inc., Class A | 5.00% |
| UnitedHealth Group, Inc. | 3.83% |
| Salesforce, Inc. | 3.48% |
| Thermo Fisher Scientific, Inc. | 3.23% |
| Intuit, Inc. | 2.93% |
| ServiceNow, Inc. | 2.93% |
| Adobe, Inc. | 2.87% |
| * Excluding money market fund holdings, if any. |
What Were The Fund Costs For The Last Six Months ?
(Based on a hypothetical $10,000 investment)
| Fund | Costs of a $10,000 investment | Costs paid as a percentage of a $10,000 investment* |
| Invesco S&P 500 High Dividend Growers ETF | $20 | 0.39% |
| * |
Annualized. |
What Are Key Statistics About The Fund?
(as of February 28, 2025)
| Fund net assets | $3,189,751 |
| Total number of portfolio holdings | 102 |
| Portfolio turnover rate | 17% |
What Comprised The Fund's Holdings?
(as of February 28, 2025)
Top ten holdings*
(% of net assets)
(% of net assets)
| Altria Group, Inc. | 2.83% |
| Franklin Resources, Inc. | 2.07% |
| Philip Morris International, Inc. | 1.81% |
| Bristol-Myers Squibb Co. | 1.73% |
| VICI Properties, Inc. | 1.70% |
| Pfizer, Inc. | 1.63% |
| Gilead Sciences, Inc. | 1.61% |
| Williams Cos., Inc. (The) | 1.59% |
| Evergy, Inc. | 1.59% |
| Entergy Corp. | 1.53% |
| * Excluding money market fund holdings, if any. |
Sector allocation
(% of net assets)
(% of net assets)
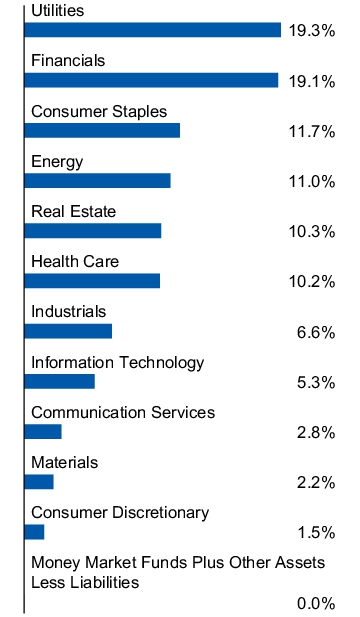
Top ten holdings*
(% of net assets)
(% of net assets)
| Altria Group, Inc. | 2.83% |
| Franklin Resources, Inc. | 2.07% |
| Philip Morris International, Inc. | 1.81% |
| Bristol-Myers Squibb Co. | 1.73% |
| VICI Properties, Inc. | 1.70% |
| Pfizer, Inc. | 1.63% |
| Gilead Sciences, Inc. | 1.61% |
| Williams Cos., Inc. (The) | 1.59% |
| Evergy, Inc. | 1.59% |
| Entergy Corp. | 1.53% |
| * Excluding money market fund holdings, if any. |
What Were The Fund Costs For The Last Six Months ?
(Based on a hypothetical $10,000 investment)
| Fund | Costs of a $10,000 investment | Costs paid as a percentage of a $10,000 investment* |
| Invesco S&P SmallCap 600® GARP ETF | $17 | 0.35% |
| * |
Annualized. |
What Are Key Statistics About The Fund?
(as of February 28, 2025)
| Fund net assets | $2,444,466 |
| Total number of portfolio holdings | 91 |
| Portfolio turnover rate | 35% |
What Comprised The Fund's Holdings?
(as of February 28, 2025)
Top ten holdings*
(% of net assets)
(% of net assets)
| Progyny, Inc. | 2.37% |
| Palomar Holdings, Inc. | 2.17% |
| REX American Resources Corp. | 1.83% |
| Catalyst Pharmaceuticals, Inc. | 1.81% |
| Liquidity Services, Inc. | 1.75% |
| Monarch Casino & Resort, Inc. | 1.74% |
| Urban Outfitters, Inc. | 1.70% |
| Interparfums, Inc. | 1.61% |
| Group 1 Automotive, Inc. | 1.54% |
| RPC, Inc. | 1.49% |
| * Excluding money market fund holdings, if any. |
Sector allocation
(% of net assets)
(% of net assets)
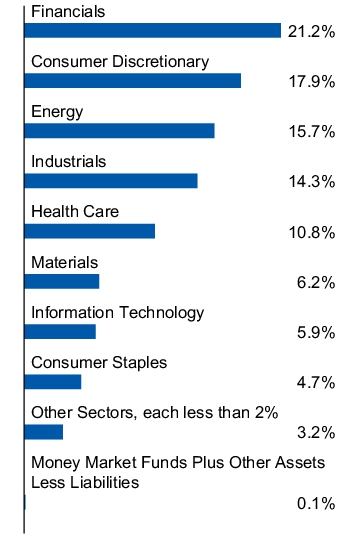
Top ten holdings*
(% of net assets)
(% of net assets)
| Progyny, Inc. | 2.37% |
| Palomar Holdings, Inc. | 2.17% |
| REX American Resources Corp. | 1.83% |
| Catalyst Pharmaceuticals, Inc. | 1.81% |
| Liquidity Services, Inc. | 1.75% |
| Monarch Casino & Resort, Inc. | 1.74% |
| Urban Outfitters, Inc. | 1.70% |
| Interparfums, Inc. | 1.61% |
| Group 1 Automotive, Inc. | 1.54% |
| RPC, Inc. | 1.49% |
| * Excluding money market fund holdings, if any. |
What Were The Fund Costs For The Last Six Months ?
(Based on a hypothetical $10,000 investment)
| Fund | Costs of a $10,000 investment▼ | Costs paid as a percentage of a $10,000 investment* |
| Invesco QQQ Low Volatility ETF | $6 | 0.27% |
|
▼
|
The Fund commenced operations during the reporting period. Expenses for a full reporting period would be higher.
|
| * |
Annualized.
|
What Are Key Statistics About The Fund?
(as of February 28, 2025)
| Fund net assets | $2,265,867 |
| Total number of portfolio holdings | 25 |
| Portfolio turnover rate | 10% |
What Comprised The Fund's Holdings?
(as of February 28, 2025)
Top ten holdings*
(% of net assets)
(% of net assets)
| T-Mobile US, Inc. | 5.13% |
| Automatic Data Processing, Inc. | 4.99% |
| Linde PLC | 4.80% |
| Coca-Cola Europacific Partners PLC | 4.78% |
| Cisco Systems, Inc. | 4.40% |
| Keurig Dr Pepper, Inc. | 4.28% |
| Mondelez International, Inc., Class A | 4.26% |
| Roper Technologies, Inc. | 4.26% |
| PepsiCo, Inc. | 4.18% |
| O'Reilly Automotive, Inc. | 4.12% |
| * Excluding money market fund holdings, if any. |
Sector allocation
(% of net assets)
(% of net assets)
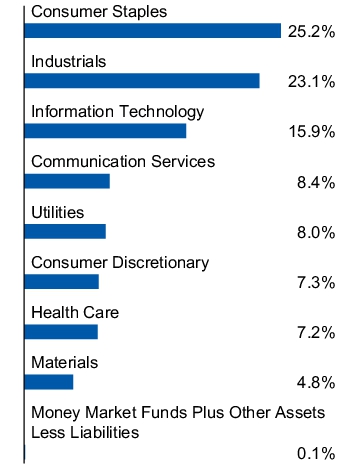
Top ten holdings*
(% of net assets)
(% of net assets)
| T-Mobile US, Inc. | 5.13% |
| Automatic Data Processing, Inc. | 4.99% |
| Linde PLC | 4.80% |
| Coca-Cola Europacific Partners PLC | 4.78% |
| Cisco Systems, Inc. | 4.40% |
| Keurig Dr Pepper, Inc. | 4.28% |
| Mondelez International, Inc., Class A | 4.26% |
| Roper Technologies, Inc. | 4.26% |
| PepsiCo, Inc. | 4.18% |
| O'Reilly Automotive, Inc. | 4.12% |
| * Excluding money market fund holdings, if any. |
What Were The Fund Costs For The Last Six Months ?
(Based on a hypothetical $10,000 investment)
| Fund | Costs of a $10,000 investment▼ | Costs paid as a percentage of a $10,000 investment* |
| Invesco MSCI North America Climate ETF | $2 | 0.10% |
|
▼
|
The Fund commenced operations during the reporting period. Expenses for a full reporting period would be higher.
|
| * |
Annualized.
|
What Are Key Statistics About The Fund?
(as of February 28, 2025)
| Fund net assets | $2,369,842,634 |
| Total number of portfolio holdings | 297 |
| Portfolio turnover rate | 0% |
What Comprised The Fund's Holdings?
(as of February 28, 2025)
Top ten holdings*
(% of net assets)
(% of net assets)
| Apple, Inc. | 6.71% |
| NVIDIA Corp. | 5.57% |
| Microsoft Corp. | 5.14% |
| Amazon.com, Inc. | 3.65% |
| Meta Platforms, Inc., Class A | 2.69% |
| Alphabet, Inc., Class A | 2.16% |
| Broadcom, Inc. | 1.63% |
| Tesla, Inc. | 1.55% |
| JPMorgan Chase & Co. | 1.41% |
| Eli Lilly and Co. | 1.38% |
| * Excluding money market fund holdings, if any. |
Sector allocation
(% of net assets)
(% of net assets)
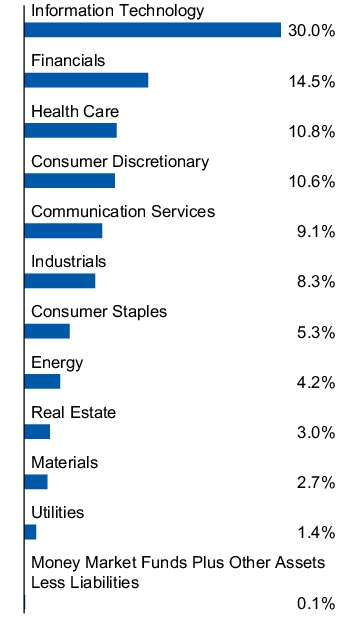
Top ten holdings*
(% of net assets)
(% of net assets)
| Apple, Inc. | 6.71% |
| NVIDIA Corp. | 5.57% |
| Microsoft Corp. | 5.14% |
| Amazon.com, Inc. | 3.65% |
| Meta Platforms, Inc., Class A | 2.69% |
| Alphabet, Inc., Class A | 2.16% |
| Broadcom, Inc. | 1.63% |
| Tesla, Inc. | 1.55% |
| JPMorgan Chase & Co. | 1.41% |
| Eli Lilly and Co. | 1.38% |
| * Excluding money market fund holdings, if any. |
| [1] | Annualized. |
| [2] | Annualized. |
| [3] | Annualized. |
| [4] | Annualized. |
| [5] | Annualized. |
| [6] | Annualized. |
| [7] | Annualized. |
| [8] | Annualized. |
| [9] | Annualized. |
| [10] | Reflects fee waivers and/or expense reimbursements, without which expenses would have been higher. |
| [11] | Annualized. |
| [12] | Annualized. |
| [13] | Annualized. |
| [14] | Annualized. |
| [15] | Annualized. |
| [16] | Annualized. |
| [17] | Annualized. |
| [18] | Annualized. |
| [19] | Annualized. |
| [20] | Annualized. |
| [21] | Annualized. |
| [22] | Annualized. |
| [23] | Annualized. |
| [24] | Annualized. |
| [25] | Annualized. |
| [26] | Annualized. |
| [27] | Annualized. |
| [28] | Reflects fee waivers and/or expense reimbursements, without which expenses would have been higher. |
| [29] | Annualized. |
| [30] | Annualized |
| [31] | Annualized. |
| [32] | Annualized. |
| [33] | Annualized. |
| [34] | Annualized. |
| [35] | Annualized. |
| [36] | Annualized. |
| [37] | Annualized. |
| [38] | Annualized. |
| [39] | Annualized. |
| [40] | Annualized. |
| [41] | Annualized. |
| [42] | Annualized. |
| [43] | Annualized. |
| [44] | Annualized. |
| [45] | Annualized. |
| [46] | Annualized. |
| [47] | Annualized. |
| [48] | Annualized. |
| [49] | Annualized. |
| [50] | Annualized. |
| [51] | Annualized. |
| [52] | Annualized. |
| [53] | Annualized. |
| [54] | Annualized. |
| [55] | Annualized. |
| [56] | Annualized. |
| [57] | Annualized. |
| [58] | Annualized. |
| [59] | Annualized. |
| [60] | Annualized. |
| [61] | Annualized. |
| [62] | Annualized. |
| [63] | The Fund commenced operations during the reporting period. Expenses for a full reporting period would be higher. |
| [64] | Annualized. |
| [65] | The Fund commenced operations during the reporting period. Expenses for a full reporting period would be higher. |
| [66] | Annualized. |