v3.25.1
Performance Management - AFL CIO HOUSING INVESTMENT TRUST
Apr. 30, 2025
Prospectus [Line Items]  
Bar Chart and Performance Table [Heading] HIT PAST PERFORMANCE
Performance Narrative [Text Block]

The bar chart below and the following table provide an indication of the risks of investing in the HIT by illustrating how returns can differ from one year to the next. The table also shows how the HIT’s average annual total returns for the one-, five-, and ten-year periods compare with those of the Bloomberg Aggregate. The HIT’s past performance is not necessarily an indication of how the HIT will perform in the future. Updated performance information is available on the HIT’s website at www.aflcio-hit.com.


Performance Past Does Not Indicate Future [Text] The HIT’s past performance is not necessarily an indication of how the HIT will perform in the future.
Performance Information Illustrates Variability of Returns [Text] The bar chart below and the following table provide an indication of the risks of investing in the HIT by illustrating how returns can differ from one year to the next.
Bar Chart [Heading] ANNUAL TOTAL RETURNS  (Calendar Years—Net of Operating Expenses)
Bar Chart [Table]
   
2015
2016
2017
2018
2019
2020
2021
2022
2023
2024


Bar Chart Closing [Text Block]

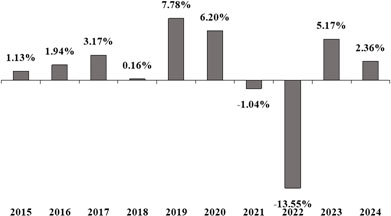
During the ten-year period identified in the bar chart above, the highest return for a quarter was 6.82% (quarter ended December 31, 2023) and the lowest return for a quarter was -5.94% (quarter ended March 31, 2022).


Highest Quarterly Return, Label [Optional Text] highest return for a quarter
Highest Quarterly Return 6.82%
Highest Quarterly Return, Date Dec. 31, 2023
Lowest Quarterly Return, Label [Optional Text] lowest return for a quarter
Lowest Quarterly Return (5.94%)
Lowest Quarterly Return, Date Mar. 31, 2022
Performance Table Heading AVERAGE ANNUAL TOTAL RETURNS (for the periods ended December 31, 2024) 
Performance [Table]

AVERAGE ANNUAL TOTAL RETURNS

(for the periods ended December 31, 2024) 

 
  ONE YEAR FIVE YEARS TEN YEARS

AFL-CIO Housing

Investment Trust 

2.36% -0.44% 1.17%
Bloomberg U.S. Aggregate Bond Index (reflects no deductions for fees or expenses) 1.25% -0.33% 1.35%


Index No Deduction for Fees, Expenses, or Taxes [Text] (reflects no deductions for fees or expenses)
Performance Availability Website Address [Text] www.aflcio-hit.com