The bar chart and Average Annual Total Returns table below provide an indication of the risks of investing in the Fund by showing changes in the Fund's performance from year to year and by showing how the Fund's average annual returns for the 1, 5 and 10 calendar year periods compare with those of the MSCI All Country World Index, a broad-based securities market index. The Fund also compares its performance to the Standard & Poor's 500 Stock Index ("S&P 500"), a customized index comprised of 60% S&P 500 and 40% Bloomberg U.S. Aggregate Bond Index, and the Consumer Price Index ("CPI"). The S&P 500 and 60%/40% S&P 500/Bloomberg U.S. Aggregate Bond indexes are included as broad-based comparisons to the capitalization characteristics of the Fund's portfolio. The CPI is included as a comparison of the Fund's results to inflation. The past performance information shown below is for Institutional Class shares of the Fund. Although Institutional Class shares would have similar annual returns to Investor Class shares because the classes are invested in the same portfolio of securities, the returns for Investor Class shares will vary from Institutional Class shares because of the higher expenses paid by Investor Class shares. The chart and table reflect the reinvestment of dividends and distributions. The Fund's past performance (before and after taxes) is not necessarily an indication of how the Fund will perform in the future.
The MSCI All Country World Index is a float-adjusted market capitalization index that is designed to measure the combined equity market performance of developed and emerging market countries. The S&P 500 is a capitalization-weighted index which is considered a measure of large capitalization U.S. equity performance, covering approximately 80% of available market capitalization. The 60%/40% S&P 500 Index/Bloomberg U.S. Aggregate Bond Index is a composite blend of 60% of the S&P 500 Index and 40% of the Bloomberg U.S. Aggregate Bond Index. The Consumer Price Index ("CPI") is an unmanaged index representing the rate of inflation of U.S. consumer prices as determined by the U.S. Bureau of Labor Statistics.
To obtain updated monthly performance information, please visit the Fund's website at https://fpa.com/funds or call (800) 982-4372.
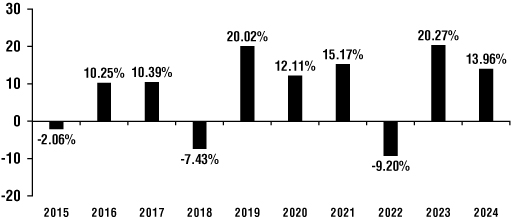
The Fund's highest/lowest quarterly results during this time period were:
Institutional Class
Highest 18.15% (Quarter ended 12/31/2020)
Lowest (20.51)% (Quarter ended 3/31/2020)
|
Average Annual Total Returns (for the periods ended December 31, 2024) |
One Year |
Five Years |
Ten Years |
||||||||||||
|
Institutional Class Shares—Before Taxes |
13.96 |
% |
9.95 |
% |
7.85 |
% |
|||||||||
|
Institutional Class Shares—After Taxes on Distributions1 |
11.53 |
% |
8.39 |
% |
6.38 |
% |
|||||||||
|
Institutional Class Shares—After Taxes on Distributions and Sale of Fund Shares1 |
9.87 |
% |
7.65 |
% |
6.00 |
% |
|||||||||
|
Investor Class Shares—Before Taxes2 |
13.85 |
% |
9.84 |
% |
7.74 |
% |
|||||||||
|
MSCI All Country World Index (reflects no deductions for fees, expenses, or taxes) |
17.49 |
% |
10.06 |
% |
9.23 |
% |
|||||||||
|
S&P 500 (reflects no deductions for fees, expenses, or taxes) |
25.02 |
% |
14.53 |
% |
13.10 |
% |
|||||||||
|
60%/40% S&P 500 Index/Bloomberg U.S. Aggregate Bond Index (reflects no deductions for fees, expenses, or taxes) |
15.04 |
% |
8.67 |
% |
8.52 |
% |
|||||||||
|
Consumer Price Index (reflects no deductions for fees, expenses, or taxes) |
2.90 |
% |
4.20 |
% |
3.01 |
% |
|||||||||
1 After-tax returns are calculated using the historical highest individual federal marginal income tax rates and do not reflect the impact of state and local taxes. Actual after-tax returns depend upon an investor's tax situation and may differ from those shown. After-tax returns presented here are not relevant to investors who hold their Fund shares through tax-deferred arrangements, such as 401(k) plans or individual retirement accounts ("IRAs"). Early withdrawal from a 401(k) account or an IRA could lead to taxation of the withdrawn amount as ordinary income and could be subject to an additional penalty. The after-tax returns on distributions and sale of Fund shares may be higher than returns before taxes due to the effect of a tax benefit an investor may receive from the realization of capital losses that would have been incurred on the sale of Fund shares.
2 Investor Class shares commenced operations on April 30, 2024. The performance figures for Investor Class shares include the performance for the Institutional shares for the periods prior to the inception date of Investor Class shares, adjusted for the difference in Institutional Class shares and Investor Class shares expenses. Investor Class shares impose higher expenses than Institutional Class shares. Since Investor Class shares have higher expenses and are therefore more expensive than Institutional Class shares, the returns for Investor Class shares will be lower than the returns shown for Institutional Class shares.
The bar chart and Average Annual Total Returns table below provide an indication of the risks of investing in the Fund by showing changes in the Fund's performance. Because the Supra Institutional Class of the Fund commenced operations on September 4, 2020, the chart and the table only show the Supra Institutional Class's return for the period from September 4, 2020 to December 31, 2020 and for the calendar years 2021, 2022 and 2023 compared to those of the MSCI All Country World Index, a broad-based securities market index. The Fund also compares its performance to the Standard & Poor's 500 Stock Index ("S&P 500"), a customized index comprised of 60% S&P 500 and 40% Bloomberg U.S. Aggregate Bond Index, and the Consumer Price Index ("CPI"). The S&P 500 and 60%/40% S&P 500/Bloomberg U.S. Aggregate Bond indexes are included as broad-based comparisons to the capitalization characteristics of the Fund's portfolio. The CPI is included as a comparison of the Fund's results to inflation. The chart and table reflect the reinvestment of dividends and distributions. In addition, the Fund's past performance (before and after taxes) is not necessarily an indication of how the Fund will perform in the future.
The MSCI All Country World Index is a float-adjusted market capitalization index that is designed to measure the combined equity market performance of developed and emerging market countries. The S&P 500 is a capitalization-weighted index which is considered a measure of large capitalization U.S. equity performance, covering approximately 80% of available market capitalization. The 60%/40% S&P 500 Index/Bloomberg U.S. Aggregate Bond Index is a composite blend of 60% of the S&P 500 Index and 40% of the Bloomberg U.S. Aggregate Bond Index. The Consumer Price Index ("CPI") is an unmanaged index representing the rate of inflation of U.S. consumer prices as determined by the U.S. Bureau of Labor Statistics.
To obtain updated monthly performance information, please visit the Fund's website at https://fpa.com/funds or call (800) 982-4372.
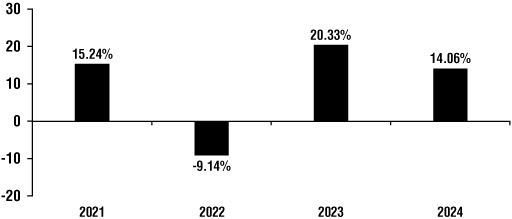
The Fund's highest/lowest quarterly results during this time period were:
Highest 9.79% (Quarter ended 3/31/2021)
Lowest (9.29)% (Quarter ended 6/30/2022)
|
Average Annual Total Returns—Supra Institutional Class (for the periods ended December 31, 2024) |
One |
Since |
|||||||||
|
Before Taxes |
14.06 |
% |
12.34 |
% |
|||||||
|
After Taxes on Distributions1 |
11.62 |
% |
10.68 |
% |
|||||||
|
After Taxes on Distributions and Sale of Fund Shares1 |
9.93 |
% |
9.57 |
% |
|||||||
|
MSCI All Country World Index (reflects no deductions for fees, |
17.49 |
% |
11.05 |
% |
|||||||
|
S&P 500 (reflects no deductions for fees, expenses, or taxes) |
25.02 |
% |
15.05 |
% |
|||||||
|
60%/40% S&P 500 Index/Bloomberg U.S. Aggregate |
15.04 |
% |
8.19 |
% |
|||||||
|
Consumer Price Index (reflects no deductions for fees, |
2.90 |
% |
4.79 |
% |
|||||||
1 After-tax returns are calculated using the historical highest individual federal marginal income tax rates and do not reflect the impact of state and local taxes. Actual after-tax returns depend upon an investor's tax situation and may differ from those shown. After-tax returns presented here are not relevant to investors who hold their Fund shares through tax-deferred arrangements, such as 401(k) plans or individual retirement accounts ("IRAs"). Early withdrawal from a 401(k) account or an IRA could lead to taxation of the withdrawn amount as ordinary income and could be subject to an additional penalty. The after-tax returns on distributions and sale of Fund shares may be higher than returns before taxes due to the effect of a tax benefit an investor may receive from the realization of capital losses that would have been incurred on the sale of Fund shares.
The bar chart and Average Annual Total Returns table below provide an indication of the risks of investing in the Fund by showing changes in the Fund's performance from year to year for Institutional Class shares and by showing how the average annual total returns of each class of the Fund compare with the average annual total returns of the Bloomberg U.S. Universal Bond Index, a broad-based securities market index. The Fund also compares its performance to the CPI + 200 Basis Points index, a measure of the change in cost of living plus 200 basis points. Certain past
performance information shown below is for Institutional Class shares of the Fund. Although Institutional Class shares would have similar annual returns to Advisor Class shares because the classes are invested in the same portfolio of securities, the returns for Advisor Class shares will vary from Institutional Class shares because of the higher expenses paid by Advisor Class shares. The chart and table reflect the reinvestment of dividends and distributions. In addition, the Fund's past performance (before and after taxes) is not necessarily an indication of how the Fund will perform in the future.
The Bloomberg U.S. Universal Bond Index represents the union of the following Bloomberg indices: the U.S. Aggregate Index, the U.S. Corporate High Yield Index, the Investment Grade 144A Index, the Eurodollar Index, the U.S. Emerging Markets Index, and the non-ERISA eligible portion of the CMBS Index. Tax-exempt municipal securities, private placements, and non-dollar-denominated issues are excluded from the Bloomberg U.S. Universal Bond Index. The only constituent of the index that includes floating-rate debt is the U.S. Emerging Markets Index. The CPI + 200 Basis Points index is created by adding 2% to the annual percentage change in the Consumer Price Index ("CPI"). This index reflects non-seasonally adjusted returns. The CPI is an unmanaged index representing the rate of inflation of U.S. consumer prices as determined by the U.S. Department of Labor Statistics.
To obtain updated monthly performance information, please visit the Fund's website at https://fpa.com/funds or call (800) 982-4372.
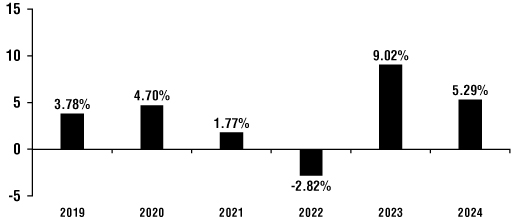
The Fund's highest/lowest quarterly results during this time period were:
Institutional Class
Highest Calendar Quarter Return at NAV 4.11% Quarter ended 12/31/2023
Lowest Calendar Quarter Return at NAV (1.46)% Quarter ended 3/31/2022
|
Average Annual Total Returns (for the periods ended December 31, 2024) |
One Year |
Five Years |
Since Inception |
Inception Date |
|||||||||||||||
|
Institutional Class—Before Taxes |
5.29% | 3.52% | 3.56% |
12/31/2018 |
|||||||||||||||
|
Institutional Class—After Taxes on Distributions1 |
4.10% | 2.21% | 2.30% |
12/31/2018 |
|||||||||||||||
|
Institutional Class—After Taxes on Distributions and Sale of Fund Shares1 |
3.94% | 2.22% | 2.27% |
12/31/2018 |
|||||||||||||||
|
Advisor Class—Before Taxes |
5.16% |
N/A |
3.17% |
04/19/2021 |
|||||||||||||||
|
Bloomberg U.S. Universal Bond Index |
2.04% | 0.06% | 1.54% |
12/31/2018 |
|||||||||||||||
|
CPI + 200 Basis Points |
4.98% | 6.30% | 5.98% |
12/31/2018 |
|||||||||||||||
1 After-tax returns are calculated using the historical highest individual federal marginal income tax rates and do not reflect the impact of state and local taxes. Actual after-tax returns depend upon an investor's tax situation and may differ from those shown. After-tax returns presented here are not relevant to investors who hold their Fund shares through tax-deferred arrangements, such as 401(k) plans or individual retirement accounts ("IRAs"). Early withdrawal from a 401(k) account or an IRA could lead to taxation of the withdrawn amount as ordinary income and could be subject to an additional tax penalty. The after-tax returns on distributions and sale of Fund shares may be higher than returns before taxes due to the effect of a tax benefit an investor may receive from the realization of capital losses that would have been incurred on the sale of Fund shares. After-tax returns are shown for Institutional Class Shares only and after-tax returns for classes other than Institutional Class will vary from returns shown for Institutional Class.