The Fund seeks to generate equity-like returns over the long-term, take less risk than the market and avoid permanent impairment of capital.
This table describes the fees and expenses that you may pay if you buy, hold, and sell shares of the Fund's Institutional and Investor Classes. You may pay other fees, such as brokerage commissions and other fees to financial intermediaries, which are not reflected in the table and example below.
|
Shareholder Fees (fees paid directly from your investment) |
Institutional Class |
Investor Class |
|||||||||||||||||
|
Maximum Sales Charge (Load) Imposed on Purchases (as a percentage of offering price) |
None |
None |
|||||||||||||||||
|
Maximum Deferred Sales Charge (Load) (as a percentage of original sales price or redemption proceeds, as applicable) |
None |
None |
|||||||||||||||||
|
Exchange Fee |
None |
None |
|||||||||||||||||
|
Annual Operating Expenses of the Fund's Institutional and Investor Class of Shares (expenses that you pay each year as a percentage of the value of your investment in this class) |
|||||||||||||||||||
|
Management Fees1 |
1.00 |
% |
1.00 |
% |
|||||||||||||||
|
Distribution (Rule 12b-1) fees |
None |
None |
|||||||||||||||||
|
Other Expenses |
0.06 |
% |
0.27 |
% |
|||||||||||||||
|
Shareholder Service Fee |
0.04 |
% |
0.25 |
% |
|||||||||||||||
|
Other Expenses before Short Sale Dividend and Interest Expenses |
0.02 |
% |
0.02 |
% |
|||||||||||||||
|
Total Annual Fund Operating Expenses before Short Sale Dividend and Interest Expenses |
1.06 |
% |
1.27 |
% |
|||||||||||||||
|
Short Sale Dividend and Interest Expense |
0.01 |
% |
0.01 |
% |
|||||||||||||||
|
Expense Reimbursement2 |
(0.01 |
)% |
(0.12 |
)% |
|||||||||||||||
|
Total Annual Operating Expenses after Short Sale Dividend and Interest Expenses and Expense Reimbursement |
1.06 |
%3 |
1.16 |
%3 |
|||||||||||||||
1 The Management fees include both the advisory fee of 0.93% and class-specific administrative service fee of 0.07%. For additional information about the administrative service fee please see the section titled "Management of the Fund."
2 First Pacific Advisors, LP (the "Adviser" or "FPA"), the Fund's investment adviser, has contractually agreed to reimburse the Fund for operating expenses in excess of 0.05% of the average net assets of the Institutional Class shares of the Fund, and in excess of 0.15% of the average net assets of the Investor Class shares of the Fund, excluding management fees, administrative service fees, short sale dividend expenses and interest expenses on cash deposits relating to short sales, brokerage fees and commissions, redemption liquidity service expenses, interest, taxes, fees and expenses of other funds in which the Fund invests, and extraordinary expenses, including litigation expenses not incurred in the Fund's ordinary course of business, through April 30, 2026. The Adviser has also contractually agreed to reimburse the Fund for redemption liquidity service expenses in excess of 0.0044% of the average net assets of the Institutional Class and Investor Class shares of the Fund through April 30, 2026. These agreements may only be terminated earlier by the Fund's Board of Trustees (the "Board") or upon termination of the investment advisory agreement.
3 Total Annual Operating Expenses after Expense Reimbursement is 1.05% and 1.15% for the Institutional Class and Investor Class, respectively, excluding Short Sale Dividend and Interest Expense.
This Example is intended to help you compare the cost of investing in the Institutional Class and Investor Class of the Fund with the cost of investing in other mutual funds. The Example assumes you invest $10,000 in the Institutional Class and Investor Class for the time periods indicated and then redeem all of your shares at the end of those periods. The Example also assumes that your investment has a 5% return each year and that the Fund's operating expenses remain the same. The one-year figure is based on total annual Fund operating expenses after expense reimbursement. Although your actual costs may be higher or lower, based on these assumptions your costs would be:
|
One Year |
Three Years |
Five Years |
Ten Years |
||||||||||||||||
|
Institutional Class |
$ |
108 |
$ |
339 |
$ |
589 |
$ |
1,305 |
|||||||||||
|
Investor Class |
$ |
118 |
$ |
394 |
$ |
691 |
$ |
1,535 |
|||||||||||
The Fund pays transaction costs, such as commissions, when it buys and sells securities (or "turns over" its portfolio). A higher portfolio turnover rate may indicate higher transaction costs and may result in higher taxes when shares are held in a taxable account. These costs, which are not reflected in annual fund operating expenses or in the example, affect the Fund's performance. During the most recent fiscal year, the Fund's portfolio turnover rate was 10% of the average value of its portfolio. The Fund's portfolio turnover rate may vary from year to year as well as within a year.
To pursue the Fund's investment objective, the Fund's portfolio managers invest in both equity and debt securities of companies. The Fund's portfolio managers believe that this combination of securities broadens the universe of opportunities for the Fund, offers additional diversification and helps to lower volatility. The portfolio managers invest primarily in equity securities and the balance of the Fund's portfolio in debt securities, cash, and cash equivalents. The Fund has no limit on the amount of assets it may invest in non-U.S. securities. The decision to invest in a non-U.S. security will be based on the portfolio managers' fundamental security analysis. In addition, the Fund may sell securities short, and the portfolio managers may employ a short selling strategy for a portion of the Fund.
Equity securities represent an ownership interest, or the right to acquire an ownership interest, in an issuer. Different types of equity securities provide different voting and dividend rights and priority in case of the bankruptcy of the issuer. The Fund may invest in a variety of equity securities, including common stocks, preferred stocks, convertible securities, rights, and warrants.
The portfolio managers look for large and small companies that they believe to have excellent future prospects that are undervalued by the securities markets. The portfolio managers believe that these opportunities often arise when companies are out-of-favor or undiscovered by most of Wall Street. The portfolio managers also search for companies that offer earnings growth, opportunity for price/earnings multiple expansion and the best combination of such quality criteria as strong market share, good management, high barriers to entry and high return on capital.
Using fundamental security analysis, the portfolio managers may look for investments that trade at a substantial discount to the portfolio managers' determination of the company's value (absolute value) rather than those that might appear inexpensive based on a discount to their peer groups or the market average (relative value). The portfolio managers attempt to determine a company's absolute value using fundamental security analysis, which they believe generally provides them with a thorough view of a company's financial and business characteristics. As a part of their process, the portfolio managers may:
• Review stock prices or industry group under-performance, insider purchases, management changes and corporate spin-offs.
• Communicate directly with company management, suppliers, and customers.
• Use their judgment to define the company's future potential, financial strength, and competitive position.
The portfolio managers generally seek to sell an equity investment when they believe that the company's value has been fully reflected in a higher valuation by the market or when a negative fundamental development occurs in the company or its industry that the portfolio managers believe could significantly impact future earnings growth.
A debt security is an interest-bearing security that companies or governments use to borrow money from investors. The issuer of a debt security promises to pay interest at a stated rate, which may be variable or fixed, and to repay the amount borrowed at maturity (the date when the debt security is due and payable). The Fund may invest in debt securities issued by companies, the U.S. government, and its agencies; mortgage-backed and asset-backed securities (i.e. securities that are backed by pools of loans or mortgages assembled for sale to investors); municipal notes and bonds; and commercial paper and certificates of deposit.
The portfolio managers invest in debt securities seeking to provide the Fund with a reliable and recurring stream of income, while seeking to preserve its capital. The Fund may also invest in debt securities rated below investment grade ("high yield bonds" or "junk bonds"). The Fund has the ability to invest up to 65% of its total assets in debt securities, although it will generally invest a greater percentage of its portfolio in equity securities than debt securities.
The portfolio managers select debt securities by using an approach that is similar to the approach they use to select equity securities and by trying to forecast current interest rate trends. The portfolio managers generally employ a defensive interest rate strategy, which means they seek to keep the average maturity of the debt-securities portion of the Fund to 10 years or less, by investing at different points along the yield curve. The portfolio managers also continually consider yield spreads and other underlying factors such as credit quality, investor perception and liquidity to determine which sectors offer the best investment value at any given time.
The portfolio managers may engage in a strategy known as selling short. Selling a security short is when the Fund sells a security it does not own. To sell a security short, the Fund must borrow the security from someone else to deliver to the buyer. The Fund then replaces the security it borrowed
by purchasing it at the market price at or before the time of replacement. Until it replaces the security, the Fund repays the person that lent it the security for any interest or dividends that may have accrued during the period of the loan. The Fund typically sells securities short to take advantage of an anticipated decline in prices or to protect a profit in a security it already owns.
The bar chart and Average Annual Total Returns table below provide an indication of the risks of investing in the Fund by showing changes in the Fund's performance from year to year and by showing how the Fund's average annual returns for the 1, 5 and 10 calendar year periods compare with those of the MSCI All Country World Index, a broad-based securities market index. The Fund also compares its performance to the Standard & Poor's 500 Stock Index ("S&P 500"), a customized index comprised of 60% S&P 500 and 40% Bloomberg U.S. Aggregate Bond Index, and the Consumer Price Index ("CPI"). The S&P 500 and 60%/40% S&P 500/Bloomberg U.S. Aggregate Bond indexes are included as broad-based comparisons to the capitalization characteristics of the Fund's portfolio. The CPI is included as a comparison of the Fund's results to inflation. The past performance information shown below is for Institutional Class shares of the Fund. Although Institutional Class shares would have similar annual returns to Investor Class shares because the classes are invested in the same portfolio of securities, the returns for Investor Class shares will vary from Institutional Class shares because of the higher expenses paid by Investor Class shares. The chart and table reflect the reinvestment of dividends and distributions. The Fund's past performance (before and after taxes) is not necessarily an indication of how the Fund will perform in the future.
The MSCI All Country World Index is a float-adjusted market capitalization index that is designed to measure the combined equity market performance of developed and emerging market countries. The S&P 500 is a capitalization-weighted index which is considered a measure of large capitalization U.S. equity performance, covering approximately 80% of available market capitalization. The 60%/40% S&P 500 Index/Bloomberg U.S. Aggregate Bond Index is a composite blend of 60% of the S&P 500 Index and 40% of the Bloomberg U.S. Aggregate Bond Index. The Consumer Price Index ("CPI") is an unmanaged index representing the rate of inflation of U.S. consumer prices as determined by the U.S. Bureau of Labor Statistics.
To obtain updated monthly performance information, please visit the Fund's website at https://fpa.com/funds or call (800) 982-4372.
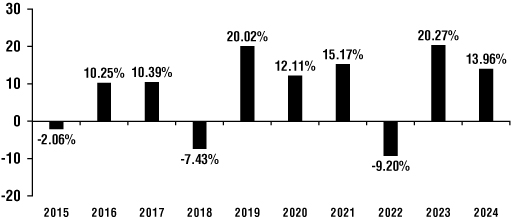
The Fund's highest/lowest quarterly results during this time period were:
Institutional Class
Highest 18.15% (Quarter ended 12/31/2020)
Lowest (20.51)% (Quarter ended 3/31/2020)
|
Average Annual Total Returns (for the periods ended December 31, 2024) |
One Year |
Five Years |
Ten Years |
||||||||||||
|
Institutional Class Shares—Before Taxes |
13.96 |
% |
9.95 |
% |
7.85 |
% |
|||||||||
|
Institutional Class Shares—After Taxes on Distributions1 |
11.53 |
% |
8.39 |
% |
6.38 |
% |
|||||||||
|
Institutional Class Shares—After Taxes on Distributions and Sale of Fund Shares1 |
9.87 |
% |
7.65 |
% |
6.00 |
% |
|||||||||
|
Investor Class Shares—Before Taxes2 |
13.85 |
% |
9.84 |
% |
7.74 |
% |
|||||||||
|
MSCI All Country World Index (reflects no deductions for fees, expenses, or taxes) |
17.49 |
% |
10.06 |
% |
9.23 |
% |
|||||||||
|
S&P 500 (reflects no deductions for fees, expenses, or taxes) |
25.02 |
% |
14.53 |
% |
13.10 |
% |
|||||||||
|
60%/40% S&P 500 Index/Bloomberg U.S. Aggregate Bond Index (reflects no deductions for fees, expenses, or taxes) |
15.04 |
% |
8.67 |
% |
8.52 |
% |
|||||||||
|
Consumer Price Index (reflects no deductions for fees, expenses, or taxes) |
2.90 |
% |
4.20 |
% |
3.01 |
% |
|||||||||
1 After-tax returns are calculated using the historical highest individual federal marginal income tax rates and do not reflect the impact of state and local taxes. Actual after-tax returns depend upon an investor's tax situation and may differ from those shown. After-tax returns presented here are not relevant to investors who hold their Fund shares through tax-deferred arrangements, such as 401(k) plans or individual retirement accounts ("IRAs"). Early withdrawal from a 401(k) account or an IRA could lead to taxation of the withdrawn amount as ordinary income and could be subject to an additional penalty. The after-tax returns on distributions and sale of Fund shares may be higher than returns before taxes due to the effect of a tax benefit an investor may receive from the realization of capital losses that would have been incurred on the sale of Fund shares.
2 Investor Class shares commenced operations on April 30, 2024. The performance figures for Investor Class shares include the performance for the Institutional shares for the periods prior to the inception date of Investor Class shares, adjusted for the difference in Institutional Class shares and Investor Class shares expenses. Investor Class shares impose higher expenses than Institutional Class shares. Since Investor Class shares have higher expenses and are therefore more expensive than Institutional Class shares, the returns for Investor Class shares will be lower than the returns shown for Institutional Class shares.