Pay vs Performance Disclosure - USD ($)
|
12 Months Ended |
Dec. 31, 2024 |
Dec. 31, 2023 |
Dec. 31, 2022 |
| Pay vs Performance Disclosure |
|
|
|
| Pay vs Performance Disclosure, Table |
| | | | | | | | | | | | | | | | | | | | | | Year | Summary Compensation Table Total for PEO ($)(1) | Compensation Actually Paid to PEO ($)(2) | Average Summary Compensation Table Total for Non-PEO NEOs ($)(3) | Average Compensation Actually Paid to Non-PEO NEOs ($)(2),(3) | Value of Initial Fixed $100 Investment Based on Total Shareholder Return ($),(4) | Net Loss ($) | | | 2024 | 2,364,766 | | 2,781,839 | | 1,010,700 | | 1,150,583 | | 14.75 | | (79,397,000) | | | 2023 | 1,875,055 | | 1,965,832 | | 651,866 | | 575,483 | | 10.10 | | (180,417,941) | | | 2022 | 3,717,913 | | (16,575,910) | | 1,793,824 | | (2,398,126) | | 27.78 | | (277,704,361) | |
|
|
|
| Named Executive Officers, Footnote |
Mr. Kohn was the PEO for all years shown.The Non-PEO NEOs were comprised of: for 2024, Messrs. Crossman and Riley, for 2023, Messrs. Crossman, Riley, Lance Barton and Florus Beuting and Ms. Ashley Kechter; for 2022, Messrs. Barton, Riley and Beuting and Ms. Kechter.
|
|
|
| PEO Total Compensation Amount |
$ 2,364,766
|
$ 1,875,055
|
$ 3,717,913
|
| PEO Actually Paid Compensation Amount |
$ 2,781,839
|
1,965,832
|
(16,575,910)
|
| Adjustment To PEO Compensation, Footnote |
SEC rules require that certain adjustments be made to the totals set forth in the Summary Compensation Table included in this Proxy Statement (the “Summary Compensation Table”) in order to determine “compensation actually paid” for purposes of this Pay Versus Performance Disclosure. “Compensation actually paid” does not represent cash and/or equity value transferred to the applicable NEO, but rather is a value calculated under applicable SEC rules for purposes of this Pay Versus Performance Disclosure. In general, “compensation actually paid” is calculated as total compensation set forth in the Summary Compensation Table, as adjusted to include the fair market value of equity awards as of December 31 of the applicable year or, if earlier, the vesting date (rather than the grant date). None of the NEOs participate in a defined benefit plan, so the following table does not include an adjustment for pension benefits. The below table reflects the required adjustments to reconcile total compensation as set forth in the Summary Compensation Table to “Compensation actually paid” for purposes of the Pay Versus Performance Disclosure. Compensation Actually Paid reflects the exclusions and inclusions of certain amounts for the PEO and the Non-PEO NEOs as set forth below. Equity values are calculated in accordance with FASB ASC Topic 718. Neither the PEO nor the Non-PEO NEOs are accruing benefits under a pension plan for services rendered in the covered years, and therefore no additions are required for pension plan service cost in determining Compensation Actually Paid. The following table reconciles Summary Compensation Table total to Compensation Actually Paid with respect to our PEO for the periods indicated: | | | | | | | | | | | | | | | | | | | | | | | | | | | | Year | Salary ($) | Bonus and Non-Equity Incentive Compensation ($) | Equity Compensation ($) | All Other Compensation ($) | Summary Compensation Table Total ($) | Equity Deductions from Summary Compensation Table Total ($) (1) | Additions (Deductions) to Compensation Table Total ($) (2) | Compensation Actually Paid ($) | | 2024 | 852,838 | | 850,000 | | 652,174 | | 9,754 | | 2,364,766 | | (652,174) | | 1,069,247 | | 2,781,839 | | | 2023 | 852,238 | | — | | 1,013,063 | | 9,754 | | 1,875,055 | | (1,013,063) | | 1,103,840 | | 1,965,832 | | | 2022 | 851,710 | | — | | 1,785,649 | | 1,080,554 | | 3,717,913 | | (1,785,649) | | (18,508,174) | | (16,575,910) | |
______________ (1) Represents the grant date fair value of equity-based awards granted. (2) Reflects the value of equity calculated in accordance with the SEC methodology for determining Compensation Actually Paid for each period presented. The equity component of compensation actually paid is further detailed in the supplemental table below. The following table includes supplemental data for the additions and deductions resulting in the equity component of PEO Compensation Actually Paid for the periods indicated: | | | | | | | | | | | | | | | | | | | | | | Fiscal Year | Addition of Fair Value of Current Year Equity Awards Unvested and Outstanding at Fiscal Year End ($) | (Deductions) Additions for Change in Value of Prior Years’ Awards Unvested and Outstanding at Fiscal Year End ($) | Additions (Deductions) for Change in Value of Prior Years’ Awards That Vested in Fiscal Year ($) | Additions of Fair Value as of the Vesting Date for Awards that are Granted and Vested in the Fiscal Year ($) | (Deductions) for Forfeited Prior Years’ Awards | Equity Value Included in Compensation Actually Paid ($) | | 2024 | 783,392 | | 457,521 | | (171,666) | | — | | — | | 1,069,247 | | | 2023 | 1,657,748 | | (291,172) | | (262,736) | | — | | — | | 1,103,840 | | | 2022 | 499,546 | | (12,135,455) | | (6,872,265) | | — | | — | | (18,508,174) | |
|
|
|
| Non-PEO NEO Average Total Compensation Amount |
$ 1,010,700
|
651,866
|
1,793,824
|
| Non-PEO NEO Average Compensation Actually Paid Amount |
$ 1,150,583
|
575,483
|
(2,398,126)
|
| Adjustment to Non-PEO NEO Compensation Footnote |
SEC rules require that certain adjustments be made to the totals set forth in the Summary Compensation Table included in this Proxy Statement (the “Summary Compensation Table”) in order to determine “compensation actually paid” for purposes of this Pay Versus Performance Disclosure. “Compensation actually paid” does not represent cash and/or equity value transferred to the applicable NEO, but rather is a value calculated under applicable SEC rules for purposes of this Pay Versus Performance Disclosure. In general, “compensation actually paid” is calculated as total compensation set forth in the Summary Compensation Table, as adjusted to include the fair market value of equity awards as of December 31 of the applicable year or, if earlier, the vesting date (rather than the grant date). None of the NEOs participate in a defined benefit plan, so the following table does not include an adjustment for pension benefits. The below table reflects the required adjustments to reconcile total compensation as set forth in the Summary Compensation Table to “Compensation actually paid” for purposes of the Pay Versus Performance Disclosure. Compensation Actually Paid reflects the exclusions and inclusions of certain amounts for the PEO and the Non-PEO NEOs as set forth below. Equity values are calculated in accordance with FASB ASC Topic 718. Neither the PEO nor the Non-PEO NEOs are accruing benefits under a pension plan for services rendered in the covered years, and therefore no additions are required for pension plan service cost in determining Compensation Actually Paid. The following table reconciles the Non-PEO NEOs Average Summary Compensation Table total to Average Compensation Actually Paid for the periods indicated: | | | | | | | | | | | | | | | | | | | | | | | | | | | | Year | Average Salary ($) | Average Bonus and Non-Equity Incentive Compensation ($) | Average Equity Compensation ($) | Average All Other Compensation ($) | Average Summary Compensation Table Total ($) | Deductions from Summary Compensation Table Total ($) (1) | Average Additions (Deductions) to Compensation Table Total ($) (2) | Average Compensation Actually Paid ($) | | 2024 | 401,810 | | 370,000 | | 228,261 | | 10,629 | | 1,010,700 | | (228,261) | | 368,144 | | 1,150,583 | | | 2023 | 281,454 | | 40,000 | | 106,871 | | 223,541 | | 651,866 | | (106,871) | | 30,488 | | 575,483 | | | 2022 | 430,177 | | 62,500 | | 1,270,832 | | 30,315 | | 1,793,824 | | (1,270,832) | | (2,921,118) | | (2,398,126) | |
______________ (1) Represents the average grant date fair value of equity-based awards granted each year. (2) Reflects the average value of equity calculated in accordance with the SEC methodology for determining Compensation Actually Paid for each period presented. The equity component of compensation actually paid is further detailed in the supplemental table below. The following table includes supplemental data for the additions and deductions resulting in equity component of Non-PEO NEOs Average Compensation Actually Paid for the periods indicated: | | | | | | | | | | | | | | | | | | | | | | Fiscal Year | Addition of Average Fair Value of Current Year Equity Awards Unvested and Outstanding at Fiscal Year End ($) | (Deductions) Additions for Average Change in Value of Prior Years’ Awards Unvested and Outstanding at Fiscal Year End ($) | Additions (Deductions) for Average Change in Value of Prior Years’ Awards That Vested in Fiscal Year ($) | Additions of Average Fair Value as of the Vesting Date for Awards that are Granted and Vested in the Fiscal Year ($) | (Deductions) for Forfeited Prior Years’ Awards | Equity Value Included in Compensation Actually Paid ($) | | 2024 | 274,187 | | 121,381 | | (27,424) | | — | | — | | 368,144 | | | 2023 | 166,767 | | (16,940) | | (44,265) | | — | | (75,074) | | 30,488 | | | 2022 | 240,683 | | (2,722,030) | | (689,770) | | 249,999 | | — | | (2,921,118) | |
|
|
|
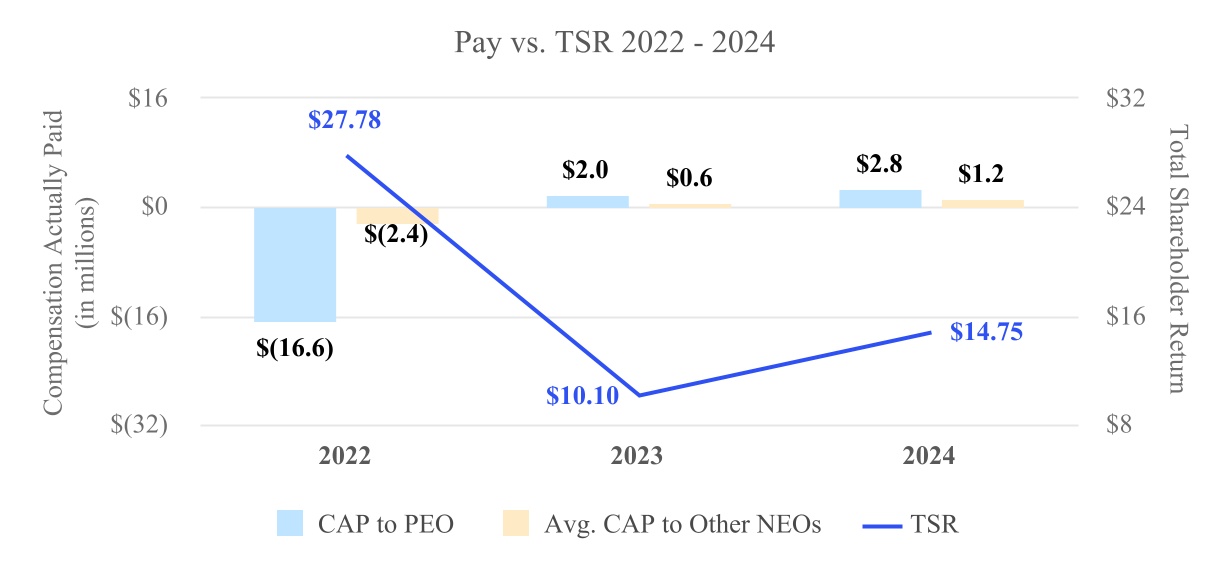
| Compensation Actually Paid vs. Total Shareholder Return |
The following charts are based on the information provided in the tables above to illustrate the relationships between the Company’s compensation actually paid to the PEO and the average compensation actually paid to the Company’s non-PEO NEOs, with (i) the Company’s net loss, and (ii) the Company’s cumulative total shareholder return.
|
|
|
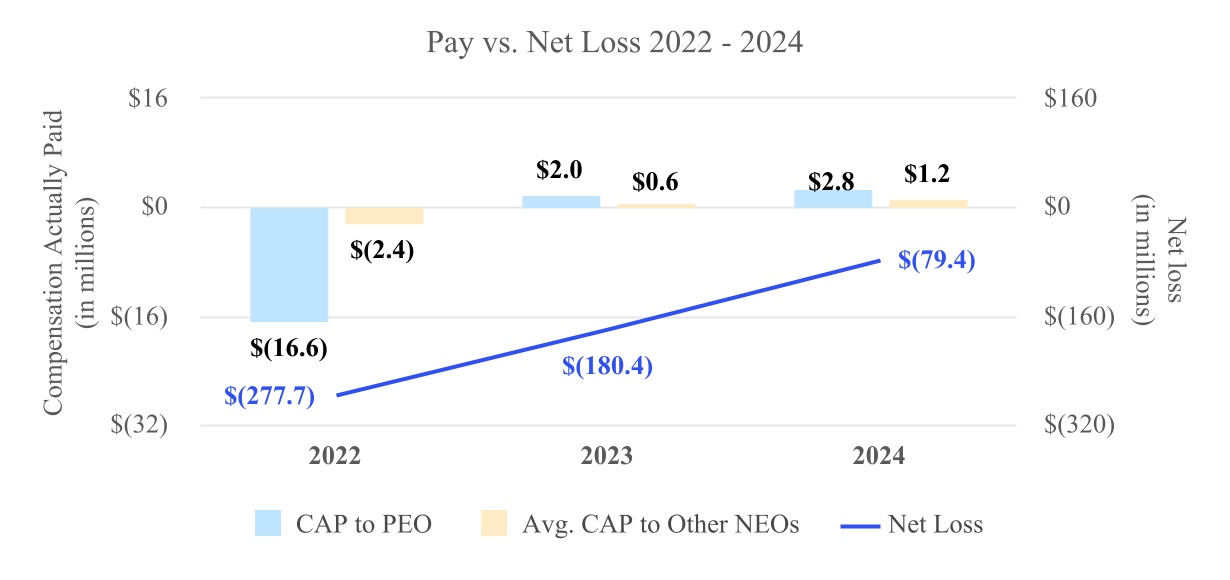
| Compensation Actually Paid vs. Net Income |
The following charts are based on the information provided in the tables above to illustrate the relationships between the Company’s compensation actually paid to the PEO and the average compensation actually paid to the Company’s non-PEO NEOs, with (i) the Company’s net loss, and (ii) the Company’s cumulative total shareholder return.
|
|
|
| Total Shareholder Return Amount |
$ 14.75
|
10.10
|
27.78
|
| Net Income (Loss) |
$ (79,397,000)
|
(180,417,941)
|
(277,704,361)
|
| PEO Name |
Mr. Kohn
|
|
|
| Additional 402(v) Disclosure |
Assumes an initial investment of $100 in our Common Stock on January 1 of the listed year through the end of the listed year. Total return equals stock price appreciation plus reinvestment of any dividends (of which the Company had none for the listed years). Historical stock performance is not necessarily indicative of future stock performance.
|
|
|
| PEO Salary |
$ 852,838
|
852,238
|
851,710
|
| PEO Bonus and Non-Equity Incentive Compensation |
850,000
|
0
|
0
|
| PEO Equity Compensation |
652,174
|
1,013,063
|
1,785,649
|
| PEO Other Compensation |
9,754
|
9,754
|
1,080,554
|
| Non-PEO NEO Salary |
401,810
|
281,454
|
430,177
|
| Non-PEO NEO Bonus and Non-Equity Incentive Compensation |
370,000
|
40,000
|
62,500
|
| Non-PEO NEO Equity Compensation |
228,261
|
106,871
|
1,270,832
|
| Non-PEO NEO Other Compensation |
10,629
|
223,541
|
30,315
|
| PEO | Aggregate Grant Date Fair Value of Equity Award Amounts Reported in Summary Compensation Table |
|
|
|
| Pay vs Performance Disclosure |
|
|
|
| Adjustment to Compensation, Amount |
(652,174)
|
(1,013,063)
|
(1,785,649)
|
| PEO | Equity Awards Adjustments, Excluding Value Reported in Compensation Table |
|
|
|
| Pay vs Performance Disclosure |
|
|
|
| Adjustment to Compensation, Amount |
1,069,247
|
1,103,840
|
(18,508,174)
|
| PEO | Year-end Fair Value of Equity Awards Granted in Covered Year that are Outstanding and Unvested |
|
|
|
| Pay vs Performance Disclosure |
|
|
|
| Adjustment to Compensation, Amount |
783,392
|
1,657,748
|
499,546
|
| PEO | Year-over-Year Change in Fair Value of Equity Awards Granted in Prior Years That are Outstanding and Unvested |
|
|
|
| Pay vs Performance Disclosure |
|
|
|
| Adjustment to Compensation, Amount |
457,521
|
(291,172)
|
(12,135,455)
|
| PEO | Vesting Date Fair Value of Equity Awards Granted and Vested in Covered Year |
|
|
|
| Pay vs Performance Disclosure |
|
|
|
| Adjustment to Compensation, Amount |
0
|
0
|
0
|
| PEO | Change in Fair Value as of Vesting Date of Prior Year Equity Awards Vested in Covered Year |
|
|
|
| Pay vs Performance Disclosure |
|
|
|
| Adjustment to Compensation, Amount |
(171,666)
|
(262,736)
|
(6,872,265)
|
| PEO | Prior Year End Fair Value of Equity Awards Granted in Any Prior Year that Fail to Meet Applicable Vesting Conditions During Covered Year |
|
|
|
| Pay vs Performance Disclosure |
|
|
|
| Adjustment to Compensation, Amount |
0
|
0
|
0
|
| Non-PEO NEO | Aggregate Grant Date Fair Value of Equity Award Amounts Reported in Summary Compensation Table |
|
|
|
| Pay vs Performance Disclosure |
|
|
|
| Adjustment to Compensation, Amount |
(228,261)
|
(106,871)
|
(1,270,832)
|
| Non-PEO NEO | Equity Awards Adjustments, Excluding Value Reported in Compensation Table |
|
|
|
| Pay vs Performance Disclosure |
|
|
|
| Adjustment to Compensation, Amount |
368,144
|
30,488
|
(2,921,118)
|
| Non-PEO NEO | Year-end Fair Value of Equity Awards Granted in Covered Year that are Outstanding and Unvested |
|
|
|
| Pay vs Performance Disclosure |
|
|
|
| Adjustment to Compensation, Amount |
274,187
|
166,767
|
240,683
|
| Non-PEO NEO | Year-over-Year Change in Fair Value of Equity Awards Granted in Prior Years That are Outstanding and Unvested |
|
|
|
| Pay vs Performance Disclosure |
|
|
|
| Adjustment to Compensation, Amount |
121,381
|
(16,940)
|
(2,722,030)
|
| Non-PEO NEO | Vesting Date Fair Value of Equity Awards Granted and Vested in Covered Year |
|
|
|
| Pay vs Performance Disclosure |
|
|
|
| Adjustment to Compensation, Amount |
0
|
0
|
249,999
|
| Non-PEO NEO | Change in Fair Value as of Vesting Date of Prior Year Equity Awards Vested in Covered Year |
|
|
|
| Pay vs Performance Disclosure |
|
|
|
| Adjustment to Compensation, Amount |
(27,424)
|
(44,265)
|
(689,770)
|
| Non-PEO NEO | Prior Year End Fair Value of Equity Awards Granted in Any Prior Year that Fail to Meet Applicable Vesting Conditions During Covered Year |
|
|
|
| Pay vs Performance Disclosure |
|
|
|
| Adjustment to Compensation, Amount |
$ 0
|
$ (75,074)
|
$ 0
|