Shareholder Report
Feb. 28, 2025
USD ($)
Holding


Shareholder Report |
6 Months Ended |
|---|---|
|
Feb. 28, 2025
USD ($)
Holding
| |
| Shareholder Report [Line Items] | |
| Document Type | N-CSRS |
| Amendment Flag | false |
| Registrant Name | AB PORTFOLIOS |
| Entity Central Index Key | 0000812015 |
| Entity Investment Company Type | N-1A |
| Document Period End Date | Feb. 28, 2025 |
| C000029018 | |
| Shareholder Report [Line Items] | |
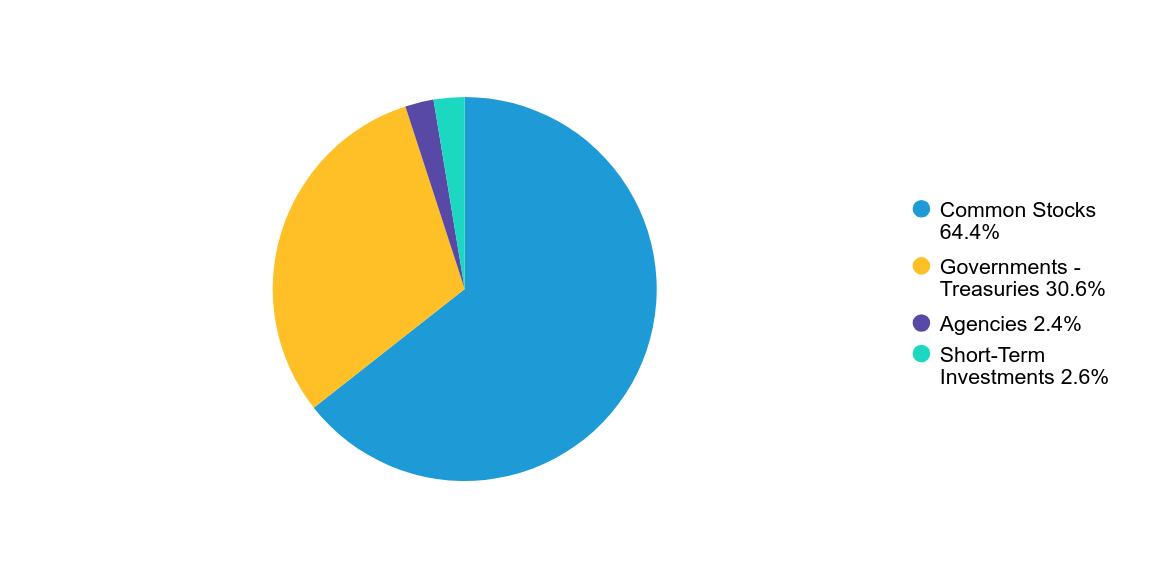
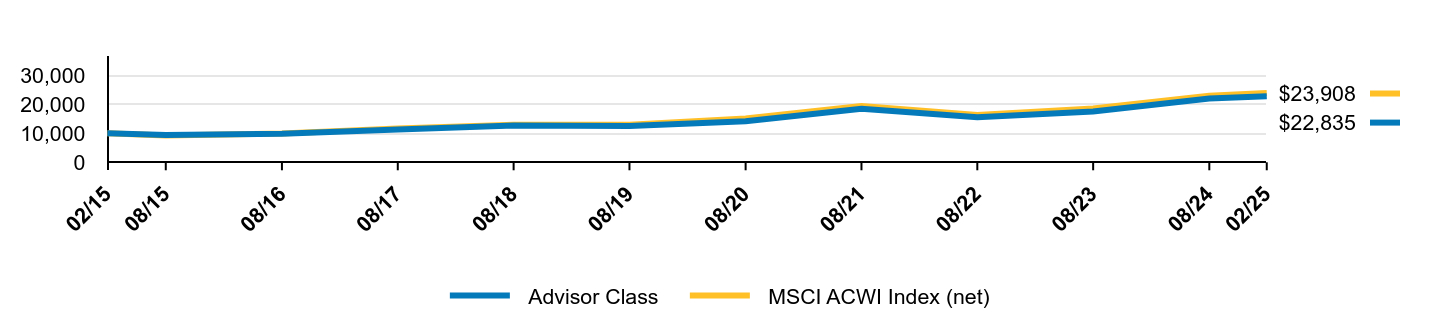
| Fund Name | AB All Market Total Return Portfolio |
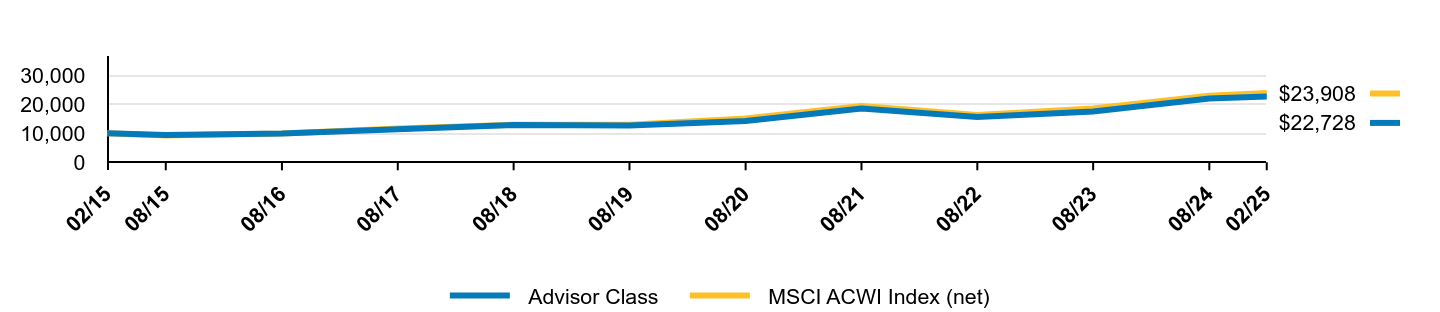
| Class Name | Advisor Class |
| Trading Symbol | ABWYX |
| Annual or Semi-Annual Statement [Text Block] | This semi-annual shareholder report contains important information about the AB All Market Total Return Portfolio (the “Fund”) for the period of September 1, 2024 to February 28, 2025. |
| Shareholder Report Annual or Semi-Annual | Semi-Annual Shareholder Report |
| Additional Information [Text Block] | You can find additional information about the Fund at https://www.abfunds.com/link/AB/ABWYX-S. You can also request this information by contacting us at (800) 227 4618. |
| Additional Information Phone Number | (800) 227 4618 |
| Additional Information Website | https://www.abfunds.com/link/AB/ABWYX-S |
| Expenses [Text Block] | |
| Expenses Paid, Amount | $ 41 |
| Expense Ratio, Percent | 0.82% |
| Performance Past Does Not Indicate Future [Text] | <span style="font-weight: 700; box-sizing: border-box; color: rgb(0, 0, 0); display: inline; flex-wrap: nowrap; font-size: 12px; grid-area: auto; line-height: 15.6px; margin: 0px; overflow: visible; text-align: left;">The Fund’s past performance is not a good predictor of the Fund’s future performance.</span> |
| Line Graph [Table Text Block] | |
| Average Annual Return [Table Text Block] | |
| No Deduction of Taxes [Text Block] | The graph and table do not reflect the deduction of taxes that a shareholder would pay on Fund distributions or the redemption or sale of Fund shares. |
| AssetsNet | $ 421,256,745 |
| Holdings Count | Holding | 645 |
| Advisory Fees Paid, Amount | $ 1,088,443 |
| InvestmentCompanyPortfolioTurnover | 95.00% |
| Additional Fund Statistics [Text Block] | |
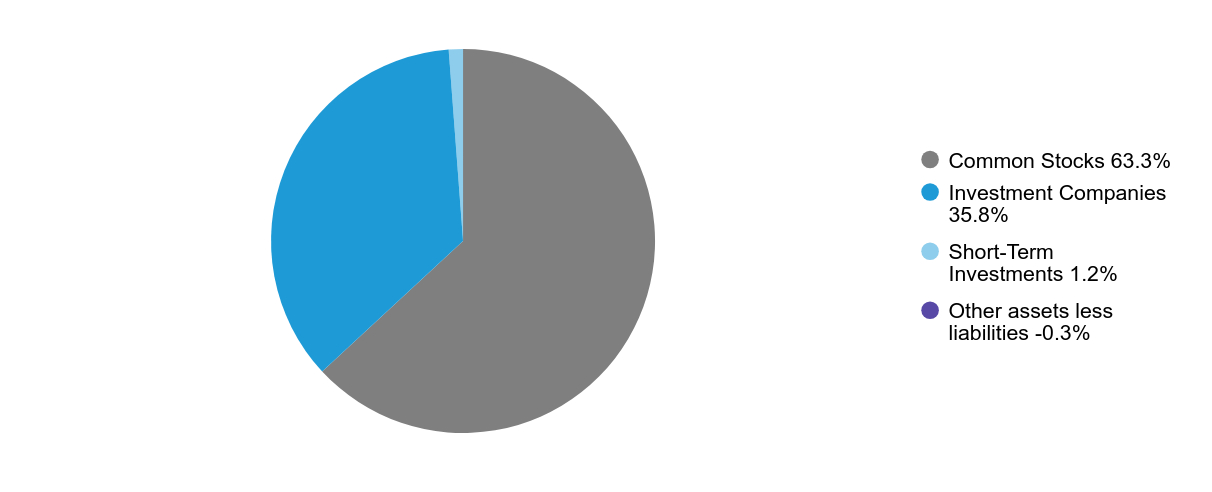
| Holdings [Text Block] | |
| C000029015 | |
| Shareholder Report [Line Items] | |
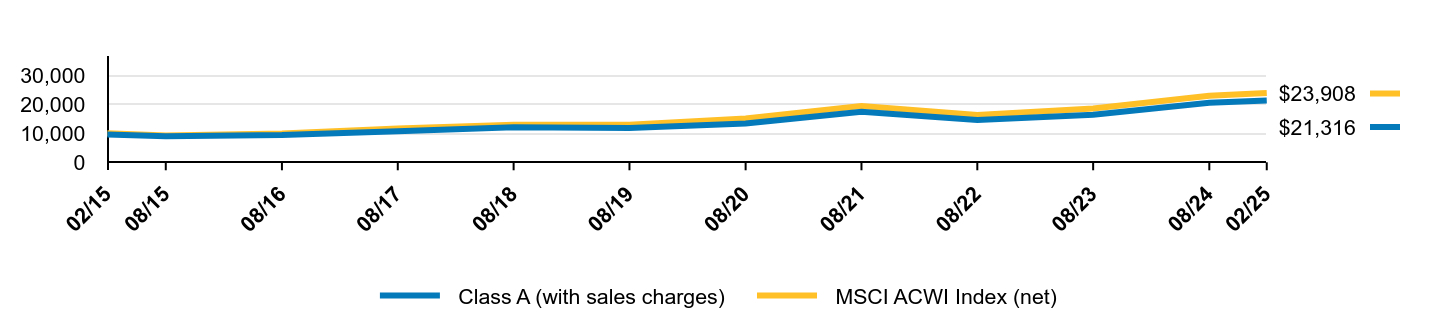
| Fund Name | AB All Market Total Return Portfolio |
| Class Name | Class A |
| Trading Symbol | ABWAX |
| Annual or Semi-Annual Statement [Text Block] | This semi-annual shareholder report contains important information about the AB All Market Total Return Portfolio (the “Fund”) for the period of September 1, 2024 to February 28, 2025. |
| Shareholder Report Annual or Semi-Annual | Semi-Annual Shareholder Report |
| Additional Information [Text Block] | You can find additional information about the Fund at https://www.abfunds.com/link/AB/ABWAX-S. You can also request this information by contacting us at (800) 227 4618. |
| Additional Information Phone Number | (800) 227 4618 |
| Additional Information Website | https://www.abfunds.com/link/AB/ABWAX-S |
| Expenses [Text Block] | |
| Expenses Paid, Amount | $ 54 |
| Expense Ratio, Percent | 1.07% |
| Performance Past Does Not Indicate Future [Text] | <span style="font-weight: 700; box-sizing: border-box; color: rgb(0, 0, 0); display: inline; flex-wrap: nowrap; font-size: 12px; grid-area: auto; line-height: 15.6px; margin: 0px; overflow: visible; text-align: left;">The Fund’s past performance is not a good predictor of the Fund’s future performance.</span> |
| Average Annual Return [Table Text Block] | |
| No Deduction of Taxes [Text Block] | The graph and table do not reflect the deduction of taxes that a shareholder would pay on Fund distributions or the redemption or sale of Fund shares. |
| AssetsNet | $ 421,256,745 |
| Holdings Count | Holding | 645 |
| Advisory Fees Paid, Amount | $ 1,088,443 |
| InvestmentCompanyPortfolioTurnover | 95.00% |
| Additional Fund Statistics [Text Block] | |
| Holdings [Text Block] | |
| C000029017 | |
| Shareholder Report [Line Items] | |
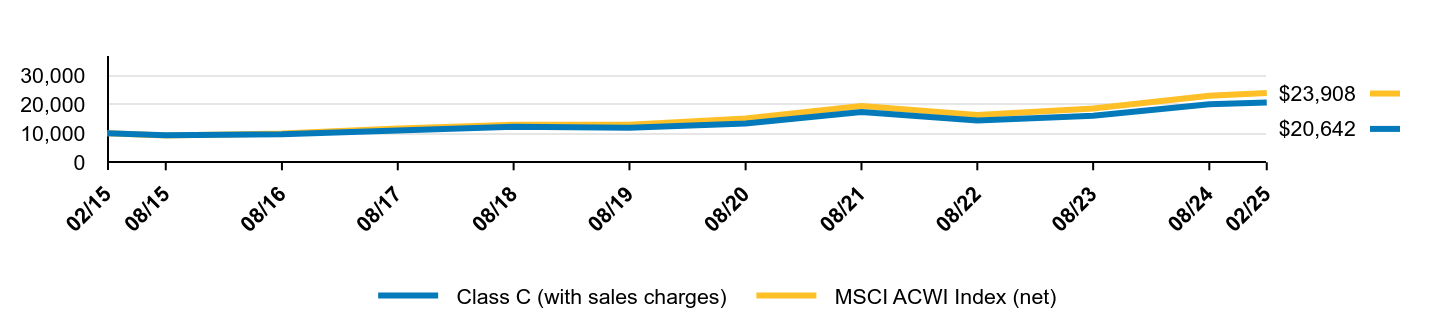
| Fund Name | AB All Market Total Return Portfolio |
| Class Name | Class C |
| Trading Symbol | ABWCX |
| Annual or Semi-Annual Statement [Text Block] | This semi-annual shareholder report contains important information about the AB All Market Total Return Portfolio (the “Fund”) for the period of September 1, 2024 to February 28, 2025. |
| Shareholder Report Annual or Semi-Annual | Semi-Annual Shareholder Report |
| Additional Information [Text Block] | You can find additional information about the Fund at https://www.abfunds.com/link/AB/ABWCX-S. You can also request this information by contacting us at (800) 227 4618. |
| Additional Information Phone Number | (800) 227 4618 |
| Additional Information Website | https://www.abfunds.com/link/AB/ABWCX-S |
| Expenses [Text Block] | |
| Expenses Paid, Amount | $ 91 |
| Expense Ratio, Percent | 1.82% |
| Performance Past Does Not Indicate Future [Text] | <span style="font-weight: 700; box-sizing: border-box; color: rgb(0, 0, 0); display: inline; flex-wrap: nowrap; font-size: 12px; grid-area: auto; line-height: 15.6px; margin: 0px; overflow: visible; text-align: left;">The Fund’s past performance is not a good predictor of the Fund’s future performance.</span> |
| Average Annual Return [Table Text Block] | |
| No Deduction of Taxes [Text Block] | The graph and table do not reflect the deduction of taxes that a shareholder would pay on Fund distributions or the redemption or sale of Fund shares. |
| AssetsNet | $ 421,256,745 |
| Holdings Count | Holding | 645 |
| Advisory Fees Paid, Amount | $ 1,088,443 |
| InvestmentCompanyPortfolioTurnover | 95.00% |
| Additional Fund Statistics [Text Block] | |
| Holdings [Text Block] | |
| C000029021 | |
| Shareholder Report [Line Items] | |
| Fund Name | AB All Market Total Return Portfolio |
| Class Name | Class I |
| Trading Symbol | ABWIX |
| Annual or Semi-Annual Statement [Text Block] | This semi-annual shareholder report contains important information about the AB All Market Total Return Portfolio (the “Fund”) for the period of September 1, 2024 to February 28, 2025. |
| Shareholder Report Annual or Semi-Annual | Semi-Annual Shareholder Report |
| Additional Information [Text Block] | You can find additional information about the Fund at https://www.abfunds.com/link/AB/ABWIX-S. You can also request this information by contacting us at (800) 227 4618. |
| Additional Information Phone Number | (800) 227 4618 |
| Additional Information Website | https://www.abfunds.com/link/AB/ABWIX-S |
| Expenses [Text Block] | |
| Expenses Paid, Amount | $ 41 |
| Expense Ratio, Percent | 0.82% |
| Performance Past Does Not Indicate Future [Text] | <span style="font-weight: 700; box-sizing: border-box; color: rgb(0, 0, 0); display: inline; flex-wrap: nowrap; font-size: 12px; grid-area: auto; line-height: 15.6px; margin: 0px; overflow: visible; text-align: left;">The Fund’s past performance is not a good predictor of the Fund’s future performance.</span> |
| Average Annual Return [Table Text Block] | |
| No Deduction of Taxes [Text Block] | The graph and table do not reflect the deduction of taxes that a shareholder would pay on Fund distributions or the redemption or sale of Fund shares. |
| AssetsNet | $ 421,256,745 |
| Holdings Count | Holding | 645 |
| Advisory Fees Paid, Amount | $ 1,088,443 |
| InvestmentCompanyPortfolioTurnover | 95.00% |
| Additional Fund Statistics [Text Block] | |
| Holdings [Text Block] | |
| C000029007 | |
| Shareholder Report [Line Items] | |
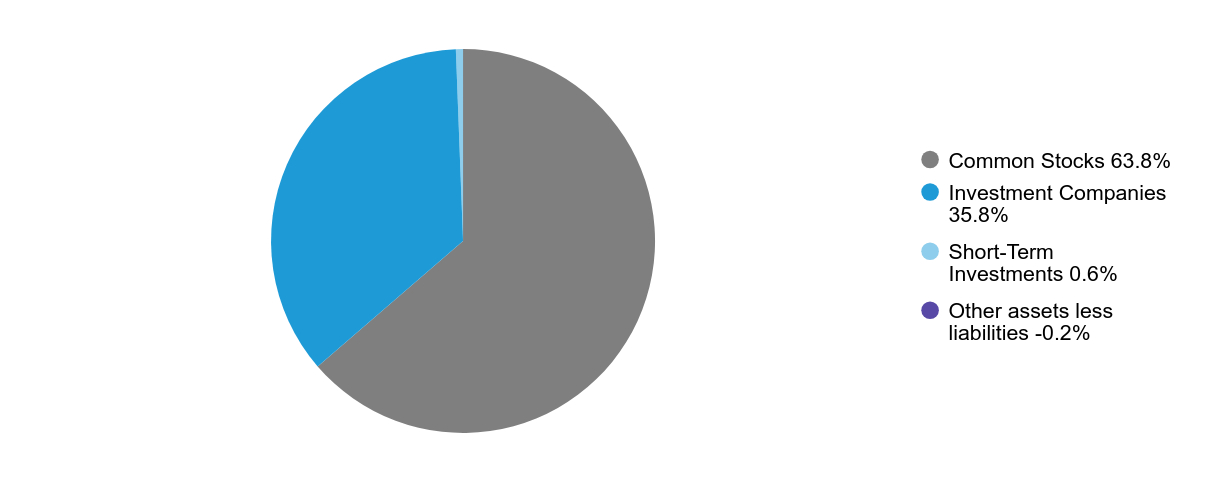
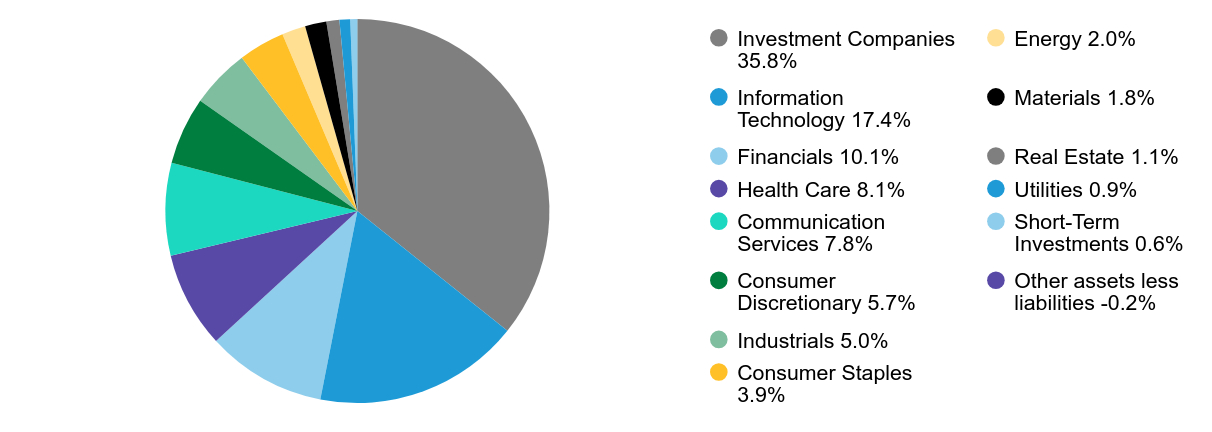
| Fund Name | AB Sustainable Thematic Balanced Portfolio |
| Class Name | Advisor Class |
| Trading Symbol | ABPYX |
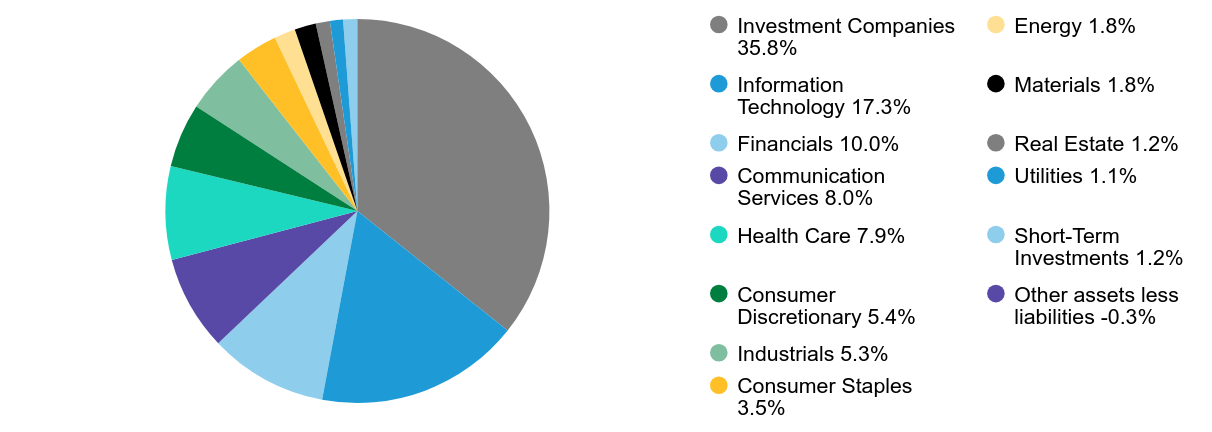
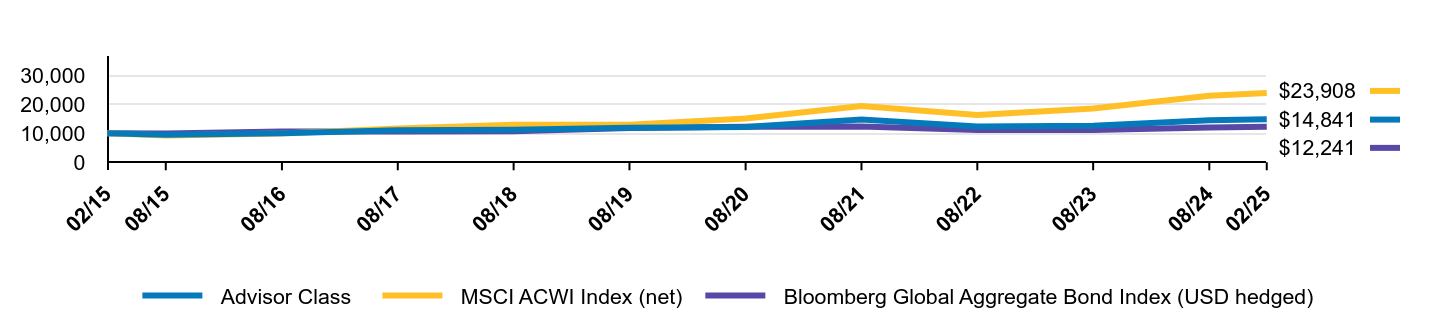
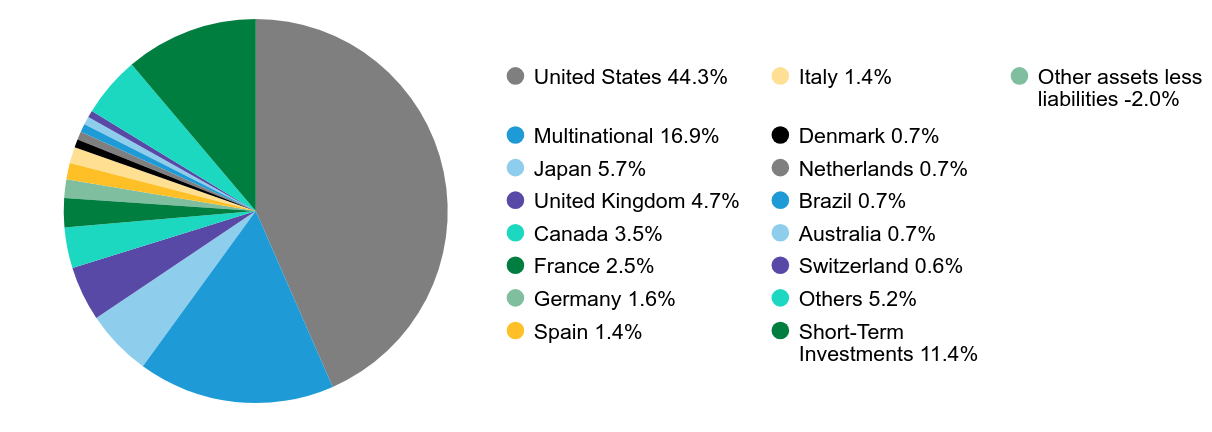
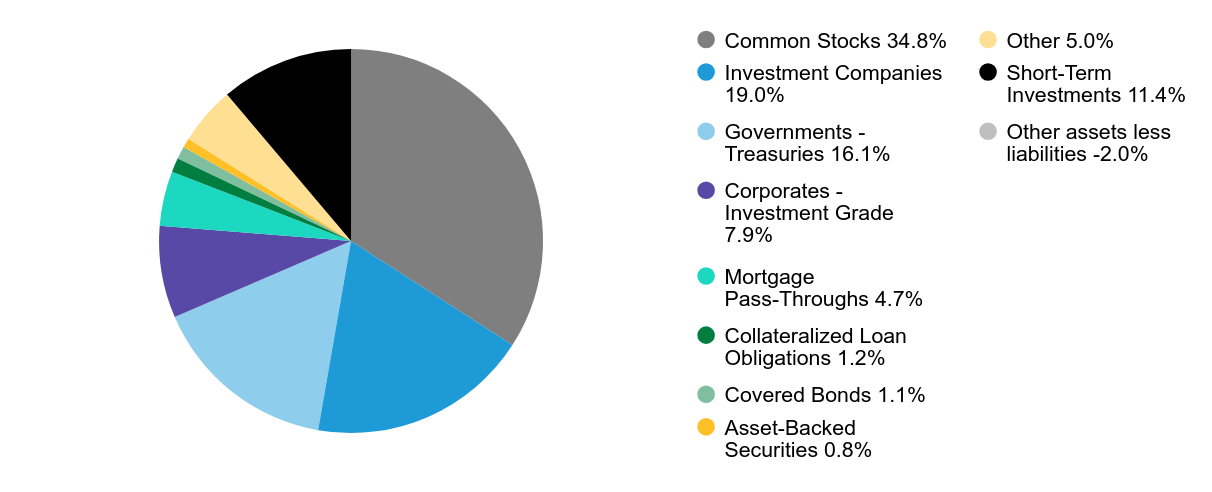
| Annual or Semi-Annual Statement [Text Block] | This semi-annual shareholder report contains important information about the AB Sustainable Thematic Balanced Portfolio (the “Fund”) for the period of September 1, 2024 to February 28, 2025. |
| Shareholder Report Annual or Semi-Annual | Semi-Annual Shareholder Report |
| Additional Information [Text Block] | You can find additional information about the Fund at https://www.abfunds.com/link/AB/ABPYX-S. You can also request this information by contacting us at (800) 227 4618. |
| Additional Information Phone Number | (800) 227 4618 |
| Additional Information Website | https://www.abfunds.com/link/AB/ABPYX-S |
| Expenses [Text Block] | |
| Expenses Paid, Amount | $ 36 |
| Expense Ratio, Percent | 0.74% |
| Performance Past Does Not Indicate Future [Text] | <span style="font-weight: 700; box-sizing: border-box; color: rgb(0, 0, 0); display: inline; flex-wrap: nowrap; font-size: 12px; grid-area: auto; line-height: 15.6px; margin: 0px; overflow: visible; text-align: left;">The Fund’s past performance is not a good predictor of the Fund’s future performance.</span> |
| Average Annual Return [Table Text Block] | |
| No Deduction of Taxes [Text Block] | The graph and table do not reflect the deduction of taxes that a shareholder would pay on Fund distributions or the redemption or sale of Fund shares. |
| AssetsNet | $ 89,706,956 |
| Holdings Count | Holding | 79 |
| Advisory Fees Paid, Amount | $ 131,088 |
| InvestmentCompanyPortfolioTurnover | 25.00% |
| Additional Fund Statistics [Text Block] | |
| Holdings [Text Block] | |
| C000029004 | |
| Shareholder Report [Line Items] | |
| Fund Name | AB Sustainable Thematic Balanced Portfolio |
| Class Name | Class A |
| Trading Symbol | ABPAX |
| Annual or Semi-Annual Statement [Text Block] | This semi-annual shareholder report contains important information about the AB Sustainable Thematic Balanced Portfolio (the “Fund”) for the period of September 1, 2024 to February 28, 2025. |
| Shareholder Report Annual or Semi-Annual | Semi-Annual Shareholder Report |
| Additional Information [Text Block] | You can find additional information about the Fund at https://www.abfunds.com/link/AB/ABPAX-S. You can also request this information by contacting us at (800) 227 4618. |
| Additional Information Phone Number | (800) 227 4618 |
| Additional Information Website | https://www.abfunds.com/link/AB/ABPAX-S |
| Expenses [Text Block] | |
| Expenses Paid, Amount | $ 48 |
| Expense Ratio, Percent | 0.99% |
| Performance Past Does Not Indicate Future [Text] | <span style="font-weight: 700; box-sizing: border-box; color: rgb(0, 0, 0); display: inline; flex-wrap: nowrap; font-size: 12px; grid-area: auto; line-height: 15.6px; margin: 0px; overflow: visible; text-align: left;">The Fund’s past performance is not a good predictor of the Fund’s future performance.</span> |
| Average Annual Return [Table Text Block] | |
| No Deduction of Taxes [Text Block] | The graph and table do not reflect the deduction of taxes that a shareholder would pay on Fund distributions or the redemption or sale of Fund shares. |
| AssetsNet | $ 89,706,956 |
| Holdings Count | Holding | 79 |
| Advisory Fees Paid, Amount | $ 131,088 |
| InvestmentCompanyPortfolioTurnover | 25.00% |
| Additional Fund Statistics [Text Block] | |
| Holdings [Text Block] | |
| C000029006 | |
| Shareholder Report [Line Items] | |
| Fund Name | AB Sustainable Thematic Balanced Portfolio |
| Class Name | Class C |
| Trading Symbol | ABPCX |
| Annual or Semi-Annual Statement [Text Block] | This semi-annual shareholder report contains important information about the AB Sustainable Thematic Balanced Portfolio (the “Fund”) for the period of September 1, 2024 to February 28, 2025. |
| Shareholder Report Annual or Semi-Annual | Semi-Annual Shareholder Report |
| Additional Information [Text Block] | You can find additional information about the Fund at https://www.abfunds.com/link/AB/ABPCX-S. You can also request this information by contacting us at (800) 227 4618. |
| Additional Information Phone Number | (800) 227 4618 |
| Additional Information Website | https://www.abfunds.com/link/AB/ABPCX-S |
| Expenses [Text Block] | |
| Expenses Paid, Amount | $ 84 |
| Expense Ratio, Percent | 1.74% |
| Performance Past Does Not Indicate Future [Text] | <span style="font-weight: 700; box-sizing: border-box; color: rgb(0, 0, 0); display: inline; flex-wrap: nowrap; font-size: 12px; grid-area: auto; line-height: 15.6px; margin: 0px; overflow: visible; text-align: left;">The Fund’s past performance is not a good predictor of the Fund’s future performance.</span> |
| Average Annual Return [Table Text Block] | |
| No Deduction of Taxes [Text Block] | The graph and table do not reflect the deduction of taxes that a shareholder would pay on Fund distributions or the redemption or sale of Fund shares. |
| AssetsNet | $ 89,706,956 |
| Holdings Count | Holding | 79 |
| Advisory Fees Paid, Amount | $ 131,088 |
| InvestmentCompanyPortfolioTurnover | 25.00% |
| Additional Fund Statistics [Text Block] | |
| Holdings [Text Block] | |
| C000029010 | |
| Shareholder Report [Line Items] | |
| Fund Name | AB Sustainable Thematic Balanced Portfolio |
| Class Name | Class I |
| Trading Symbol | APWIX |
| Annual or Semi-Annual Statement [Text Block] | This semi-annual shareholder report contains important information about the AB Sustainable Thematic Balanced Portfolio (the “Fund”) for the period of September 1, 2024 to February 28, 2025. |
| Shareholder Report Annual or Semi-Annual | Semi-Annual Shareholder Report |
| Additional Information [Text Block] | You can find additional information about the Fund at https://www.abfunds.com/link/AB/APWIX-S. You can also request this information by contacting us at (800) 227 4618. |
| Additional Information Phone Number | (800) 227 4618 |
| Additional Information Website | https://www.abfunds.com/link/AB/APWIX-S |
| Expenses [Text Block] | |
| Expenses Paid, Amount | $ 36 |
| Expense Ratio, Percent | 0.74% |
| Performance Past Does Not Indicate Future [Text] | <span style="font-weight: 700; box-sizing: border-box; color: rgb(0, 0, 0); display: inline; flex-wrap: nowrap; font-size: 12px; grid-area: auto; line-height: 15.6px; margin: 0px; overflow: visible; text-align: left;">The Fund’s past performance is not a good predictor of the Fund’s future performance.</span> |
| Average Annual Return [Table Text Block] | |
| No Deduction of Taxes [Text Block] | The graph and table do not reflect the deduction of taxes that a shareholder would pay on Fund distributions or the redemption or sale of Fund shares. |
| AssetsNet | $ 89,706,956 |
| Holdings Count | Holding | 79 |
| Advisory Fees Paid, Amount | $ 131,088 |
| InvestmentCompanyPortfolioTurnover | 25.00% |
| Additional Fund Statistics [Text Block] | |
| Holdings [Text Block] | |
| C000232929 | |
| Shareholder Report [Line Items] | |
| Fund Name | AB Sustainable Thematic Balanced Portfolio |
| Class Name | Class Z |
| Trading Symbol | ABPZX |
| Annual or Semi-Annual Statement [Text Block] | This semi-annual shareholder report contains important information about the AB Sustainable Thematic Balanced Portfolio (the “Fund”) for the period of September 1, 2024 to February 28, 2025. |
| Shareholder Report Annual or Semi-Annual | Semi-Annual Shareholder Report |
| Additional Information [Text Block] | You can find additional information about the Fund at https://www.abfunds.com/link/AB/ABPZX-S. You can also request this information by contacting us at (800) 227 4618. |
| Additional Information Phone Number | (800) 227 4618 |
| Additional Information Website | https://www.abfunds.com/link/AB/ABPZX-S |
| Expenses [Text Block] | |
| Expenses Paid, Amount | $ 36 |
| Expense Ratio, Percent | 0.75% |
| Performance Past Does Not Indicate Future [Text] | <span style="font-weight: 700; box-sizing: border-box; color: rgb(0, 0, 0); display: inline; flex-wrap: nowrap; font-size: 12px; grid-area: auto; line-height: 15.6px; margin: 0px; overflow: visible; text-align: left; white-space-collapse: preserve-breaks;">The Fund’s past performance is not a good predictor of the Fund’s future performance.</span> |
| Average Annual Return [Table Text Block] | |
| Performance Inception Date | Dec. 15, 2021 |
| No Deduction of Taxes [Text Block] | The graph and table do not reflect the deduction of taxes that a shareholder would pay on Fund distributions or the redemption or sale of Fund shares. |
| AssetsNet | $ 89,706,956 |
| Holdings Count | Holding | 79 |
| Advisory Fees Paid, Amount | $ 131,088 |
| InvestmentCompanyPortfolioTurnover | 25.00% |
| Additional Fund Statistics [Text Block] | |
| Holdings [Text Block] | |
| C000029036 | |
| Shareholder Report [Line Items] | |
| Fund Name | AB Tax-Managed Wealth Appreciation Strategy |
| Class Name | Advisor Class |
| Trading Symbol | ATWYX |
| Annual or Semi-Annual Statement [Text Block] | This semi-annual shareholder report contains important information about the AB Tax-Managed Wealth Appreciation Strategy (the “Fund”) for the period of September 1, 2024 to February 28, 2025. |
| Shareholder Report Annual or Semi-Annual | Semi-Annual Shareholder Report |
| Additional Information [Text Block] | You can find additional information about the Fund at https://www.abfunds.com/link/AB/ATWYX-S. You can also request this information by contacting us at (800) 227 4618. |
| Additional Information Phone Number | (800) 227 4618 |
| Additional Information Website | https://www.abfunds.com/link/AB/ATWYX-S |
| Expenses [Text Block] | |
| Expenses Paid, Amount | $ 21 |
| Expense Ratio, Percent | 0.42% |
| Performance Past Does Not Indicate Future [Text] | <span style="font-weight: 700; box-sizing: border-box; color: rgb(0, 0, 0); display: inline; flex-wrap: nowrap; font-size: 12px; grid-area: auto; line-height: 15.6px; margin: 0px; overflow: visible; text-align: left;">The Fund’s past performance is not a good predictor of the Fund’s future performance.</span> |
| Line Graph [Table Text Block] | |
| Average Annual Return [Table Text Block] | |
| No Deduction of Taxes [Text Block] | The graph and table do not reflect the deduction of taxes that a shareholder would pay on Fund distributions or the redemption or sale of Fund shares. |
| AssetsNet | $ 864,012,197 |
| Holdings Count | Holding | 102 |
| Advisory Fees Paid, Amount | $ 1,549,955 |
| InvestmentCompanyPortfolioTurnover | 14.00% |
| Additional Fund Statistics [Text Block] | |
| Holdings [Text Block] | |
| C000029033 | |
| Shareholder Report [Line Items] | |
| Fund Name | AB Tax-Managed Wealth Appreciation Strategy |
| Class Name | Class A |
| Trading Symbol | ATWAX |
| Annual or Semi-Annual Statement [Text Block] | This semi-annual shareholder report contains important information about the AB Tax-Managed Wealth Appreciation Strategy (the “Fund”) for the period of September 1, 2024 to February 28, 2025. |
| Shareholder Report Annual or Semi-Annual | Semi-Annual Shareholder Report |
| Additional Information [Text Block] | You can find additional information about the Fund at https://www.abfunds.com/link/AB/ATWAX-S. You can also request this information by contacting us at (800) 227 4618. |
| Additional Information Phone Number | (800) 227 4618 |
| Additional Information Website | https://www.abfunds.com/link/AB/ATWAX-S |
| Expenses [Text Block] | |
| Expenses Paid, Amount | $ 34 |
| Expense Ratio, Percent | 0.67% |
| Performance Past Does Not Indicate Future [Text] | <span style="font-weight: 700; box-sizing: border-box; color: rgb(0, 0, 0); display: inline; flex-wrap: nowrap; font-size: 12px; grid-area: auto; line-height: 15.6px; margin: 0px; overflow: visible; text-align: left;">The Fund’s past performance is not a good predictor of the Fund’s future performance.</span> |
| Average Annual Return [Table Text Block] | |
| No Deduction of Taxes [Text Block] | The graph and table do not reflect the deduction of taxes that a shareholder would pay on Fund distributions or the redemption or sale of Fund shares. |
| AssetsNet | $ 864,012,197 |
| Holdings Count | Holding | 102 |
| Advisory Fees Paid, Amount | $ 1,549,955 |
| InvestmentCompanyPortfolioTurnover | 14.00% |
| Additional Fund Statistics [Text Block] | |
| Holdings [Text Block] | |
| C000029035 | |
| Shareholder Report [Line Items] | |
| Fund Name | AB Tax-Managed Wealth Appreciation Strategy |
| Class Name | Class C |
| Trading Symbol | ATWCX |
| Annual or Semi-Annual Statement [Text Block] | This semi-annual shareholder report contains important information about the AB Tax-Managed Wealth Appreciation Strategy (the “Fund”) for the period of September 1, 2024 to February 28, 2025. |
| Shareholder Report Annual or Semi-Annual | Semi-Annual Shareholder Report |
| Additional Information [Text Block] | You can find additional information about the Fund at https://www.abfunds.com/link/AB/ATWCX-S. You can also request this information by contacting us at (800) 227 4618. |
| Additional Information Phone Number | (800) 227 4618 |
| Additional Information Website | https://www.abfunds.com/link/AB/ATWCX-S |
| Expenses [Text Block] | |
| Expenses Paid, Amount | $ 71 |
| Expense Ratio, Percent | 1.42% |
| Performance Past Does Not Indicate Future [Text] | <span style="font-weight: 700; box-sizing: border-box; color: rgb(0, 0, 0); display: inline; flex-wrap: nowrap; font-size: 12px; grid-area: auto; line-height: 15.6px; margin: 0px; overflow: visible; text-align: left;">The Fund’s past performance is not a good predictor of the Fund’s future performance.</span> |
| Average Annual Return [Table Text Block] | |
| No Deduction of Taxes [Text Block] | The graph and table do not reflect the deduction of taxes that a shareholder would pay on Fund distributions or the redemption or sale of Fund shares. |
| AssetsNet | $ 864,012,197 |
| Holdings Count | Holding | 102 |
| Advisory Fees Paid, Amount | $ 1,549,955 |
| InvestmentCompanyPortfolioTurnover | 14.00% |
| Additional Fund Statistics [Text Block] | |
| Holdings [Text Block] | |
| C000029029 | |
| Shareholder Report [Line Items] | |
| Fund Name | AB Wealth Appreciation Strategy |
| Class Name | Advisor Class |
| Trading Symbol | AWAYX |
| Annual or Semi-Annual Statement [Text Block] | This semi-annual shareholder report contains important information about the AB Wealth Appreciation Strategy (the “Fund”) for the period of September 1, 2024 to February 28, 2025. |
| Shareholder Report Annual or Semi-Annual | Semi-Annual Shareholder Report |
| Additional Information [Text Block] | You can find additional information about the Fund at https://www.abfunds.com/link/AB/AWAYX-S. You can also request this information by contacting us at (800) 227 4618. |
| Additional Information Phone Number | (800) 227 4618 |
| Additional Information Website | https://www.abfunds.com/link/AB/AWAYX-S |
| Expenses [Text Block] | |
| Expenses Paid, Amount | $ 22 |
| Expense Ratio, Percent | 0.43% |
| Performance Past Does Not Indicate Future [Text] | <span style="font-weight: 700; box-sizing: border-box; color: rgb(0, 0, 0); display: inline; flex-wrap: nowrap; font-size: 12px; grid-area: auto; line-height: 15.6px; margin: 0px; overflow: visible; text-align: left; white-space-collapse: preserve-breaks;">The Fund’s past performance is not a good predictor of the Fund’s future performance.</span> |
| Line Graph [Table Text Block] | |
| Average Annual Return [Table Text Block] | |
| No Deduction of Taxes [Text Block] | The graph and table do not reflect the deduction of taxes that a shareholder would pay on Fund distributions or the redemption or sale of Fund shares. |
| AssetsNet | $ 1,243,853,751 |
| Holdings Count | Holding | 76 |
| Advisory Fees Paid, Amount | $ 2,231,361 |
| InvestmentCompanyPortfolioTurnover | 16.00% |
| Additional Fund Statistics [Text Block] | |
| Holdings [Text Block] | |
| C000029026 | |
| Shareholder Report [Line Items] | |
| Fund Name | AB Wealth Appreciation Strategy |
| Class Name | Class A |
| Trading Symbol | AWAAX |
| Annual or Semi-Annual Statement [Text Block] | This semi-annual shareholder report contains important information about the AB Wealth Appreciation Strategy (the “Fund”) for the period of September 1, 2024 to February 28, 2025. |
| Shareholder Report Annual or Semi-Annual | Semi-Annual Shareholder Report |
| Additional Information [Text Block] | You can find additional information about the Fund at https://www.abfunds.com/link/AB/AWAAX-S. You can also request this information by contacting us at (800) 227 4618. |
| Additional Information Phone Number | (800) 227 4618 |
| Additional Information Website | https://www.abfunds.com/link/AB/AWAAX-S |
| Expenses [Text Block] | |
| Expenses Paid, Amount | $ 34 |
| Expense Ratio, Percent | 0.68% |
| Performance Past Does Not Indicate Future [Text] | <span style="font-weight: 700; box-sizing: border-box; color: rgb(0, 0, 0); display: inline; flex-wrap: nowrap; font-size: 12px; grid-area: auto; line-height: 15.6px; margin: 0px; overflow: visible; text-align: left; white-space-collapse: preserve-breaks;">The Fund’s past performance is not a good predictor of the Fund’s future performance.</span> |
| Line Graph [Table Text Block] | |
| Average Annual Return [Table Text Block] | |
| No Deduction of Taxes [Text Block] | The graph and table do not reflect the deduction of taxes that a shareholder would pay on Fund distributions or the redemption or sale of Fund shares. |
| AssetsNet | $ 1,243,853,751 |
| Holdings Count | Holding | 76 |
| Advisory Fees Paid, Amount | $ 2,231,361 |
| InvestmentCompanyPortfolioTurnover | 16.00% |
| Additional Fund Statistics [Text Block] | |
| Holdings [Text Block] | |
| C000029028 | |
| Shareholder Report [Line Items] | |
| Fund Name | AB Wealth Appreciation Strategy |
| Class Name | Class C |
| Trading Symbol | AWACX |
| Annual or Semi-Annual Statement [Text Block] | This semi-annual shareholder report contains important information about the AB Wealth Appreciation Strategy (the “Fund”) for the period of September 1, 2024 to February 28, 2025. |
| Shareholder Report Annual or Semi-Annual | Semi-Annual Shareholder Report |
| Additional Information [Text Block] | You can find additional information about the Fund at https://www.abfunds.com/link/AB/AWACX-S. You can also request this information by contacting us at (800) 227 4618. |
| Additional Information Phone Number | (800) 227 4618 |
| Additional Information Website | https://www.abfunds.com/link/AB/AWACX-S |
| Expenses [Text Block] | |
| Expenses Paid, Amount | $ 73 |
| Expense Ratio, Percent | 1.44% |
| Performance Past Does Not Indicate Future [Text] | <span style="font-weight: 700; box-sizing: border-box; color: rgb(0, 0, 0); display: inline; flex-wrap: nowrap; font-size: 12px; grid-area: auto; line-height: 15.6px; margin: 0px; overflow: visible; text-align: left; white-space-collapse: preserve-breaks;">The Fund’s past performance is not a good predictor of the Fund’s future performance.</span> |
| Line Graph [Table Text Block] | |
| Average Annual Return [Table Text Block] | |
| No Deduction of Taxes [Text Block] | The graph and table do not reflect the deduction of taxes that a shareholder would pay on Fund distributions or the redemption or sale of Fund shares. |
| AssetsNet | $ 1,243,853,751 |
| Holdings Count | Holding | 76 |
| Advisory Fees Paid, Amount | $ 2,231,361 |
| InvestmentCompanyPortfolioTurnover | 16.00% |
| Additional Fund Statistics [Text Block] | |
| Holdings [Text Block] |