This table describes the fees and expenses that you may pay if you buy and hold shares of the Fund. In addition to the fees and expenses described below, you may be required to pay a fee to a broker or other financial firm on purchases and sales of Class I shares of the Fund. You may qualify for sales charge discounts if you and your family invest, or agree to invest in the future, at least $50,000 in the Praxis Funds. More information about these and other discounts is available from your financial professional and in the section titled “Sales Charge Reductions” on page 56 of the Fund’s prospectus.
Shareholder Fees - Praxis Impact Bond Fund |
Class A |
Class I |
|---|---|---|
| Maximum sales charge (load) imposed on purchases (as a percentage of offering price) | 3.75% | none |
Annual Fund Operating Expenses - Praxis Impact Bond Fund |
Class A |
Class I |
|---|---|---|
| Management Fees | 0.35% | 0.35% |
| Distribution and Service (12b-1) Fees | 0.25% | none |
| Other Expenses | 0.24% | 0.11% |
| Total Annual Portfolio Operating Expenses | 0.84% | 0.46% |
This Example is intended to help you compare the cost of investing in the Fund with the cost of investing in other mutual funds.
The Example assumes that you invest $10,000 in the Fund for the time period indicated and then redeem all your shares at the end of those periods. The Example also assumes that your investment has a 5 percent return each year and that the Fund’s operating expenses remain the same. Although your actual costs may be higher or lower, based on these assumptions your costs would be:
Expense Example - Praxis Impact Bond Fund - USD ($) |
Expense Example, with Redemption, 1 Year |
Expense Example, with Redemption, 3 Years |
Expense Example, with Redemption, 5 Years |
Expense Example, with Redemption, 10 Years |
|---|---|---|---|---|
| Class A | 458 | 633 | 823 | 1,373 |
| Class I | 47 | 148 | 258 | 579 |
Portfolio Turnover: The Fund pays transaction costs, such as commissions, when it buys and sells securities (or “turns over” its portfolio). A higher portfolio turnover may indicate higher transaction costs and may result in higher taxes when Fund shares are held in a taxable account. These costs, which are not reflected in annual fund operating expenses or in the Example, affect the Fund’s performance. During the most recent fiscal year, the Fund’s portfolio turnover rate was 8.03 percent of the average value of its portfolio.
The Fund invests primarily in fixed income securities. The Fund invests, under normal circumstances, at least 80 percent of its assets in fixed income securities of all types. The Fund seeks to avoid companies that are deemed inconsistent with the Stewardship Investing core values by applying proprietary screens that reflect the Praxis Stewardship Investing core values. In addition, the Fund seeks to place a priority on market-rate, fixed income securities that are expected to have a significant, direct impact on the climate and/or communities around the world. Under normal market conditions the Fund will maintain a dollar-weighted average maturity of three to ten years. The fixed income securities in which the Fund will primarily invest include corporate bonds and notes, U.S. Government agency obligations, mortgage-backed securities and asset-backed securities. Certain securities issued by U.S. Government agencies or government-sponsored enterprises may not be guaranteed by the U.S. Treasury. The Adviser will consider purchasing fixed income securities that provide a competitive rate of return relative to the Bloomberg U.S. Aggregate Bond Index (the “Bloomberg Aggregate Bond Index”). The Adviser will structure the portfolio using the Bloomberg Aggregate Bond Index as a guide in determining sector allocations. The Adviser will seek to underweight and overweight certain sectors, depending on its determination of the relative value, while maintaining overall interest rate exposure similar to the Bloomberg Aggregate Bond Index. The Adviser determines whether to sell an investment based upon its assessment of the relative costs and benefits of continuing to hold an investment versus replacing it with other available investments, in light of the Fund’s investment objective, strategy and the characteristics of the overall portfolio.
|
Praxis Stewardship Investing Core Values
Through various impact strategies, the Fund seeks to support the following core values:
● Respecting the dignity and value of all people
● Building a world at peace and free from violence
● Demonstrating a concern for justice in a global society
● Exhibiting responsible management practices
● Supporting and involving communities
● Practicing environmental stewardship |
Additional information on Praxis’ Stewardship Investing philosophy, core values, screens and other ImpactX strategies can be found in the “Investment Objectives, Principal Investment Strategies and Related Risks” section beginning on page 34 of the Funds’ prospectus.
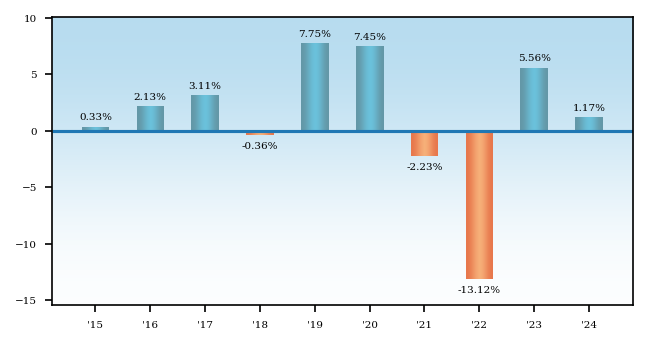
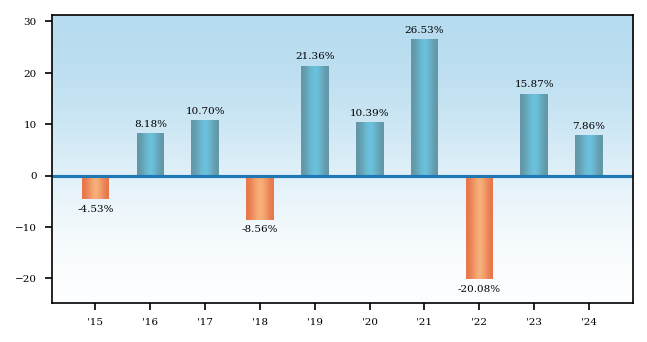
The bar chart and table that follow provide some indication of the risk of an investment in the Fund. The returns assume reinvestment of all dividends and distributions. The bar chart shows how the performance of the Class A shares has varied from year to year for the last 10 years. The returns in the bar chart do not reflect any applicable sales charges. If sales charges were reflected in the bar chart, returns would have been lower. The table shows how the Fund’s average annual total returns for different periods compared to those of a broad-based securities market index.
Please note that the Fund’s past performance, before and after taxes, is not necessarily an indication of how the Fund will perform in the future. Updated performance information is available at www.praxisinvests.com.
After-tax returns, which are calculated using the historical highest individual federal marginal income tax rates and do not reflect the impact of state and local taxes, are shown only for Class A shares and will vary for Class I shares. Actual after-tax returns, which depend on an investor’s particular tax situation, may differ from those shown and are not relevant to investors who hold their Fund shares through tax-deferred arrangements, such as 401(k) plans or individual retirement accounts.
|
|
Quarter Ended |
% |
|
|
|
Quarter Ended |
% |
Average Annual Total Returns - Praxis Impact Bond Fund |
1 Year |
5 Years |
10 Years |
|---|---|---|---|
| Class A | (2.64%) | (1.27%) | 0.62% |
| Class A | After Taxes on Distributions | (3.86%) | (2.18%) | (0.32%) |
| Class A | After Taxes on Distributions and Sales | (1.57%) | (1.32%) | 0.08% |
| Class I | 1.63% | (0.10%) | 1.42% |
| Bloomberg U.S. Aggregate Bond Index (reflects no deduction for fees, expenses or taxes) | 1.25% | (0.33%) | 1.35% |
You cannot invest directly in an index. Unlike mutual funds, an index does not incur expenses. If expenses were deducted, the actual returns of an index would be lower.
Market Risk. The Fund is subject to market risk, which means the value of the Fund’s shares will fluctuate based on market conditions and shareholders could lose money. The value of the Fund’s shares could decline significantly and unexpectedly, based on many factors, including national and international political, economic, regulatory, market or other conditions, as well as global events such as war or other conflict, natural or environmental disasters and infectious disease outbreaks. Events in the financial markets and in the broader economy may cause uncertainty and volatility and may adversely affect Fund performance. Events in one market may impact other markets. Future events may impact the Fund in unforeseen ways. Traditionally liquid investments may experience periods of diminished liquidity. The Fund could underperform other investments. Some of the Fund’s holdings may underperform its other holdings.
Fixed Income Securities Risk. The Fund is also subject to: (1) credit risk, or the chance that the Fund could lose money if the issuer of a security is unable to repay interest and/or principal in a timely manner or at all; (2) interest rate risk, or the chance that the value of the fixed income securities the Fund holds will decline due to rising interest rates; and (3) prepayment risk, or the chance that the principal investments of the Fund will be paid earlier than anticipated due to declining interest rates. In low interest rate environments, risks associated with rising interest rates are heightened. U.S. monetary policy, including changes to Federal Reserve outlooks or programs, may result in periods of significant market volatility and declines in the values of fixed income securities. Those events, as well as structural changes in certain markets for fixed income securities, could reduce market liquidity and increase market volatility, increasing redemptions from the Fund and putting further downward pressure on the Fund’s net asset value, increasing losses.
Government Related Securities Risk. The Fund is also subject to government related securities risk. Government related securities in which the Fund invests include securities issued by government agencies and instrumentalities that are not backed by the U.S. Government and may be supported only by the issuer’s right to borrow from the U.S. Treasury, the credit of the issuing agency or discretionary support from the U.S. government and subject to limits, which may increase risk of loss.
Screening Risk. In addition, application of Praxis Stewardship Investing core value screens may cause the Fund to vary from the performance of its index and other bond funds.
The Praxis International Index Fund seeks capital appreciation.
This table describes the fees and expenses that you may pay if you buy and hold shares of the Fund. In addition to the fees and expenses described below, you may be required to pay a fee to a broker or other financial firm on purchases and sales of Class I shares of the Fund. You may qualify for sales charge discounts if you and your family invest, or agree to invest in the future, at least $50,000 in the Praxis Funds. More information about these and other discounts is available from your financial professional and in the section titled “Sales Charge Reductions” on page 56 of the Fund’s prospectus.
Shareholder Fees - Praxis International Index Fund |
Class A |
Class I |
|---|---|---|
| Maximum sales charge (load) imposed on purchases (as a percentage of offering price) | 5.25% | none |
Annual Fund Operating Expenses - Praxis International Index Fund |
Class A |
Class I |
|---|---|---|
| Management Fees | 0.41% | 0.41% |
| Distribution and Service (12b-1) Fees | 0.25% | none |
| Other Expenses | 0.36% | 0.15% |
| Total Annual Portfolio Operating Expenses | 1.02% | 0.56% |
This Example is intended to help you compare the cost of investing in the Fund with the cost of investing in other mutual funds.
The Example assumes that you invest $10,000 in the Fund for the time period indicated and then redeem all your shares at the end of those periods. The Example also assumes that your investment has a 5 percent return each year and that the Fund’s operating expenses remain the same. Although your actual costs may be higher or lower, based on these assumptions your costs would be:
Expense Example - Praxis International Index Fund - USD ($) |
Expense Example, with Redemption, 1 Year |
Expense Example, with Redemption, 3 Years |
Expense Example, with Redemption, 5 Years |
Expense Example, with Redemption, 10 Years |
|---|---|---|---|---|
| Class A | 624 | 833 | 1,059 | 1,707 |
| Class I | 57 | 179 | 313 | 701 |
Portfolio Turnover: The Fund pays transaction costs, such as commissions, when it buys and sells securities (or “turns over” its portfolio). A higher portfolio turnover may indicate higher transaction costs and may result in higher taxes when Fund shares are held in a taxable account. These costs, which are not reflected in annual fund operating expenses or in the Example, affect the Fund’s performance. During the most recent fiscal year, the Fund’s portfolio turnover rate was 29.01 percent of the average value of its portfolio.
The Fund invests primarily in equity securities of foreign companies organized under the laws of, headquartered in, or whose common equity securities are principally traded in countries outside the United States. The Fund seeks to generate performance that reflects the performance of a broad representation of both foreign developed and emerging equity markets, as measured by the Morningstar® Global ex-US Target Market Exposure NR USD IndexSM, its benchmark index. Under normal circumstances, the Fund invests at least 80 percent of the value of its assets in securities of, and investments related to, issuers in the Fund’s benchmark index. Typically, the Fund invests substantially more than 80 percent of the value of its assets in such securities and investments. Investments related to the benchmark index in which the Fund invests consist of American Depositary Receipts (ADRs), which are equity securities that represent shares of foreign companies in the index. The Fund seeks to invest in companies aligned with the Praxis Stewardship Investing core values. The Adviser does this by applying proprietary screens that reflect the Praxis Stewardship Investing core values. In addition, the Fund’s Sub-Adviser uses proprietary optimization techniques, to select securities according to their contribution to the Fund’s overall objective, while seeking to replicate the characteristics of the index, including risk and return characteristics. The Sub-Adviser determines whether to sell an investment based upon its assessment of the relative costs and benefits of continuing to hold an investment versus replacing it with other available investments, in light of the Fund’s investment objective, strategy and the characteristics of the overall portfolio.
|
Praxis Stewardship Investing Core Values
Through various impact strategies, the Fund seeks to support the following core values:
● Respecting the dignity and value of all people
● Building a world at peace and free from violence
● Demonstrating a concern for justice in a global society
● Exhibiting responsible management practices
● Supporting and involving communities
● Practicing environmental stewardship |
Additional information on Praxis’ Stewardship Investing philosophy, core values, screens and other ImpactX strategies can be found in the “Investment Objectives, Principal Investment Strategies and Related Risks” section beginning on page 34 of the Funds’ prospectus.
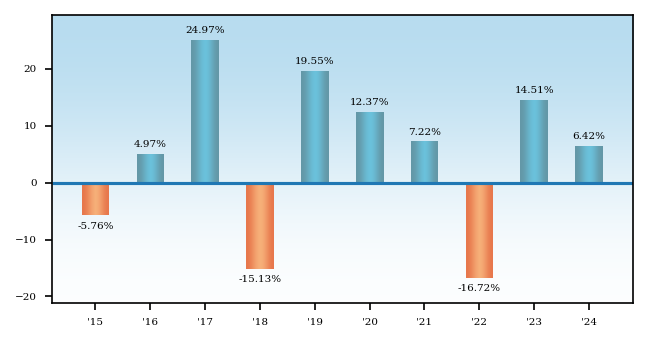
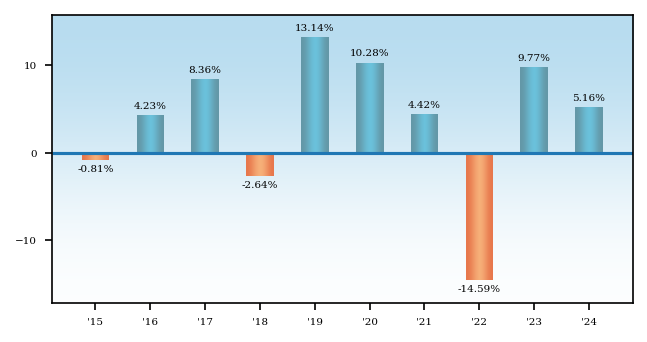
The bar chart and table that follow provide some indication of the risk of an investment in the Fund. The returns assume reinvestment of all dividends and distributions. The bar chart shows how the performance of the Class A shares has varied from year to year for the last ten years. The returns in the bar chart do not reflect any applicable sales charges. If sales charges were reflected in the bar chart, returns would have been lower. The table shows how the Fund’s average annual total returns for different periods compared to those of a broad-based securities market index.
Please note that the Fund’s past performance, before and after taxes, is not necessarily an indication of how the Fund will perform in the future. Updated performance information is available at www.praxisinvests.com.
After-tax returns, which are calculated using the historical highest individual federal marginal income tax rates and do not reflect the impact of state and local taxes, are shown only for Class A shares and will vary for Class I shares. Actual after-tax returns, which depend on an investor’s particular tax situation, may differ from those shown and are not relevant to investors who hold their Fund shares through tax-deferred arrangements, such as 401(k) plans or individual retirement accounts.
|
|
Quarter Ended |
% |
|
|
|
Quarter Ended |
% |
Average Annual Total Returns - Praxis International Index Fund |
1 Year |
5 Years |
10 Years |
|---|---|---|---|
| Class A | 0.86% | 2.98% | 3.81% |
| Class A | After Taxes on Distributions | 0.31% | 2.62% | 3.54% |
| Class A | After Taxes on Distributions and Sales | 0.97% | 2.38% | 3.10% |
| Class I | 6.88% | 4.70% | 4.99% |
| Morningstar® Global ex-US Target Market Exposure NR USD IndexSM (reflects reinvested dividends net of withholding taxes but reflects no deduction for fees, expenses or other taxes) | 5.37% | 4.33% | 4.98% |
You cannot invest directly in an index. Unlike mutual funds, an index does not incur expenses. If expenses were deducted, the actual returns of an index would be lower.
Market Risk. The Fund is subject to market risk, which means the value of the Fund’s shares will fluctuate based on market conditions and shareholders could lose money. The value of the Fund’s shares could decline significantly and unexpectedly, based on many factors, including national and international political, economic, regulatory, market or other conditions, as well as global events such as war or other conflict, natural or environmental disasters and infectious disease outbreaks. Events in the financial markets and in the broader economy may cause uncertainty and volatility and may adversely affect Fund performance. Events in one market may impact other markets. Future events may impact the Fund in unforeseen ways. Traditionally liquid investments may experience periods of diminished liquidity. The Fund could underperform other investments. Some of the Fund’s holdings may underperform its other holdings.
Screening Risk. Application of Praxis Stewardship Investing core value screens may contribute to tracking error.
Foreign Investment Risk. Because the Fund invests primarily in foreign securities, it is subject to foreign investment risks, which are the additional risks presented by foreign and emerging markets investments, such as changes in currency exchange rates, a lack of adequate company information, political instability, and market and economic developments abroad. In addition, markets and economies throughout the world are becoming increasingly interconnected and conditions or events in one market, country or region may adversely impact investments or issuers in another market, country or region.
Index Investing Risk. Because the Fund is designed to track the performance of an index, securities may be purchased, retained or sold at times when a more actively managed fund would not do so. If the value of securities that are heavily weighted in the index decline, you can expect a greater risk of loss than if the Fund had a lower weighting to those securities. In addition, because the Fund uses optimization techniques to construct its portfolio and does not hold all securities in the index, it is subject to optimization risk, which is the risk that the performance of the Fund may vary from the performance of the index due to imperfect correlation between the Fund’s holdings and the index components. This is also known as tracking error. In addition, because the Fund invests in ADRs relating to its benchmark index, which are priced at the close of the U.S. markets, while shares of issuers in the index are priced at the close of the principal foreign market on which they are traded, there is a timing difference that contributes to tracking error.
The Praxis Value Index Fund seeks capital appreciation.
This table describes the fees and expenses that you may pay if you buy and hold shares of the Fund. In addition to the fees and expenses described below, you may be required to pay a fee to a broker or other financial firm on purchases and sales of Class I shares of the Fund. You may qualify for sales charge discounts if you and your family invest, or agree to invest in the future, at least $50,000 in the Praxis Funds. More information about these and other discounts is available from your financial professional and in the section titled “Sales Charge Reductions” on page 56 of the Fund’s prospectus.
Shareholder Fees - Praxis Value Index Fund |
Class A |
Class I |
|---|---|---|
| Maximum sales charge (load) imposed on purchases (as a percentage of offering price) | 5.25% | none |
Annual Fund Operating Expenses - Praxis Value Index Fund |
Class A |
Class I |
|---|---|---|
| Management Fees | 0.24% | 0.24% |
| Distribution and Service (12b-1) Fees | 0.25% | none |
| Other Expenses | 0.19% | 0.14% |
| Total Annual Portfolio Operating Expenses | 0.68% | 0.38% |
This Example is intended to help you compare the cost of investing in the Fund with the cost of investing in other mutual funds.
The Example assumes that you invest $10,000 in the Fund for the time period indicated and then redeem all your shares at the end of those periods. The Example also assumes that your investment has a 5 percent return each year and that the Fund’s operating expenses remain the same. Although your actual costs may be higher or lower, based on these assumptions your costs would be:
Expense Example - Praxis Value Index Fund - USD ($) |
Expense Example, with Redemption, 1 Year |
Expense Example, with Redemption, 3 Years |
Expense Example, with Redemption, 5 Years |
Expense Example, with Redemption, 10 Years |
|---|---|---|---|---|
| Class A | 591 | 731 | 884 | 1,327 |
| Class I | 39 | 122 | 213 | 480 |
Portfolio Turnover: The Fund pays transaction costs, such as commissions, when it buys and sells securities (or “turns over” its portfolio). A higher portfolio turnover may indicate higher transaction costs and may result in higher taxes when Fund shares are held in a taxable account. These costs, which are not reflected in annual fund operating expenses or in the Example, affect the Fund’s performance. During the most recent fiscal year, the Fund’s portfolio turnover rate was 32.18 percent of the average value of its portfolio.
The Fund invests primarily in U.S. equity securities and seeks to reflect the performance of the U.S. large capitalization value equities market, as measured by the CRSP U.S. Large Cap Value Index, its benchmark index. Under normal circumstances, the Fund invests at least 80 percent of the value of its assets in securities of, and investments related to, issuers in the Fund’s benchmark index. Typically, the Fund invests substantially more than 80 percent of the value of its assets in securities of issuers in its benchmark index. The benchmark index consists of those stocks in the CRSP Large Cap Index determined to exhibit the strongest “value” characteristics based on book value to price, earnings to price and sales to price ratios. The Fund seeks to invest in companies aligned with the Praxis Stewardship Investing core values. The Adviser does this by applying proprietary screens that reflect the Praxis Stewardship Investing core values. In addition, the Adviser uses optimization techniques to select securities according to their contribution to the Fund’s overall objective, while seeking to replicate the characteristics of the index, including risk and return characteristics. The Adviser determines whether to sell an investment based upon its assessment of the relative costs and benefits of continuing to hold an investment versus replacing it with other available investments, in light of the Fund’s investment objective, strategy and the characteristics of the overall portfolio.
|
Praxis Stewardship Investing Core Values
Through various impact strategies, the Fund seeks to support the following core values:
● Respecting the dignity and value of all people
● Building a world at peace and free from violence
● Demonstrating a concern for justice in a global society
● Exhibiting responsible management practices
● Supporting and involving communities
● Practicing environmental stewardship |
Additional information on Praxis’ Stewardship Investing philosophy, core values, screens and other ImpactX strategies can be found in the “Investment Objectives, Principal Investment Strategies and Related Risks” section beginning on page 34 of the Funds’ prospectus.
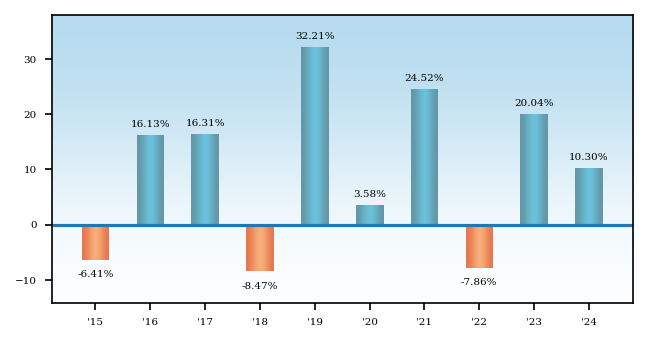
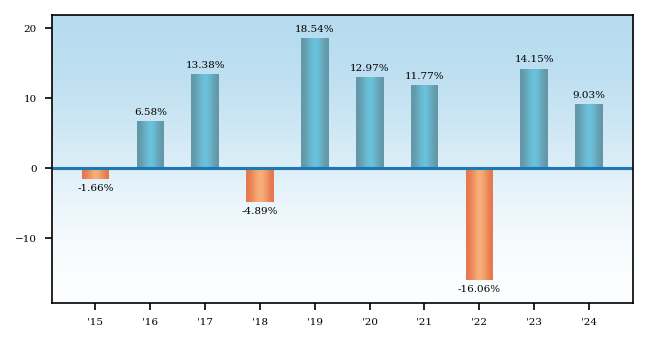
The bar chart and table that follow provide some indication of the risk of an investment in the Fund. The returns assume reinvestment of all dividends and distributions. The bar chart shows how the performance of the Class A shares has varied from year to year for the last 10 years. The returns in the bar chart do not reflect any applicable sales charges. If sales charges were reflected in the bar chart, returns would have been lower. The returns in the table shows how the average annual total returns of the Fund compared with the returns of three indexes. The CRSP U.S. Large Cap Value Index serves as the Fund's performance index because the Adviser believes it is more representative of the Fund's investment strategy. The CRSP U.S. Total Market Index serves as the Fund's regulatory index and provides a broad measure of market performance.
Please note that the Fund’s past performance, before and after taxes, is not necessarily an indication of how the Fund will perform in the future. Updated performance information is available at www.praxisinvests.com.
After-tax returns, which are calculated using the historical highest individual federal marginal income tax rates and do not reflect the impact of state and local taxes, are shown only for Class A shares and will vary for Class I shares. Actual after-tax returns, which depend on an investor’s particular tax situation, may differ from those shown and are not relevant to investors who hold their Fund shares through tax-deferred arrangements, such as 401(k) plans or individual retirement accounts.
|
|
Quarter Ended |
% |
|
|
|
Quarter Ended |
% |
Average Annual Total Returns - Praxis Value Index Fund |
1 Year |
5 Years |
10 Years |
|
|---|---|---|---|---|
| Class A | 4.54% | 8.31% | 8.60% | |
| Class A | After Taxes on Distributions | 2.33% | 6.56% | 7.08% | |
| Class A | After Taxes on Distributions and Sales | 4.24% | 6.13% | 6.53% | |
| Class I | 10.65% | 9.90% | 9.64% | |
| CRSP U.S. Large Cap Value Index (reflects no reduction for fees, expenses or taxes) | [1] | 16.00% | 9.93% | 10.01% |
| S&P 500 Value Index (reflects no deduction for fees, expenses or taxes) | [2] | 12.29% | 10.49% | 10.01% |
| CRSP U.S. Total Market Index (reflects no deductions for fees, expenses or taxes) | 23.77% | 13.81% | 12.50% | |
| [1] | Effective December 23, 2024, the Fund’s performance benchmark index changed from the S&P 500 Value Index to the CRSP U.S. Large Cap Value Index. The Fund believes the new index provides a comparable representation of the large cap value market in which the Fund invests to that of the prior benchmark index. |
| [2] | “S&P 500” is a registered service mark of Standard & Poor’s Corporation, which does not sponsor and is in no way affiliated with the Fund. |
You cannot invest directly in an index. Unlike mutual funds, an index does not incur expenses. If expenses were deducted, the actual returns of an index would be lower.
Market Risk. The Fund is subject to market risk, which means the value of the Fund’s shares will fluctuate based on market conditions and shareholders could lose money. The value of the Fund’s shares could decline significantly and unexpectedly, based on many factors, including national and international political, economic, regulatory, market or other conditions, as well as global events such as war or other conflict, natural or environmental disasters and infectious disease outbreaks. Events in the financial markets and in the broader economy may cause uncertainty and volatility and may adversely affect Fund performance. Events in one market may impact other markets. Future events may impact the Fund in unforeseen ways. Traditionally liquid investments may experience periods of diminished liquidity. The Fund could underperform other investments. Some of the Fund’s holdings may underperform its other holdings.
Screening Risk. Application of Praxis Stewardship Investing core value screens may contribute to tracking error.
Index Investing Risk. Because the Fund is designed to track the performance of an index, securities may be purchased, retained or sold at times when a more actively managed fund would not do so. If the value of securities that are heavily weighted in the index change, you can expect a greater risk of loss than if the Fund had a lower weighting to those securities. In addition, because the Fund uses optimization techniques to construct its portfolio and does not hold all securities in the index, it is subject to optimization risk, which is the risk that the performance of the Fund may vary from the performance of the index due to imperfect correlation between the Fund’s holdings and the index components. This is also known as tracking error.
Investment Style Risk. The Fund is also subject to investment style risk, which is the chance that returns from large capitalization value stocks will trail returns from other asset classes or the overall stock market. Value stocks tend to go through cycles of doing better — or worse — than the stock market in general. In the past, these cycles have occasionally persisted for multiple years.
The Praxis Growth Index Fund seeks capital appreciation.
This table describes the fees and expenses that you may pay if you buy and hold shares of the Fund. In addition to the fees and expenses described below, you may be required to pay a fee to a broker or other financial firm on purchases and sales of Class I shares of the Fund. You may qualify for sales charge discounts if you and your family invest, or agree to invest in the future, at least $50,000 in the Praxis Funds. More information about these and other discounts is available from your financial professional and in the section titled “Sales Charge Reductions” on page 56 of the Fund’s prospectus.
Shareholder Fees - Praxis Growth Index Fund |
Class A |
Class I |
|---|---|---|
| Maximum sales charge (load) imposed on purchases (as a percentage of offering price) | 5.25% | none |
Annual Fund Operating Expenses - Praxis Growth Index Fund |
Class A |
Class I |
|---|---|---|
| Management Fees | 0.23% | 0.23% |
| Distribution and Service (12b-1) Fees | 0.25% | none |
| Other Expenses | 0.15% | 0.12% |
| Total Annual Portfolio Operating Expenses | 0.63% | 0.35% |
This Example is intended to help you compare the cost of investing in the Fund with the cost of investing in other mutual funds.
The Example assumes that you invest $10,000 in the Fund for the time period indicated and then redeem all your shares at the end of those periods. The Example also assumes that your investment has a 5 percent return each year and that the Fund’s operating expenses remain the same. Although your actual costs may be higher or lower, based on these assumptions your costs would be:
Expense Example - Praxis Growth Index Fund - USD ($) |
Expense Example, with Redemption, 1 Year |
Expense Example, with Redemption, 3 Years |
Expense Example, with Redemption, 5 Years |
Expense Example, with Redemption, 10 Years |
|---|---|---|---|---|
| Class A | 586 | 716 | 858 | 1,270 |
| Class I | 36 | 113 | 197 | 443 |
Portfolio Turnover: The Fund pays transaction costs, such as commissions, when it buys and sells securities (or “turns over” its portfolio). A higher portfolio turnover may indicate higher transaction costs and may result in higher taxes when Fund shares are held in a taxable account. These costs, which are not reflected in annual fund operating expenses or in the Example, affect the Fund’s performance. During the most recent fiscal year, the Fund’s portfolio turnover rate was 16.48 percent of the average value of its portfolio.
The Fund invests primarily in U.S. equity securities and seeks to reflect the performance of the U.S. large capitalization growth equities market, as measured by the CRSP U.S. Large Cap Growth Index, its benchmark index. Under normal circumstances, the Fund invests at least 80 percent of the value of its assets in securities of, and investments related to, issuers in the Fund’s benchmark index. Typically, the Fund invests substantially more than 80 percent of the value of its assets in securities of issuers in its benchmark index. The benchmark index consists of those stocks in the CRSP U.S. Large Cap Index determined to exhibit the strongest “growth” characteristics based on sales growth, earnings change to price and momentum ratios. The Fund seeks to invest in companies aligned with the Praxis Stewardship Investing core values. The Adviser does this by applying proprietary screens that reflect the Praxis Stewardship Investing core values. In addition, the Adviser uses optimization techniques to select securities according to their contribution to the Fund’s overall objective, while seeking to replicate the characteristics of the index, including risk and return characteristics. The Adviser determines whether to sell an investment based upon its assessment of the relative costs and benefits of continuing to hold an investment versus replacing it with other available investments, in light of the Fund’s investment objective, strategy and the characteristics of the overall portfolio.
|
Praxis Stewardship Investing Core Values
Through various impact strategies the Fund seeks to support the following core values:
● Respecting the dignity and value of all people
● Building a world at peace and free from violence
● Demonstrating a concern for justice in a global society
● Exhibiting responsible management practices
● Supporting and involving communities
● Practicing environmental stewardship |
Additional information on Praxis’ Stewardship Investing philosophy, core values, screens and other ImpactX strategies can be found in the “Investment Objectives, Principal Investment Strategies and Related Risks” section beginning on page 34 of the Funds’ prospectus.
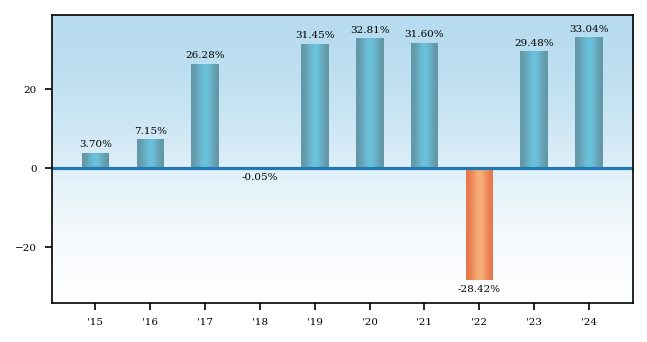
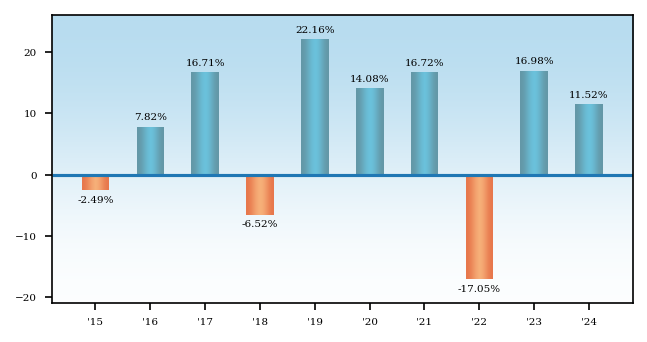
The bar chart and table that follow provide some indication of the risk of an investment in the Fund. The returns assume reinvestment of all dividends and distributions. The bar chart shows how the performance of the Class A shares has varied from year to year for the last 10 years. The returns in the bar chart do not reflect any applicable sales charges. If sales charges were reflected in the bar chart, returns would have been lower. The returns in the table shows how the average annual total returns of the Fund compared with the returns of three indexes. The CRSP U.S. Large Cap Value Index serves as the Fund's performance index because the Adviser believes it is more representative of the Fund's investment strategy. The CRSP U.S. Total Market Index serves as the Fund's regulatory index and provides a broad measure of market performance.
Please note that the Fund’s past performance, before and after taxes, is not necessarily an indication of how the Fund will perform in the future. Updated performance information is available at www.praxisinvests.com.
After-tax returns, which are calculated using the historical highest individual federal marginal income tax rates and do not reflect the impact of state and local taxes, are shown only for Class A shares and will vary for Class I shares. Actual after-tax returns, which depend on an investor’s particular tax situation, may differ from those shown and are not relevant to investors who hold their Fund shares through tax-deferred arrangements, such as 401(k) plans or individual retirement accounts.
|
|
Quarter Ended |
% |
|
|
|
Quarter Ended |
% |
Average Annual Total Returns - Praxis Growth Index Fund |
1 Year |
5 Years |
10 Years |
|
|---|---|---|---|---|
| Class A | 26.05% | 15.35% | 14.17% | |
| Class A | After Taxes on Distributions | 25.65% | 14.25% | 13.21% | |
| Class A | After Taxes on Distributions and Sales | 15.73% | 12.06% | 11.59% | |
| Class I | 33.44% | 16.94% | 15.19% | |
| CRSP U.S. Total Market Index (reflects no deductions for fees, expenses or taxes) | 23.77% | 13.81% | 12.50% | |
| S&P 500 Growth Index (reflects no deductions for fees, expenses or taxes) | [1] | none | none | none |
| CRSP U.S. Large Cap Growth Index (reflects no reduction for fees, expenses or taxes) | [2] | 32.73% | 18.41% | 15.80% |
| [1] | “S&P 500” is a registered service mark of Standard & Poor’s Corporation, which does not sponsor and is in no way affiliated with the Fund. |
| [2] | Effective December 23, 2024, the Fund’s performance benchmark index changed from the S&P 500 Growth Index to the CRSP U.S. Large Cap Growth Index. The Fund believes the new index provides a comparable representation of the large cap growth market in which the Fund invests to that of the prior benchmark index. |
You cannot invest directly in an index. Unlike mutual funds, an index does not incur expenses. If expenses were deducted, the actual returns of an index would be lower.
Market Risk. The Fund is subject to market risk, which means the value of the Fund’s shares will fluctuate based on market conditions and shareholders could lose money. The value of the Fund’s shares could decline significantly and unexpectedly, based on many factors, including national and international political, economic, regulatory, market or other conditions, as well as global events such as war or other conflict, natural or environmental disasters and infectious disease outbreaks. Events in the financial markets and in the broader economy may cause uncertainty and volatility and may adversely affect Fund performance. Events in one market may impact other markets. Future events may impact the Fund in unforeseen ways. Traditionally liquid investments may experience periods of diminished liquidity. The Fund could underperform other investments. Some of the Fund’s holdings may underperform its other holdings.
Screening Risk. Application of Praxis Stewardship Investing core value screens may contribute to tracking error.
Index Investing Risk. Because the Fund is designed to track the performance of an index, securities may be purchased, retained or sold at times when a more actively managed fund would not do so. If the value of securities that are heavily weighted in the index change, you can expect a greater risk of loss than if the Fund had a lower weighting to those securities. In addition, because the Fund uses optimization techniques to construct its portfolio and does not hold all securities in the index, it is subject to optimization risk, which is the risk that the performance of the Fund may vary from the performance of the index due to imperfect correlation between the Fund’s holdings and the index components. This is also known as tracking error.
Investment Style Risk. The Fund is also subject to investment style risk, which is the chance that returns from large capitalization growth stocks will trail returns from other asset classes or the overall stock market. Growth stocks tend to go through cycles of doing better — or worse — than the stock market in general. In the past, these cycles have occasionally persisted for multiple years.
The Praxis Small Cap Index Fund seeks to maximize long-term capital appreciation.
This table describes the fees and expenses that you may pay if you buy and hold shares of the Fund. In addition to the fees and expenses described below, you may be required to pay a fee to a broker or other financial firm on purchases and sales of Class I shares of the Fund. You may qualify for sales charge discounts if you and your family invest, or agree to invest in the future, at least $50,000 in the Praxis Funds. More information about these and other discounts is available from your financial professional and in the section titled “Sales Charge Reductions” on page 56 of the Fund’s prospectus.
Shareholder Fees - Praxis Small Cap Index Fund |
Class A |
Class I |
|---|---|---|
| Maximum sales charge (load) imposed on purchases (as a percentage of offering price) | 5.25% | none |
Annual Fund Operating Expenses - Praxis Small Cap Index Fund |
Class A |
Class I |
|
|---|---|---|---|
| Management Fees | 0.30% | 0.30% | |
| Distribution and Service (12b-1) Fees | 0.25% | none | |
| Other Expenses | 0.48% | 0.14% | |
| Total Annual Portfolio Operating Expenses | [1] | 1.03% | 0.44% |
| [1] | Praxis Investment Management, Inc. (the “Adviser”) has entered into a contractual expense limitation agreement with respect to the Small Cap Index Fund Class A until April 30, 2026. Pursuant to this agreement, the Adviser has agreed to waive fees and/or reimburse expenses to the extent necessary in order to limit the Total Annual Fund Operating Expenses (excluding acquired fund fees and expenses (“AFFE”), brokerage costs, interest, taxes, dividends, Trustees fees and expenses, legal fees and expenses, and extraordinary expenses) of the Fund to 1.10 percent of the Fund’s average daily net assets. The Fund has agreed to repay the Adviser for the amounts waived and/or reimbursed by the Adviser pursuant to this expense limitation agreement provided that such repayment does not cause the Total Annual Fund Operating Expenses (excluding AFFE, brokerage costs, interest, taxes, dividends, Trustees fees and expenses, legal fees and expenses, and extraordinary expenses) to exceed 1.10 percent or any limit in place at the time of recoupment, whichever is lower, and the repayment is made within three years after the time in which the Adviser waived and/or reimbursed the expense. |
This Example is intended to help you compare the cost of investing in the Fund with the cost of investing in other mutual funds.
The Example assumes that you invest $10,000 in the Fund for the time period indicated and then redeem all of your shares at the end of those periods. The Example also assumes that your investment has a 5 percent return each year and that the Fund’s operating expenses remain the same. This example reflects the net operating expenses with fee waiver for the one-year contractual period and the total operating expenses without fee waiver for the remaining periods shown below. Although your actual costs may be higher or lower, based on these assumptions your costs would be:
Expense Example - Praxis Small Cap Index Fund - USD ($) |
Expense Example, with Redemption, 1 Year |
Expense Example, with Redemption, 3 Years |
Expense Example, with Redemption, 5 Years |
Expense Example, with Redemption, 10 Years |
|---|---|---|---|---|
| Class A | 625 | 836 | 1,064 | 1,718 |
| Class I | 45 | 141 | 246 | 555 |
Portfolio Turnover: The Fund pays transaction costs, such as commissions, when it buys and sells securities (or “turns over” its portfolio). A higher portfolio turnover may indicate higher transaction costs and may result in higher taxes when Fund shares are held in a taxable account. These costs, which are not reflected in annual fund operating expenses or in the Example, affect the Fund’s performance. During the most recent fiscal year, the Fund’s portfolio turnover rate was 82.31 percent of the average value of its portfolio.
The Fund invests primarily in U.S. equity securities and seeks to reflect the performance of the U.S. small capitalization equities market, as measured by the CRSP U.S. Small Cap Index, its benchmark index. Under normal circumstances, the Fund invests at least 80 percent of the value of its assets in securities of, and investments related to, issuers in the Fund’s benchmark index. Typically, the Fund invests substantially more than 80 percent of the value of its assets in securities of issuers in its benchmark index. The Fund seeks to invest in companies aligned with the Praxis Stewardship Investing core values The Adviser does this by applying proprietary screens that reflect the Praxis Stewardship Investing core values. In addition, the Adviser uses optimization techniques to select securities according to their contribution to the Fund’s overall objective, while seeking to replicate the characteristics of the index, including risk and return characteristics. The Adviser determines whether to sell an investment based upon its assessment of the relative costs and benefits of continuing to hold an investment versus replacing it with other available investments, in light of the Fund’s investment objective, strategy and the characteristics of the overall portfolio. The Adviser determines whether to sell an investment based upon its assessment of the relative costs and benefits of continuing to hold an investment versus replacing it with other available investments, in light of the Fund’s investment objective, strategy and the characteristics of the overall portfolio.
|
Praxis Stewardship Investing Core Values
Through various impact strategies, the Fund seeks to support the following core values:
● Respecting the dignity and value of all people
● Building a world at peace and free from violence
● Demonstrating a concern for justice in a global society
● Exhibiting responsible management practices
● Supporting and involving communities
● Practicing environmental stewardship |
Additional information on Praxis’ Stewardship Investing philosophy, core values, screens and other ImpactX strategies can be found in the “Investment Objectives, Principal Investment Strategies and Related Risks” section beginning on page 34 of the Funds’ prospectus.
The bar chart and table that follow provide some indication of the risk of an investment in the Fund. The returns assume reinvestment of all dividends and distributions. The bar chart shows how the performance of the Class A shares has varied from year to year for the last 10 years. The returns in the bar chart do not reflect any applicable sales charges. If sales charges were reflected in the bar chart, returns would have been lower. The returns in the table shows how the average annual total returns of the Fund compared with the returns of three indexes. The CRSP U.S. Small Cap Index serves as the Fund's performance index because the Adviser believes it is more representative of the Fund's investment strategy. The CRSP U.S. Total Market Index serves as the Fund's regulatory index and provides a broad measure of market performance.
Please note that the Fund’s past performance, before and after taxes, is not necessarily an indication of how the Fund will perform in the future. Updated performance information is available at www.praxisinvests.com.
After-tax returns, which are calculated using the historical highest individual federal marginal income tax rates and do not reflect the impact of state and local taxes, are shown only for Class A shares and will vary for Class I shares. Actual after-tax returns, which depend on an investor’s particular tax situation, may differ from those shown and are not relevant to investors who hold their Fund shares through tax-deferred arrangements, such as 401(k) plans or individual retirement accounts.
|
|
Quarter Ended |
% |
|
|
|
Quarter Ended |
% |
Average Annual Total Returns - Praxis Small Cap Index Fund |
1 Year |
5 Years |
10 Years |
|
|---|---|---|---|---|
| Class A | 2.23% | 5.74% | 5.30% | |
| Class A | After Taxes on Distributions | 1.99% | 4.89% | 3.57% | |
| Class A | After Taxes on Distributions and Sales | 1.37% | 4.30% | 3.65% | |
| Class I | 8.49% | 7.55% | 6.54% | |
| CRSP U.S. Total Market Index (reflects no deductions for fees, expenses or taxes) | 23.77% | 13.81% | 12.50% | |
| CRSP U.S. Small Cap Index (reflects no reduction for fees, expenses or taxes) | [1] | 14.22% | 9.26% | 9.06% |
| S&P® SmallCap 600 Index (reflects no deductions for fees, expenses or taxes) | [2] | 8.70% | 8.36% | 8.96% |
| [1] | Effective December 23, 2024, the Fund’s performance benchmark index changed from the S&P SmallCap 600 Index to the CRSP U.S. Small Cap Index. The Fund believes the new index provides a comparable representation of the small cap market in which the Fund invests to that of the prior benchmark index. |
| [2] | “S&P 600” is a registered service mark of Standard & Poor’s Corporation, which does not sponsor and is in no way affiliated with the Fund. |
You cannot invest directly in an index. Unlike mutual funds, an index does not incur expenses. If expenses were deducted, the actual returns of an index would be lower.
Market Risk. The Fund is subject to market risk, which means the value of the Fund’s shares will fluctuate based on market conditions and shareholders could lose money. The value of the Fund’s shares could decline significantly and unexpectedly, based on many factors, including national and international political, economic, regulatory, market or other conditions, as well as global events such as war or other conflict, natural or environmental disasters and infectious disease outbreaks. Events in the financial markets and in the broader economy may cause uncertainty and volatility and may adversely affect Fund performance. Events in one market may impact other markets. Future events may impact the Fund in unforeseen ways. Traditionally liquid investments may experience periods of diminished liquidity. The Fund could underperform other investments, and some of the Fund’s holdings may underperform its other holdings.
Screening Risk. Application of Praxis Stewardship Investing core value screens may contribute to tracking error.
Index Investing Risk. Because the Fund is designed to track the performance of an index, securities may be purchased, retained or sold at times when a more actively managed fund would not do so. If the value of securities that are heavily weighted in the index change, you can expect a greater risk of loss than if the Fund had a lower weighting to those securities. In addition, because the Fund uses optimization techniques to construct its portfolio and does not hold all securities in the index, it is subject to optimization risk, which is the risk that the performance of the Fund may vary from the performance of the index due to imperfect correlation between the Fund’s holdings and the index components. This is also known as tracking error.
Small Capitalization Company Risk. The Fund is also subject to small capitalization company risk. Investments in small capitalization companies may be riskier, more volatile and less liquid than investments in larger, more established companies. Small capitalization companies may not have the size, resources or other assets of large capitalization companies, and may be more vulnerable to economic, market and competitive pressures than larger companies.
This table describes the fees and expenses that you may pay if you buy and hold shares of the Portfolio. You may qualify for sales charge discounts if you and your family invest, or agree to invest in the future, at least $50,000 in the Praxis Funds. More information about these and other discounts is available from your financial professional and in the section titled “Sales Charge Reductions” on page 56 of the Portfolio’s prospectus.
Shareholder Fees |
Praxis Genesis Conservative Portfolio
Class A
|
|---|---|
| Maximum sales charge (load) imposed on purchases (as a percentage of offering price) | 5.25% |
Annual Fund Operating Expenses |
Praxis Genesis Conservative Portfolio
Class A
|
|
|---|---|---|
| Management Fees | 0.05% | |
| Distribution and Service (12b-1) Fees | 0.25% | |
| Other Expenses | 0.32% | |
| Acquired Fund Fees and Expenses (AFFE) | 0.46% | [1] |
| Total Annual Portfolio Operating Expenses | 1.08% | |
| [1] | AFFE are not reflected in the Financial Highlights or audited financial statements. |
This Example is intended to help you compare the cost of investing in the Portfolio with the cost of investing in other mutual funds.
The Example assumes that you invest $10,000 in the Portfolio for the time period indicated and then redeem all your shares at the end of those periods. The Example also assumes that your investment has a 5 percent return each year and that the Portfolio’s operating expenses remain the same. This example reflects the net operating expenses with fee waiver for the one-year contractual period and the total operating expenses without fee waiver for the remaining periods shown below. Although your actual costs may be higher or lower, based on these assumptions your costs would be:
Expense Example |
Expense Example, with Redemption, 1 Year |
Expense Example, with Redemption, 3 Years |
Expense Example, with Redemption, 5 Years |
Expense Example, with Redemption, 10 Years |
|---|---|---|---|---|
| Praxis Genesis Conservative Portfolio | Class A | USD ($) | 629 | 850 | 1,089 | 1,773 |
Portfolio Turnover: The Portfolio pays transaction costs, such as commissions, when it buys and sells securities (or “turns over” its portfolio). A higher portfolio turnover may indicate higher transaction costs and may result in higher taxes when Portfolio shares are held in a taxable account. These costs, which are not reflected in annual fund operating expenses or in the Example, affect the Portfolio’s performance. During the most recent fiscal year, the Portfolio’s portfolio turnover rate was 12.40 percent of the average value of its portfolio.
The Portfolio, a fund of funds, seeks to achieve its investment objective by investing primarily in Class I shares of underlying Praxis Funds.
The Portfolio typically invests approximately 60 - 80 percent of its total assets in bond funds and 20 - 40 percent of its total assets in equity funds. In selecting underlying funds, the Adviser analyzes many factors, including the underlying funds’ investment objectives, total return, and volatility. The Portfolio may also invest in other mutual funds or exchange traded funds (“ETFs”) to gain exposure to unique investment characteristics not available in the underlying Praxis Funds and whose screening criteria may differ from the Praxis Stewardship Investing core value screens used by the Praxis Funds. Investments in these non-Praxis Funds and ETFs will not exceed 10 percent of the value of the Portfolio’s total assets. The Portfolio may hold a minimal amount of cash or cash equivalent positions, such as money market instruments, U.S. Government securities, commercial paper, and repurchase agreements.
The above asset allocation ranges are targets. The Adviser has discretion to reallocate the Portfolio’s assets among the allowable investments described above. As a result of market gains or losses, the percentage of the Portfolio’s assets invested in bond funds and equity funds at any given time may be different from the asset allocation target ranges shown above. The Adviser expects to rebalance the Portfolio’s assets annually in accordance with the asset allocation model then in effect but reserves the right to rebalance more or less frequently as it deems appropriate, depending on market conditions, investment performance, and other factors. The Portfolio seeks to avoid investments that are deemed inconsistent with the Praxis Stewardship Investing core values, as discussed below.
|
Praxis Stewardship Investing Core Values
Through various impact strategies, the Fund seeks to support the following core values:
● Respecting the dignity and value of all people
● Building a world at peace and free from violence
● Demonstrating a concern for justice in a global society
● Exhibiting responsible management practices
● Supporting and involving communities
● Practicing environmental stewardship |
Additional information on Praxis’ Stewardship Investing philosophy, core values, screens and other ImpactX strategies can be found in the “Investment Objectives, Principal Investment Strategies and Related Risks” section beginning on page 34 of the Funds’ prospectus.
The bar chart and table that follow provide some indication of the risk of an investment in the Fund. The returns assume reinvestment of all dividends and distributions. The bar chart shows how the performance of the Class A shares has varied from year to year for the last 10 years. The returns in the bar chart do not reflect any applicable sales charges. If sales charges were reflected in the bar chart, returns would have been lower. The returns in the table shows how the average annual total returns of the Fund compared with the returns of three indexes. The S&P Target Risk Conservative Index serves as the Fund's performance index because the Adviser believes it is more representative of the Fund's investment strategy. The Bloomberg U.S. Aggregate Bond Index and the CRSP U.S. Total Market Index each serve as the Fund's regulatory index and provides a broad measure of market performance.
Please note that the Portfolio’s past performance, before and after taxes, is not necessarily an indication of how the Portfolio will perform in the future. Updated performance information is available at www.praxisinvests.com.
After-tax returns are calculated using the historical highest individual federal marginal income tax rates and do not reflect the impact of state and local taxes. Actual after- tax returns, which depend on an investor’s particular tax situation, may differ from those shown and are not relevant to investors who hold their Portfolio shares through tax-deferred arrangements, such as 401(k) plans or individual retirement accounts.
|
|
Quarter Ended |
% |
|
|
|
Quarter Ended |
% |
Average Annual Total Returns - Praxis Genesis Conservative Portfolio |
1 Year |
5 Years |
10 Years |
|---|---|---|---|
| Class A | (0.39%) | 1.47% | 2.87% |
| Class A | After Taxes on Distributions | (1.83%) | 0.39% | 1.88% |
| Class A | After Taxes on Distributions and Sales | 0.25% | 0.85% | 1.93% |
| Bloomberg U.S. Aggregate Bond Index (reflects no deduction for fees, expenses or taxes) | 1.25% | (0.33%) | 1.35% |
| CRSP U.S. Total Market Index (reflects no deductions for fees, expenses or taxes) | 23.77% | 13.81% | 12.50% |
| S&P Target Risk Conservative Index (reflects no deductions for fees, expenses or taxes) | 6.59% | 3.21% | 4.02% |
Market Risk. Because the value of the Portfolio’s assets will fluctuate with market conditions and interest rates, so will the value of your investment in the Portfolio. You could lose money on your investment in the Portfolio, or the Portfolio could underperform other investments. Some of the Portfolio’s holdings may underperform its other holdings.
Asset Allocation Risk. The Portfolio is subject to asset allocation risk, which is the possibility that the selection by the Adviser of underlying funds and the allocation of Portfolio assets to those funds will cause the Portfolio to underperform.
Underlying Funds Risk. In addition, the Portfolio is subject to the risks associated with the underlying Praxis Funds in which it invests. The application of the underlying Funds’ socially responsible investment criteria may affect the underlying Funds’ exposure to certain sectors or types of investments and may impact the Portfolio’s relative investment performance depending on whether such sectors or investments are in or out of favor with the market. To the extent the Portfolio is invested in equity funds, it is susceptible to risks typically associated with equity investing, including that the stock market may decline in value and individual stocks held by the underlying funds may not perform as expected. To the extent the Portfolio is invested in bond funds, it is susceptible to risks typically associated with bond investing, including interest rate risk, or the chance that the value of the fixed-income securities the underlying funds hold will decline due to rising interest rates. The value of the Portfolio’s shares could decline significantly and unexpectedly based upon many factors, including national and international political, economic, regulatory, market or other conditions, as well as global events such as war or other conflict, natural or environmental disasters and infectious disease outbreaks. Events in the financial markets and in the broader economy may cause uncertainty and volatility and may adversely affect Portfolio performance. Events in one market may impact other markets. Future events may impact the Portfolio in unforeseen ways. Traditionally liquid investments may experience periods of diminished liquidity. The Portfolio could underperform other investments. Some of the Portfolio’s holdings may underperform its other holdings.
This table describes the fees and expenses that you may pay if you buy and hold shares of the Portfolio. You may qualify for sales charge discounts if you and your family invest, or agree to invest in the future, at least $50,000 in the Praxis Funds. More information about these and other discounts is available from your financial professional and in the section titled “Sales Charge Reductions” on page 56 of the Portfolio’s prospectus.
Shareholder Fees |
Praxis Genesis Balanced Portfolio
Class A
|
|---|---|
| Maximum sales charge (load) imposed on purchases (as a percentage of offering price) | 5.25% |
Annual Fund Operating Expenses |
Praxis Genesis Balanced Portfolio
Class A
|
|
|---|---|---|
| Management Fees | 0.05% | |
| Distribution and Service (12b-1) Fees | 0.25% | |
| Other Expenses | 0.16% | |
| Acquired Fund Fees and Expenses (AFFE) | 0.45% | [1] |
| Total Annual Portfolio Operating Expenses | 0.91% | |
| [1] | AFFE are not reflected in the Financial Highlights or audited financial statements. |
This Example is intended to help you compare the cost of investing in the Portfolio with the cost of investing in other mutual funds.
The Example assumes that you invest $10,000 in the Portfolio for the time period indicated and then redeem all of your shares at the end of those periods. The Example also assumes that your investment has a 5 percent return each year and that the Portfolio’s operating expenses remain the same. Although your actual costs may be higher or lower, based on these assumptions your costs would be:
Expense Example |
Expense Example, with Redemption, 1 Year |
Expense Example, with Redemption, 3 Years |
Expense Example, with Redemption, 5 Years |
Expense Example, with Redemption, 10 Years |
|---|---|---|---|---|
| Praxis Genesis Balanced Portfolio | Class A | USD ($) | 613 | 800 | 1,002 | 1,586 |
Portfolio Turnover: The Portfolio pays transaction costs, such as commissions, when it buys and sells securities (or “turns over” its portfolio). A higher portfolio turnover may indicate higher transaction costs and may result in higher taxes when Portfolio shares are held in a taxable account. These costs, which are not reflected in annual fund operating expenses or in the Example, affect the Portfolio’s performance. During the most recent fiscal year, the Portfolio’s portfolio turnover rate was 13.43 percent of the average value of its portfolio.
The Portfolio, a fund of funds, seeks to achieve its investment objective by investing primarily in Class I shares of underlying Praxis Funds.
The Portfolio typically invests approximately 30 - 50 percent of its total assets in bond funds and 50 - 70 percent of its total assets in equity funds. In selecting underlying funds, the Adviser analyzes many factors, including the underlying funds’ investment objectives, total return, and volatility. The Portfolio may also invest in other mutual funds or exchange traded funds (“ETFs”) to gain exposure to unique investment characteristics not available in the underlying Praxis Funds and whose screening criteria may differ from the Praxis Stewardship Investing core value screens used by the Praxis Funds. Investments in these non-Praxis Funds and ETFs will not exceed 10 percent of the value of the Portfolio’s total assets. The Portfolio may hold a minimal amount of cash or cash equivalent positions, such as money market instruments, U.S. Government securities, commercial paper, and repurchase agreements.
The above asset allocation ranges are targets. The Adviser has discretion to reallocate the Portfolio’s assets among the allowable investments described above. As a result of market gains or losses, the percentage of the Portfolio’s assets invested in bond funds and equity funds at any given time may be different from the asset allocation target ranges shown above. The Adviser expects to rebalance the Portfolio’s assets annually in accordance with the asset allocation model then in effect but reserves the right to rebalance more or less frequently as it deems appropriate, depending on market conditions, investment performance, and other factors. The Portfolio seeks to avoid investments that are deemed inconsistent with the Praxis Stewardship Investing core values, as discussed below.
|
Praxis Stewardship Investing Core Values
Through various impact strategies, the Fund seeks to support the following core values:
● Respecting the dignity and value of all people
● Building a world at peace and free from violence
● Demonstrating a concern for justice in a global society
● Exhibiting responsible management practices
● Supporting and involving communities
● Practicing environmental stewardship |
Additional information on Praxis’ Stewardship Investing philosophy, core values, screens and other ImpactX strategies can be found in the “Investment Objectives, Principal Investment Strategies and Related Risks” section beginning on page 34 of the Funds’ prospectus.
The bar chart and table that follow provide some indication of the risk of an investment in the Fund. The returns assume reinvestment of all dividends and distributions. The bar chart shows how the performance of the Class A shares has varied from year to year for the last 10 years. The returns in the bar chart do not reflect any applicable sales charges. If sales charges were reflected in the bar chart, returns would have been lower. The returns in the table shows how the average annual total returns of the Fund compared with the returns of three indexes. The S&P Target Risk Balanced Index TR (USD) serves as the Fund's performance index because the Adviser believes it is more representative of the Fund's investment strategy. The Bloomberg U.S. Aggregate Bond Index and the CRSP U.S. Total Market Index each serve as the Fund's regulatory index and provides a broad measure of market performance.
Please note that the Portfolio’s past performance, before and after taxes, is not necessarily an indication of how the Portfolio will perform in the future. Updated performance information is available at www.praxisinvests.com.
After-tax returns are calculated using the historical highest individual federal marginal income tax rates and do not reflect the impact of state and local taxes. Actual after- tax returns, which depend on an investor’s particular tax situation, may differ from those shown and are not relevant to investors who hold their Portfolio shares through tax-deferred arrangements, such as 401(k) plans or individual retirement accounts.
|
|
Quarter Ended |
% |
|
|
|
Quarter Ended |
% |
Average Annual Total Returns - Praxis Genesis Balanced Portfolio |
1 Year |
5 Years |
10 Years |
|---|---|---|---|
| Class A | 3.32% | 4.56% | 5.28% |
| Class A | After Taxes on Distributions | 2.09% | 3.43% | 4.21% |
| Class A | After Taxes on Distributions and Sales | 2.48% | 3.31% | 3.91% |
| Bloomberg U.S. Aggregate Bond Index (reflects no deduction for fees, expenses or taxes) | 1.25% | (0.33%) | 1.35% |
| CRSP U.S. Total Market Index (reflects no deductions for fees, expenses or taxes) | 23.77% | 13.81% | 12.50% |
| S&P Target Risk Balanced Index TR (USD) (reflects no deductions for fees, expenses or taxes) | 10.73% | 6.16% | 6.39% |
Market Risk. Because the value of the Portfolio’s assets will fluctuate with market conditions and interest rates, so will the value of your investment in the Portfolio. You could lose money on your investment in the Portfolio, or the Portfolio could underperform other investments. Some of the Portfolio’s holdings may underperform its other holdings.
Asset Allocation Risk. The Portfolio is subject to asset allocation risk, which is the possibility that the selection by the Adviser of underlying funds and the allocation of Portfolio assets to those funds will cause the Portfolio to underperform.
Underlying Funds Risk. In addition, the Portfolio is subject to the risks associated with the underlying Praxis Funds in which it invests. The application of the underlying Funds’ socially responsible investment criteria may affect the underlying Funds’ exposure to certain sectors or types of investments and may impact the Portfolio’s relative investment performance depending on whether such sectors or investments are in or out of favor with the market. To the extent the Portfolio is invested in equity funds, it is susceptible to risks typically associated with equity investing, including that the stock market may decline in value and individual stocks held by the underlying funds may not perform as expected, and to the extent the Portfolio is invested in bond funds, it is susceptible to risks typically associated with bond investing, including interest rate risk, or the chance that the value of the fixed-income securities the underlying funds hold will decline due to rising interest rates. The value of the Portfolio’s shares could decline significantly and unexpectedly based upon many factors, including national and international political, economic, regulatory, market or other conditions, as well as global events such as war or other conflict, natural or environmental disasters and infectious disease outbreaks. Events in the financial markets and in the broader economy may cause uncertainty and volatility and may adversely affect Portfolio performance. Events in one market may impact other markets. Future events may impact the Portfolio in unforeseen ways. Traditionally liquid investments may experience periods of diminished liquidity. The Portfolio could underperform other investments. Some of the Portfolio’s holdings may underperform its other holdings.
This table describes the fees and expenses that you may pay if you buy and hold shares of the Portfolio. You may qualify for sales charge discounts if you and your family invest, or agree to invest in the future, at least $50,000 in the Praxis Funds. More information about these and other discounts is available from your financial professional and in the section titled “Sales Charge Reductions” on page 56 of the Portfolio’s prospectus.
Shareholder Fees |
Praxis Genesis Growth Portfolio
Class A
|
|---|---|
| Maximum sales charge (load) imposed on purchases (as a percentage of offering price) | 5.25% |
Annual Fund Operating Expenses |
Praxis Genesis Growth Portfolio
Class A
|
|
|---|---|---|
| Management Fees | 0.05% | |
| Distribution and Service (12b-1) Fees | 0.25% | |
| Other Expenses | 0.18% | |
| Acquired Fund Fees and Expenses (AFFE) | 0.44% | [1] |
| Total Annual Portfolio Operating Expenses | 0.92% | |
| [1] | AFFE are not reflected in the Financial Highlights or audited financial statements. |
This Example is intended to help you compare the cost of investing in the Portfolio with the cost of investing in other mutual funds.
The Example assumes that you invest $10,000 in the Portfolio for the time period indicated and then redeem all your shares at the end of those periods. The Example also assumes that your investment has a 5 percent return each year and that the Portfolio’s operating expenses remain the same. Although your actual costs may be higher or lower, based on these assumptions your costs would be:
Expense Example |
Expense Example, with Redemption, 1 Year |
Expense Example, with Redemption, 3 Years |
Expense Example, with Redemption, 5 Years |
Expense Example, with Redemption, 10 Years |
|---|---|---|---|---|
| Praxis Genesis Growth Portfolio | Class A | USD ($) | 614 | 803 | 1,008 | 1,597 |
Portfolio Turnover: The Portfolio pays transaction costs, such as commissions, when it buys and sells securities (or “turns over” its portfolio). A higher portfolio turnover may indicate higher transaction costs and may result in higher taxes when Portfolio shares are held in a taxable account. These costs, which are not reflected in annual fund operating expenses or in the Example, affect the Portfolio’s performance. During the most recent fiscal year, the Portfolio’s portfolio turnover rate was 12.86 percent of the average value of its portfolio.
The Portfolio, a fund of funds, seeks to achieve its investment objective by investing primarily in Class I shares of underlying Praxis Funds.
The Portfolio typically invests approximately 10 - 30 percent of its total assets in bond funds and 70 - 90 percent of its total assets in equity funds. In selecting underlying funds, the Adviser analyzes many factors, including the underlying funds’ investment objectives, total return, and volatility. The Portfolio may also invest in other mutual funds or exchange traded funds (“ETFs”) to gain exposure to unique investment characteristics not available in the underlying Praxis Funds and whose screening criteria may differ from the Praxis Stewardship Investing core value screens used by the Praxis Funds. Investments in these non-Praxis Funds and ETFs will not exceed 10 percent of the value of the Portfolio’s total assets. The Portfolio may hold a minimal amount of cash or cash equivalent positions, such as money market instruments, U.S. Government securities, commercial paper, and repurchase agreements.
The above asset allocation ranges are targets. The Adviser has discretion to reallocate the Portfolio’s assets among the allowable investments described above. As a result of market gains or losses, the percentage of the Portfolio’s assets invested in bond funds and equity funds at any given time may be different from the asset allocation target ranges shown above. The Adviser expects to rebalance the Portfolio’s assets annually in accordance with the asset allocation model then in effect but reserves the right to rebalance more or less frequently as it deems appropriate, depending on market conditions, investment performance, and other factors. The Portfolio seeks to avoid investments that are deemed inconsistent with the Praxis Stewardship Investing core values, as discussed below.
|
Praxis Stewardship Investing Core Values
Through various impact strategies, the Fund seeks to support the following core values:
● Respecting the dignity and value of all people
● Building a world at peace and free from violence
● Demonstrating a concern for justice in a global society
● Exhibiting responsible management practices
● Supporting and involving communities
● Practicing environmental stewardship |
Additional information on Praxis’ Stewardship Investing philosophy, core values, screens and other ImpactX strategies can be found in the “Investment Objectives, Principal Investment Strategies and Related Risks” section beginning on page 34 of the Funds’ prospectus.
The bar chart and table that follow provide some indication of the risk of an investment in the Fund. The returns assume reinvestment of all dividends and distributions. The bar chart shows how the performance of the Class A shares has varied from year to year for the last 10 years. The returns in the bar chart do not reflect any applicable sales charges. If sales charges were reflected in the bar chart, returns would have been lower. The returns in the table shows how the average annual total returns of the Fund compared with the returns of three indexes. The S&P Target Risk Aggressive Index serves as the Fund's performance index because the Adviser believes it is more representative of the Fund's investment strategy. The Bloomberg U.S. Aggregate Bond Index and the CRSP U.S. Total Market Index each serve as the Fund's regulatory index and provides a broad measure of market performance.
Please note that the Portfolio’s past performance, before and after taxes, is not necessarily an indication of how the Portfolio will perform in the future. Updated performance information is available at www.praxisinvests.com.
After-tax returns are calculated using the historical highest individual federal marginal income tax rates and do not reflect the impact of state and local taxes. Actual after- tax returns, which depend on an investor’s particular tax situation, may differ from those shown and are not relevant to investors who hold their Portfolio shares through tax-deferred arrangements, such as 401(k) plans or individual retirement accounts.
|
|
Quarter Ended |
% |
|
|
|
Quarter Ended |
% |
Average Annual Total Returns - Praxis Genesis Growth Portfolio |
1 Year |
5 Years |
10 Years |
|---|---|---|---|
| Class A | 5.64% | 6.43% | 6.70% |
| Class A | After Taxes on Distributions | 4.76% | 5.44% | 5.69% |
| Class A | After Taxes on Distributions and Sales | 3.86% | 4.85% | 5.14% |
| Bloomberg U.S. Aggregate Bond Index (reflects no deduction for fees, expenses or taxes) | 1.25% | (0.33%) | 1.35% |
| CRSP U.S. Total Market Index (reflects no deductions for fees, expenses or taxes) | 23.77% | 13.81% | 12.50% |
| S&P Target Risk Aggressive Index (reflects no deductions for fees, expenses or taxes) | 13.49% | 8.06% | 7.92% |
Market Risk. Because the value of the Portfolio’s assets will fluctuate with market conditions and interest rates, so will the value of your investment in the Portfolio. You could lose money on your investment in the Portfolio, or the Portfolio could underperform other investments. Some of the Portfolio’s holdings may underperform its other holdings.
Asset Allocation Risk. The Portfolio is subject to asset allocation risk, which is the possibility that the selection by the Adviser of underlying funds and the allocation of Portfolio assets to those funds will cause the Portfolio to underperform.
Underlying Funds Risk. In addition, the Portfolio is subject to the risks associated with the underlying Praxis Funds in which it invests. The application of the underlying Funds’ socially responsible investment criteria may affect the underlying Funds’ exposure to certain sectors or types of investments and may impact the Portfolio’s relative investment performance depending on whether such sectors or investments are in or out of favor with the market. To the extent the Portfolio is invested in equity funds, it is susceptible to risks typically associated with equity investing, including that the stock market may decline in value and individual stocks held by the underlying funds may not perform as expected. To the extent the Portfolio is invested in bond funds, it is susceptible to risks typically associated with bond investing, including interest rate risk, or the chance that the value of the fixed-income securities the underlying funds hold will decline due to rising interest rates. The value of the Portfolio’s shares could decline significantly and unexpectedly based upon many factors, including national and international political, economic, regulatory, market or other conditions, as well as global events such as war or other conflict, natural or environmental disasters and infectious disease outbreaks. Events in the financial markets and in the broader economy may cause uncertainty and volatility and may adversely affect Portfolio performance. Events in one market may impact other markets. Future events may impact the Portfolio in unforeseen ways. Traditionally liquid investments may experience periods of diminished liquidity. The Portfolio could underperform other investments. Some of the Portfolio’s holdings may underperform its other holdings.