Performance Management
|
Apr. 30, 2025 |
| GABELLI GLOBAL CONTENT & CONNECTIVITY FUND |
|
| Prospectus [Line Items] |
|
| Bar Chart and Performance Table [Heading] |
Performance
|
| Performance Narrative [Text Block] |
The bar chart and table that follow provide an indication of the risks of investing in the Global Content & Connectivity Fund by showing changes in the Global Content & Connectivity Fund’s performance from year to year and by showing how the Global Content & Connectivity Fund’s average annual returns for one year, five years, and ten years compared with those of broad based securities market indices. As with all mutual funds, the Global Content & Connectivity Fund’s past performance (before and after taxes) does not predict how the Global Content & Connectivity Fund will perform in the future. Updated information on the Global Content & Connectivity Fund’s results can be obtained by visiting www.gabelli.com.
|
| Performance Past Does Not Indicate Future [Text] |
As with all mutual funds, the Global Content & Connectivity Fund’s past performance (before and after taxes) does not predict how the Global Content & Connectivity Fund will perform in the future.
|
| Performance Information Illustrates Variability of Returns [Text] |
The bar chart and table that follow provide an indication of the risks of investing in the Global Content & Connectivity Fund by showing changes in the Global Content & Connectivity Fund’s performance from year to year and by showing how the Global Content & Connectivity Fund’s average annual returns for one year, five years, and ten years compared with those of broad based securities market indices.
|
| Bar Chart [Heading] |
GLOBAL CONTENT & CONNECTIVITY FUND
(Total Returns for Class AAA Shares for the Years Ended December 31)
|
| Bar Chart [Table] |

| Years |
Returns |
| 2015 |
-2.48% |
| 2016 |
2.65% |
| 2017 |
13.38% |
| 2018 |
-11.89% |
| 2019 |
15.62% |
| 2020 |
16.42% |
| 2021 |
5.17% |
| 2022 |
-28.62% |
| 2023 |
22.89% |
| 2024 |
22.35% |
|
| Bar Chart Closing [Text Block] |
During the calendar years shown in the bar chart, the highest return for a quarter was 19.01% (quarter ended June 30, 2020), and the lowest return for a quarter was (21.79)% (quarter ended March 31, 2020).
|
| Performance Table Heading |
Average Annual Total Returns (for the years ended December 31, 2024 with maximum sales charge, if applicable)
|
| Performance Table Uses Highest Federal Rate |
After-tax returns are calculated using the historical highest individual federal marginal income tax rates and do not reflect the impact of state and local taxes.
|
| Performance Table Not Relevant to Tax Deferred |
After-tax returns shown are not relevant to investors who hold their Fund shares through tax deferred arrangements, such as 401(k) plans or individual retirement accounts, including Roth IRAs and SEP IRAs (collectively, “IRAs”).
|
| Performance Table Explanation after Tax Higher |
In some instances, the “Return After Taxes on Distributions and Sale of Fund Shares” may be greater than the “Return After Taxes on Distributions” because the investor is assumed to be able to use the capital loss from the sale of Fund shares to offset other taxable gains.
|
| Performance [Table] |
Average Annual Total Returns
(for the years ended December 31, 2024
with maximum sales charge, if applicable) |
|
Past
One Year |
|
|
Past
Five Years |
|
|
Past
Ten Years |
|
| Global Content & Connectivity Fund Class AAA Shares: |
|
|
|
|
|
|
|
|
|
|
|
|
|
|
|
|
|
|
| Return Before Taxes |
|
|
|
22.35 |
% |
|
|
|
|
5.61 |
% |
|
|
|
|
4.27 |
% |
|
| Return After Taxes on Distributions |
|
|
|
20.57 |
% |
|
|
|
|
4.64 |
% |
|
|
|
|
3.03 |
% |
|
| Return After Taxes on Distributions and Sale of Fund Shares |
|
|
|
14.18 |
% |
|
|
|
|
4.22 |
% |
|
|
|
|
3.14 |
% |
|
| Class A Shares Return Before Taxes |
|
|
|
15.24 |
% |
|
|
|
|
4.36 |
% |
|
|
|
|
3.64 |
% |
|
| Class I Shares Return Before Taxes |
|
|
|
22.30 |
% |
|
|
|
|
5.61 |
% |
|
|
|
|
4.55 |
% |
|
MSCI AC World Communication Services Index
(reflects no deduction for fees, expenses, or taxes) |
|
|
|
31.95 |
% |
|
|
|
|
10.14 |
% |
|
|
|
|
7.53 |
% |
|
MSCI AC World Index
(reflects no deduction for fees, expenses, or taxes) |
|
|
|
18.02 |
% |
|
|
|
|
10.58 |
% |
|
|
|
|
9.79 |
% |
|
|
| Performance Table One Class of after Tax Shown [Text] |
After-tax returns are shown only for Class AAA shares. Actual after-tax returns for other classes will vary due to the differences in expenses.
|
| Performance Table Closing [Text Block] |
After-tax returns are calculated using the historical highest individual federal marginal income tax rates and do not reflect the impact of state and local taxes. In some instances, the “Return After Taxes on Distributions and Sale of Fund Shares” may be greater than the “Return After Taxes on Distributions” because the investor is assumed to be able to use the capital loss from the sale of Fund shares to offset other taxable gains. Actual after-tax returns depend on an investor’s tax situation and may differ from those shown. After-tax returns shown are not relevant to investors who hold their Fund shares through tax deferred arrangements, such as 401(k) plans or individual retirement accounts, including Roth IRAs and SEP IRAs (collectively, “IRAs”). After-tax returns are shown only for Class AAA shares. Actual after-tax returns for other classes will vary due to the differences in expenses.
|
| Performance Availability Website Address [Text] |
www.gabelli.com
|
| GABELLI GLOBAL CONTENT & CONNECTIVITY FUND | GABELLI GLOBAL CONTENT & CONNECTIVITY FUND CLASS AAA |
|
| Prospectus [Line Items] |
|
| Highest Quarterly Return, Label [Optional Text] |
highest return for a quarter
|
| Highest Quarterly Return |
19.01%
|
| Highest Quarterly Return, Date |
Jun. 30, 2020
|
| Lowest Quarterly Return, Label [Optional Text] |
lowest return for a quarter
|
| Lowest Quarterly Return |
(21.79%)
|
| Lowest Quarterly Return, Date |
Mar. 31, 2020
|
| The Gabelli Global Growth Fund |
|
| Prospectus [Line Items] |
|
| Bar Chart and Performance Table [Heading] |
Performance
|
| Performance Narrative [Text Block] |
The bar chart and table that follow provide an indication of the risks of investing in the Global Growth Fund by showing changes in the Global Growth Fund’s performance from year to year and by showing how the Global Growth Fund’s average annual returns for one year, five years, and ten years compared with those of a broad based securities market index and with the returns of an index of funds with similar investment objectives. As with all mutual funds, the Global Growth Fund’s past performance (before and after taxes) does not predict how the Global Growth Fund will perform in the future. Updated information on the Global Growth Fund’s results can be obtained by visiting www.gabelli.com.
|
| Performance Past Does Not Indicate Future [Text] |
As with all mutual funds, the Global Growth Fund’s past performance (before and after taxes) does not predict how the Global Growth Fund will perform in the future.
|
| Performance Information Illustrates Variability of Returns [Text] |
The bar chart and table that follow provide an indication of the risks of investing in the Global Growth Fund by showing changes in the Global Growth Fund’s performance from year to year and by showing how the Global Growth Fund’s average annual returns for one year, five years, and ten years compared with those of a broad based securities market index and with the returns of an index of funds with similar investment objectives.
|
| Bar Chart [Heading] |
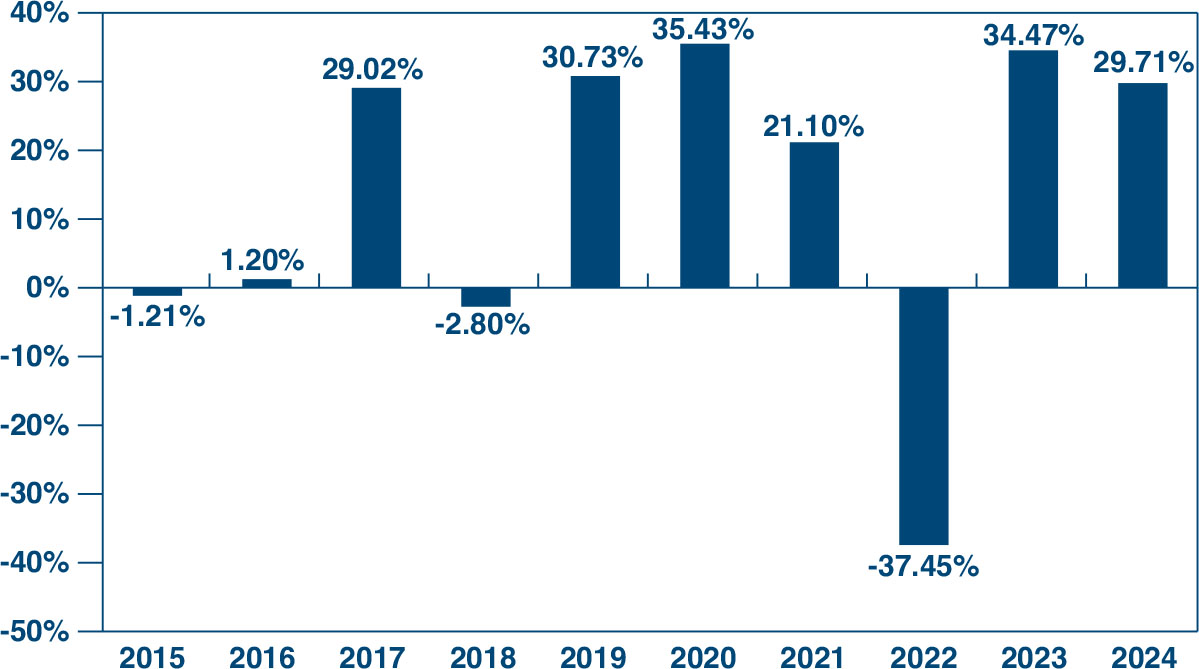
GLOBAL GROWTH FUND
(Total Returns for Class AAA Shares for the Years Ended December 31)
|
| Bar Chart [Table] |
| Years |
Returns |
| 2015 |
-1.21% |
| 2016 |
1.20% |
| 2017 |
29.02% |
| 2018 |
-2.08% |
| 2019 |
30.73% |
| 2020 |
35.43% |
| 2021 |
21.10% |
| 2022 |
-37.45% |
| 2023 |
34.47% |
| 2024 |
29.71% |
|
| Bar Chart Closing [Text Block] |
During the calendar years shown in the bar chart, the highest return for a quarter was 24.94% (quarter ended June 30, 2020), and the lowest return for a quarter was (25.27)% (quarter ended June 30, 2022).
|
| Performance Table Heading |
Average Annual Total Returns (for the years ended December 31, 2024 with maximum sales charge, if applicable)
|
| Performance Table Uses Highest Federal Rate |
After-tax returns are calculated using the historical highest individual federal marginal income tax rates and do not reflect the impact of state and local taxes.
|
| Performance Table Not Relevant to Tax Deferred |
Actual after-tax returns depend on an investor’s tax situation and may differ from those shown. After-tax returns shown are not relevant to investors who hold their Global Growth Fund shares through tax deferred arrangements, such as 401(k) plans or individual retirement accounts, including Roth IRAs and SEP IRAs (collectively, “IRAs”).
|
| Performance Table Explanation after Tax Higher |
In some instances, the “Return After Taxes on Distributions and Sale of Fund Shares” may be greater than the “Return After Taxes on Distributions” because the investor is assumed to have sufficient capital gains of the same character from other investments to offset any capital losses from the redemption so that the taxpayer may deduct the capital losses in full.
|
| Performance [Table] |
Average Annual Total Returns
(for the years ended December 31, 2024
with maximum sales charge, if applicable) |
|
Past
One Year |
|
|
Past
Five Years |
|
|
Past
Ten Years |
|
| Global Growth Fund Class AAA Shares: |
|
|
|
|
|
|
|
|
|
|
|
|
|
|
|
|
|
|
| Return Before Taxes |
|
|
|
29.71 |
% |
|
|
|
|
12.34 |
% |
|
|
|
|
11.36 |
% |
|
| Return After Taxes on Distributions |
|
|
|
29.02 |
% |
|
|
|
|
11.85 |
% |
|
|
|
|
10.27 |
% |
|
| Return After Taxes on Distributions and Sale of Fund Shares |
|
|
|
18.10 |
% |
|
|
|
|
9.83 |
% |
|
|
|
|
9.03 |
% |
|
| Class A Shares Return Before Taxes |
|
|
|
22.25 |
% |
|
|
|
|
11.01 |
% |
|
|
|
|
10.70 |
% |
|
| Class I Shares Return Before Taxes |
|
|
|
29.71 |
% |
|
|
|
|
12.34 |
% |
|
|
|
|
11.66 |
% |
|
MSCI AC World Index
(reflects no deduction for fees, expenses, or taxes) |
|
|
|
18.02 |
% |
|
|
|
|
10.58 |
% |
|
|
|
|
9.79 |
% |
|
| Lipper Global Large Cap Growth Fund Classification |
|
|
|
17.54 |
% |
|
|
|
|
9.58 |
% |
|
|
|
|
10.00 |
% |
|
|
| Performance Table One Class of after Tax Shown [Text] |
Actual after-tax returns for other classes will vary due to the differences in expenses.
|
| Performance Table Closing [Text Block] |
After-tax returns are calculated using the historical highest individual federal marginal income tax rates and do not reflect the impact of state and local taxes. In some instances, the “Return After Taxes on Distributions and Sale of Fund Shares” may be greater than the “Return After Taxes on Distributions” because the investor is assumed to have sufficient capital gains of the same character from other investments to offset any capital losses from the redemption so that the taxpayer may deduct the capital losses in full. Actual after-tax returns depend on an investor’s tax situation and may differ from those shown. After-tax returns shown are not relevant to investors who hold their Global Growth Fund shares through tax deferred arrangements, such as 401(k) plans or individual retirement accounts, including Roth IRAs and SEP IRAs (collectively, “IRAs”). After-tax returns are shown only for Class AAA shares. Actual after-tax returns for other classes will vary due to the differences in expenses.
|
| Performance Availability Website Address [Text] |
www.gabelli.com
|
| The Gabelli Global Growth Fund | The Gabelli Global Growth Fund CLASS AAA |
|
| Prospectus [Line Items] |
|
| Highest Quarterly Return, Label [Optional Text] |
highest return for a quarter
|
| Highest Quarterly Return |
24.94%
|
| Highest Quarterly Return, Date |
Jun. 30, 2020
|
| Lowest Quarterly Return, Label [Optional Text] |
lowest return for a quarter
|
| Lowest Quarterly Return |
(25.27%)
|
| Lowest Quarterly Return, Date |
Jun. 30, 2022
|
| GABELLI INTERNATIONAL SMALL CAP FUND |
|
| Prospectus [Line Items] |
|
| Bar Chart and Performance Table [Heading] |
Performance
|
| Performance Narrative [Text Block] |
The bar chart and table that follow provide an indication of the risks of investing in the International Small Cap Fund by showing changes in the International Small Cap Fund’s performance from year to year and by showing how the International Small Cap Fund’s average annual returns for one year, five years, and ten years compared with those of a broad based securities market index. As with all mutual funds, the International Small Cap Fund’s past performance (before and after taxes) does not predict how the International Small Cap Fund will perform in the future. Updated information on the International Small Cap Fund’s results can be obtained by visiting www.gabelli.com.
|
| Performance Past Does Not Indicate Future [Text] |
As with all mutual funds, the International Small Cap Fund’s past performance (before and after taxes) does not predict how the International Small Cap Fund will perform in the future.
|
| Performance Information Illustrates Variability of Returns [Text] |
The bar chart and table that follow provide an indication of the risks of investing in the International Small Cap Fund by showing changes in the International Small Cap Fund’s performance from year to year and by showing how the International Small Cap Fund’s average annual returns for one year, five years, and ten years compared with those of a broad based securities market index.
|
| Bar Chart [Heading] |
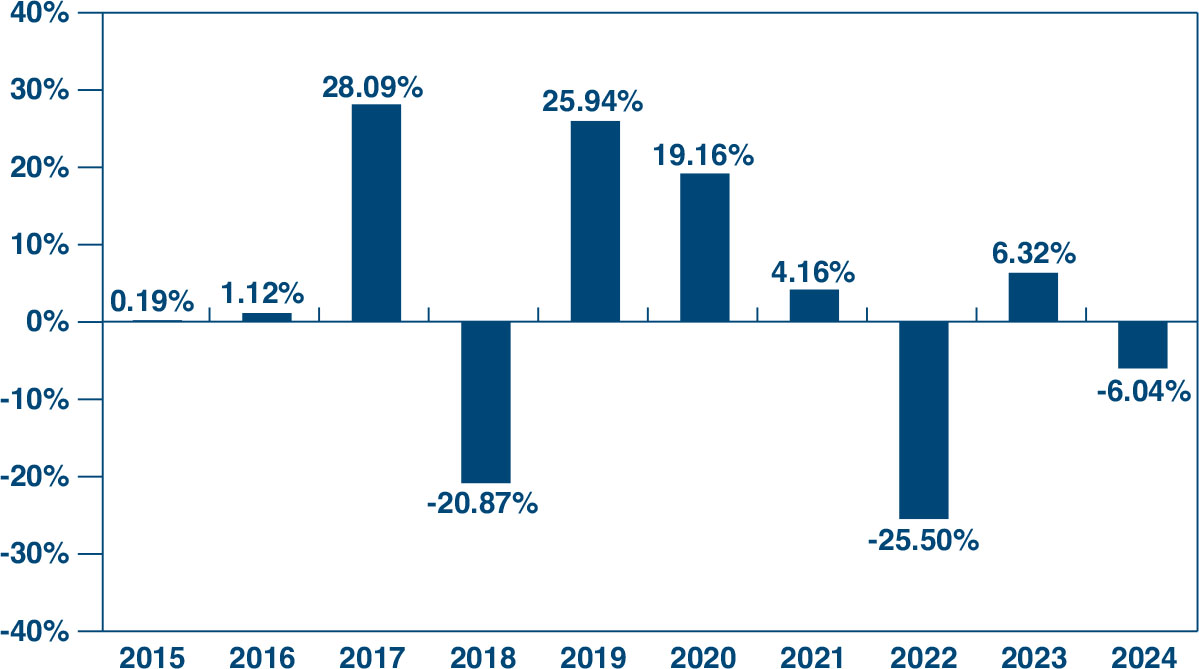
INTERNATIONAL SMALL CAP FUND
(Total Returns for Class AAA Shares for the Years Ended December 31)
|
| Bar Chart [Table] |
| Years |
Returns |
| 2015 |
0.19% |
| 2016 |
1.12% |
| 2017 |
28.09% |
| 2018 |
-20.87% |
| 2019 |
25.94% |
| 2020 |
19.16% |
| 2021 |
4.16% |
| 2022 |
-25.50% |
| 2023 |
6.32% |
| 2024 |
-6.04% |
|
| Bar Chart Closing [Text Block] |
During the calendar years shown in the bar chart, the highest return for a quarter was 21.47% (quarter ended June 30, 2020), and the lowest return for a quarter was (25.11)% (quarter ended March 31, 2020).
|
| Performance Table Heading |
Average Annual Total Returns (for the years ended December 31, 2024 with maximum sales charge, if applicable)
|
| Performance Table Uses Highest Federal Rate |
After-tax returns are calculated using the historical highest individual federal marginal income tax rates and do not reflect the impact of state and local taxes.
|
| Performance Table Not Relevant to Tax Deferred |
After-tax returns shown are not relevant to investors who hold their International Small Cap Fund shares through tax deferred arrangements, such as 401(k) plans or individual retirement accounts, including Roth IRAs and SEP IRAs (collectively, “IRAs”).
|
| Performance Table Explanation after Tax Higher |
In some instances, the “Return After Taxes on Distributions and Sale of Fund Shares” may be greater than the “Return After Taxes on Distributions” because the investor is assumed to have sufficient capital gains of the same character from other investments to offset any capital losses from the redemption so that the taxpayer may deduct the capital losses in full.
|
| Performance [Table] |
Average Annual Total Returns
(for the years ended December 31, 2024
with maximum sales charge, if applicable) |
|
Past
One Year |
|
|
Past
Five Years |
|
|
Past
Ten Years |
|
| International Small Cap Fund Class AAA Shares: |
|
|
|
|
|
|
|
|
|
|
|
|
|
|
|
|
|
|
| Return Before Taxes |
|
|
|
(6.04 |
)% |
|
|
|
|
(1.57 |
)% |
|
|
|
|
1.79 |
% |
|
| Return After Taxes on Distributions |
|
|
|
(5.99 |
)% |
|
|
|
|
(1.73 |
)% |
|
|
|
|
(0.07 |
)% |
|
| Return After Taxes on Distributions and Sale of Fund Shares |
|
|
|
(3.32 |
)% |
|
|
|
|
(1.05 |
)% |
|
|
|
|
1.46 |
% |
|
| Class A Shares Return Before Taxes |
|
|
|
(11.45 |
)% |
|
|
|
|
(2.74 |
)% |
|
|
|
|
0.96 |
% |
|
| Class I Shares Return Before Taxes |
|
|
|
(6.11 |
)% |
|
|
|
|
(1.60 |
)% |
|
|
|
|
2.00 |
% |
|
MSCI EAFE Small Cap Index
(reflects no deduction for fees, expenses, or taxes) |
|
|
|
2.32 |
% |
|
|
|
|
2.74 |
% |
|
|
|
|
5.95 |
% |
|
|
| Performance Table One Class of after Tax Shown [Text] |
After-tax returns are shown only for Class AAA shares. After-tax returns for other classes will vary due to the differences in expenses.
|
| Performance Table Closing [Text Block] |
After-tax returns are calculated using the historical highest individual federal marginal income tax rates and do not reflect the impact of state and local taxes. In some instances, the “Return After Taxes on Distributions and Sale of Fund Shares” may be greater than the “Return After Taxes on Distributions” because the investor is assumed to have sufficient capital gains of the same character from other investments to offset any capital losses from the redemption so that the taxpayer may deduct the capital losses in full. Actual after-tax returns depend on an investor’s tax situation and may differ from those shown. After-tax returns shown are not relevant to investors who hold their International Small Cap Fund shares through tax deferred arrangements, such as 401(k) plans or individual retirement accounts, including Roth IRAs and SEP IRAs (collectively, “IRAs”). After-tax returns are shown only for Class AAA shares. After-tax returns for other classes will vary due to the differences in expenses.
|
| Performance Availability Website Address [Text] |
www.gabelli.com
|
| GABELLI INTERNATIONAL SMALL CAP FUND | GABELLI INTERNATIONAL SMALL CAP FUND CLASS AAA |
|
| Prospectus [Line Items] |
|
| Highest Quarterly Return, Label [Optional Text] |
highest return for a quarter
|
| Highest Quarterly Return |
21.47%
|
| Highest Quarterly Return, Date |
Jun. 30, 2020
|
| Lowest Quarterly Return, Label [Optional Text] |
lowest return for a quarter
|
| Lowest Quarterly Return |
(25.11%)
|
| Lowest Quarterly Return, Date |
Mar. 31, 2020
|
| The Gabelli Global Rising Income and Dividend Fund |
|
| Prospectus [Line Items] |
|
| Bar Chart and Performance Table [Heading] |
Performance
|
| Performance Narrative [Text Block] |
The bar chart and table that follow provide an indication of the risks of investing in the GRID Fund by showing changes in the GRID Fund’s performance from year to year and by showing how the GRID Fund’s average annual returns for one year, five years, and ten years compared with those of a broad based securities market index. Substantially all of the GRID Fund’s operating history and performance results have been achieved implementing different investment strategies under the GRID Fund’s previous names, the GAMCO Vertumnus Fund and the GAMCO Global Convertible Securities Fund, and as such, the GRID Fund’s past performance (before and after taxes) does not predict how the GRID Fund will perform in the future. Updated information on the GRID Fund’s results can be obtained by visiting www.gabelli.com.
|
| Performance Past Does Not Indicate Future [Text] |
Substantially all of the GRID Fund’s operating history and performance results have been achieved implementing different investment strategies under the GRID Fund’s previous names, the GAMCO Vertumnus Fund and the GAMCO Global Convertible Securities Fund, and as such, the GRID Fund’s past performance (before and after taxes) does not predict how the GRID Fund will perform in the future.
|
| Performance Information Illustrates Variability of Returns [Text] |
The bar chart and table that follow provide an indication of the risks of investing in the GRID Fund by showing changes in the GRID Fund’s performance from year to year and by showing how the GRID Fund’s average annual returns for one year, five years, and ten years compared with those of a broad based securities market index.
|
| Bar Chart [Heading] |
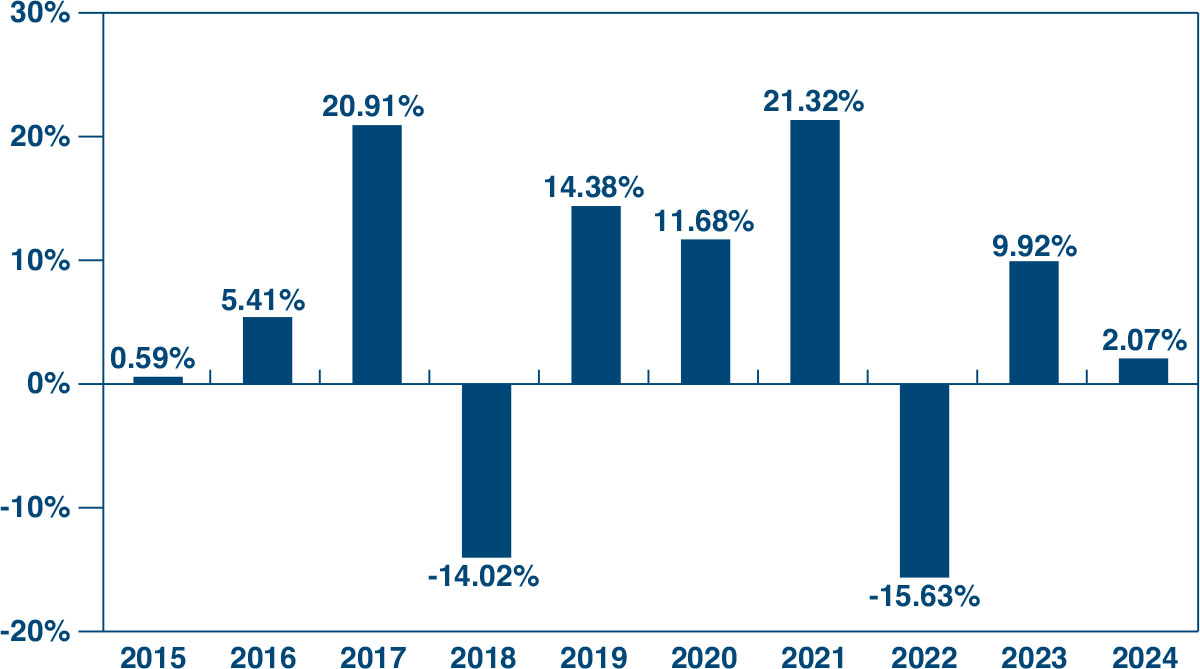
GRID FUND
(Total Returns for Class AAA Shares for the Years Ended December 31)
|
| Bar Chart [Table] |
| Years |
Returns |
| 2015 |
0.59% |
| 2016 |
5.41% |
| 2017 |
20.91% |
| 2018 |
-14.02% |
| 2019 |
14.38% |
| 2020 |
11.68% |
| 2021 |
21.32% |
| 2022 |
-15.63% |
| 2023 |
9.92% |
| 2024 |
2.07% |
|
| Bar Chart Closing [Text Block] |
During the calendar years shown in the bar chart, the highest return for a quarter was 20.32% (quarter ended December 31, 2020), and the lowest return for a quarter was (24.71)% (quarter ended March 31, 2020).
|
| Performance Table Heading |
Average Annual Total Returns (for the years ended December 31, 2024 with maximum sales charge, if applicable)
|
| Performance Table Uses Highest Federal Rate |
After-tax returns are calculated using the historical highest individual federal marginal income tax rates and do not reflect the impact of state and local taxes.
|
| Performance Table Not Relevant to Tax Deferred |
After-tax returns shown are not relevant to investors who hold their GRID Fund shares through tax deferred arrangements, such as 401(k) plans or individual retirement accounts, including Roth IRAs and SEP IRAs (collectively, “IRAs”).
|
| Performance Table Explanation after Tax Higher |
In some instances, the “Return After Taxes on Distributions and Sale of Fund Shares” may be greater than the “Return After Taxes on Distributions” because the investor is assumed to have sufficient capital gains of the same character from other investments to offset any capital losses from the redemption so that the taxpayer may deduct the capital losses in full.
|
| Performance [Table] |
Average Annual Total Returns
(for the years ended December 31, 2024
with maximum sales charge, if applicable) |
|
Past
One Year |
|
|
Past
Five Years |
|
|
Past
Ten Years |
|
| GRID Fund Class AAA Shares: |
|
|
|
|
|
|
|
|
|
|
|
|
|
|
|
|
|
|
| Return Before Taxes |
|
|
|
2.07 |
% |
|
|
|
|
5.10 |
% |
|
|
|
|
4.92 |
% |
|
| Return After Taxes on Distributions |
|
|
|
1.44 |
% |
|
|
|
|
4.65 |
% |
|
|
|
|
4.57 |
% |
|
| Return After Taxes on Distributions and Sale of Fund Shares |
|
|
|
1.84 |
% |
|
|
|
|
4.05 |
% |
|
|
|
|
3.95 |
% |
|
| Class A Shares Return Before Taxes |
|
|
|
(3.81 |
)% |
|
|
|
|
3.86 |
% |
|
|
|
|
4.28 |
% |
|
| Class I Shares Return Before Taxes |
|
|
|
2.03 |
% |
|
|
|
|
5.10 |
% |
|
|
|
|
5.16 |
% |
|
MSCI World Index
(reflects no deduction for fees, expenses, or taxes) |
|
|
|
19.19 |
% |
|
|
|
|
11.70 |
% |
|
|
|
|
10.52 |
% |
|
|
| Performance Table One Class of after Tax Shown [Text] |
After-tax returns are shown only for Class AAA shares. After-tax returns for other classes will vary due to the differences in expenses.
|
| Performance Table Closing [Text Block] |
After-tax returns are calculated using the historical highest individual federal marginal income tax rates and do not reflect the impact of state and local taxes. In some instances, the “Return After Taxes on Distributions and Sale of Fund Shares” may be greater than the “Return After Taxes on Distributions” because the investor is assumed to have sufficient capital gains of the same character from other investments to offset any capital losses from the redemption so that the taxpayer may deduct the capital losses in full. Actual after-tax returns depend on an investor’s tax situation and may differ from those shown. After-tax returns shown are not relevant to investors who hold their GRID Fund shares through tax deferred arrangements, such as 401(k) plans or individual retirement accounts, including Roth IRAs and SEP IRAs (collectively, “IRAs”). After-tax returns are shown only for Class AAA shares. After-tax returns for other classes will vary due to the differences in expenses.
|
| Performance Availability Website Address [Text] |
www.gabelli.com
|
| The Gabelli Global Rising Income and Dividend Fund | The Gabelli Global Rising Income and Dividend Fund CLASS AAA |
|
| Prospectus [Line Items] |
|
| Highest Quarterly Return, Label [Optional Text] |
highest return for a quarter
|
| Highest Quarterly Return |
20.32%
|
| Highest Quarterly Return, Date |
Dec. 31, 2020
|
| Lowest Quarterly Return, Label [Optional Text] |
lowest return for a quarter
|
| Lowest Quarterly Return |
(24.71%)
|
| Lowest Quarterly Return, Date |
Mar. 31, 2020
|
| Gabelli Global Mini Mites Fund |
|
| Prospectus [Line Items] |
|
| Bar Chart and Performance Table [Heading] |
Performance
|
| Performance Narrative [Text Block] |
The bar chart and table that follow provide an indication of the risks of investing in the Global Mini Mites Fund by showing changes in the Global Mini Mites Fund’s performance from year to year and by showing how the Global Mini Mites Fund’s average annual returns for one year compared with those of a broad based securities market index. As with all mutual funds, the Global Mini Mites Fund’s past performance (before and after taxes) does not predict how the Global Mini Mites Fund will perform in the future. Updated information on the Global Mini Mites Fund’s results can be obtained by visiting www.gabelli.com
|
| Performance Past Does Not Indicate Future [Text] |
As with all mutual funds, the Global Mini Mites Fund’s past performance (before and after taxes) does not predict how the Global Mini Mites Fund will perform in the future.
|
| Performance Information Illustrates Variability of Returns [Text] |
The bar chart and table that follow provide an indication of the risks of investing in the Global Mini Mites Fund by showing changes in the Global Mini Mites Fund’s performance from year to year and by showing how the Global Mini Mites Fund’s average annual returns for one year compared with those of a broad based securities market index.
|
| Bar Chart [Heading] |
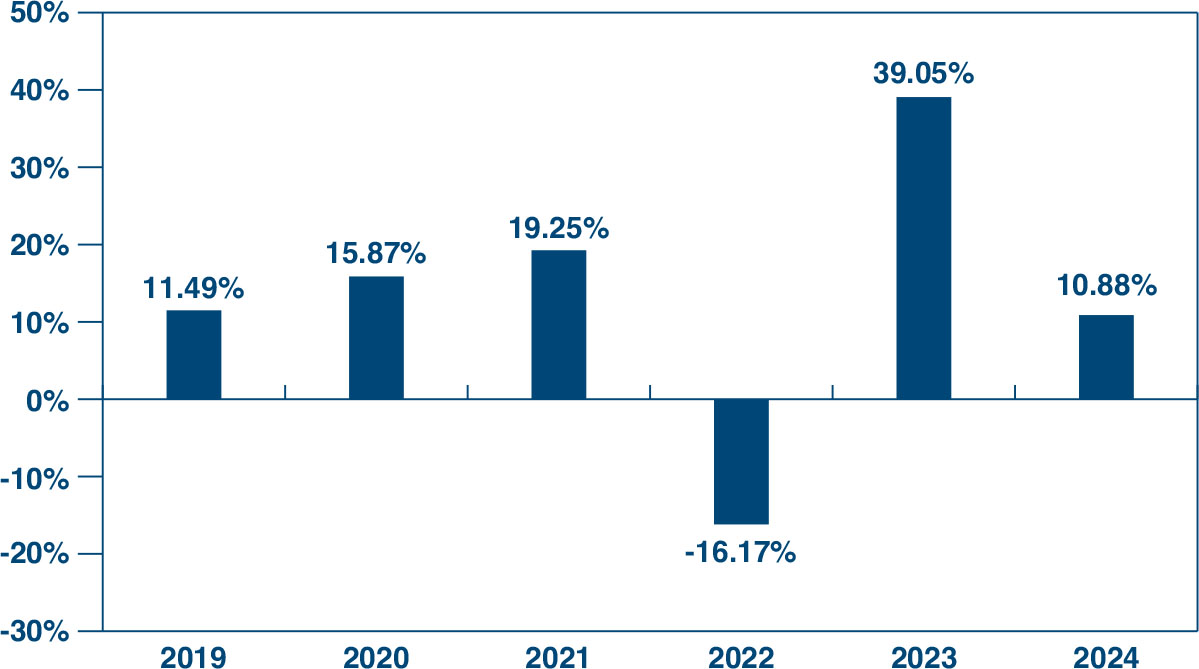
GLOBAL MINI MITES FUND
(Total Returns for Class AAA Shares for the Years Ended December 31)
|
| Bar Chart [Table] |
| Years |
Returns |
| 2019 |
11.49% |
| 2020 |
15.87% |
| 2021 |
19.25% |
| 2022 |
-16.17% |
| 2023 |
39.05% |
| 2024 |
10.88% |
|
| Bar Chart Closing [Text Block] |
During the calendar years shown in the bar chart, the highest return for a quarter was 33.95% (quarter ended December 31, 2020) and the lowest return for a quarter was (32.61)% (quarter ended March 31, 2020).
|
| Performance Table Heading |
Average Annual Total Returns (for the periods ended December 31, 2024 with maximum sales charges, if applicable)
|
| Performance Table Uses Highest Federal Rate |
After-tax returns are calculated using the historical highest individual federal marginal income tax rates and do not reflect the impact of state and local taxes.
|
| Performance Table Not Relevant to Tax Deferred |
After-tax returns shown are not relevant to investors who hold their Global Mini Mites Fund shares through tax deferred arrangements, such as 401(k) plans or individual retirement accounts, including Roth IRAs and SEP IRAs (collectively, “IRAs”).
|
| Performance Table Explanation after Tax Higher |
In some instances, the “Return After Taxes on Distributions and Sale of Fund Shares” may be greater than the “Return After Taxes on Distributions” because the investor is assumed to have sufficient capital gains of the same character from other investments to offset any capital losses from the redemption so that the taxpayer may deduct the capital losses in full.
|
| Performance [Table] |
Average Annual Total Returns
(for the periods ended December 31, 2024
with maximum sales charges, if applicable) |
|
Past
One Year |
|
|
Past
Five Years |
|
|
Since Inception
(October 1, 2018) |
|
| The Global Mini Mites Fund Class AAA Shares (first issued on 10/01/18) |
|
|
|
|
|
|
|
|
|
|
|
|
|
|
|
|
|
|
| Return Before Taxes |
|
|
|
10.88 |
% |
|
|
|
|
12.30 |
% |
|
|
|
|
9.05 |
% |
|
| Return After Taxes on Distributions |
|
|
|
8.57 |
% |
|
|
|
|
9.79 |
% |
|
|
|
|
6.86 |
% |
|
| Return After Taxes on Distributions and Sale of Fund Shares |
|
|
|
7.88 |
% |
|
|
|
|
9.07 |
% |
|
|
|
|
6.50 |
% |
|
| Class A Shares (first issued on 10/01/18) |
|
|
|
|
|
|
|
|
|
|
|
|
|
|
|
|
|
|
| Return Before Taxes |
|
|
|
4.60 |
% |
|
|
|
|
10.98 |
% |
|
|
|
|
8.01 |
% |
|
| Class I Shares (first issued on 10/01/18) |
|
|
|
|
|
|
|
|
|
|
|
|
|
|
|
|
|
|
| Return Before Taxes |
|
|
|
10.88 |
% |
|
|
|
|
12.30 |
% |
|
|
|
|
9.09 |
% |
|
S&P Developed SmallCap Index
(reflects no deduction for fees, expenses or taxes) |
|
|
|
8.64 |
% |
|
|
|
|
6.60 |
% |
|
|
|
|
5.97 |
% |
|
|
| Performance Table One Class of after Tax Shown [Text] |
After-tax returns are shown only for Class AAA shares. After-tax returns for other classes will vary due to the differences in expenses.
|
| Performance Table Closing [Text Block] |
After-tax returns are calculated using the historical highest individual federal marginal income tax rates and do not reflect the impact of state and local taxes. In some instances, the “Return After Taxes on Distributions and Sale of Fund Shares” may be greater than the “Return After Taxes on Distributions” because the investor is assumed to have sufficient capital gains of the same character from other investments to offset any capital losses from the redemption so that the taxpayer may deduct the capital losses in full. Actual after-tax returns depend on an investor’s tax situation and may differ from those shown. After-tax returns shown are not relevant to investors who hold their Global Mini Mites Fund shares through tax deferred arrangements, such as 401(k) plans or individual retirement accounts, including Roth IRAs and SEP IRAs (collectively, “IRAs”). After-tax returns are shown only for Class AAA shares. After-tax returns for other classes will vary due to the differences in expenses.
|
| Performance Availability Website Address [Text] |
www.gabelli.com
|
| Gabelli Global Mini Mites Fund | Gabelli Global Mini Mites Fund CLASS AAA |
|
| Prospectus [Line Items] |
|
| Highest Quarterly Return, Label [Optional Text] |
highest return for a quarter
|
| Highest Quarterly Return |
33.95%
|
| Highest Quarterly Return, Date |
Dec. 31, 2020
|
| Lowest Quarterly Return, Label [Optional Text] |
lowest return for a quarter
|
| Lowest Quarterly Return |
(32.61%)
|
| Lowest Quarterly Return, Date |
Mar. 31, 2020
|