PAY VERSUS PERFORMANCE
As required by the regulations of the Securities and Exchange Commission implementing Section 14(i) of the Exchange Act, disclosure relating to the relationship of our executive pay versus performance is set forth below.
|
|
|
|
|
|
|
|
Average |
|
|
Average |
|
|
Value of Initial Fixed $100 |
|
|
|
|
|
|
|
|||||||||||
Year |
|
Summary |
|
|
Compensation |
|
|
Table Total |
|
|
Actually |
|
|
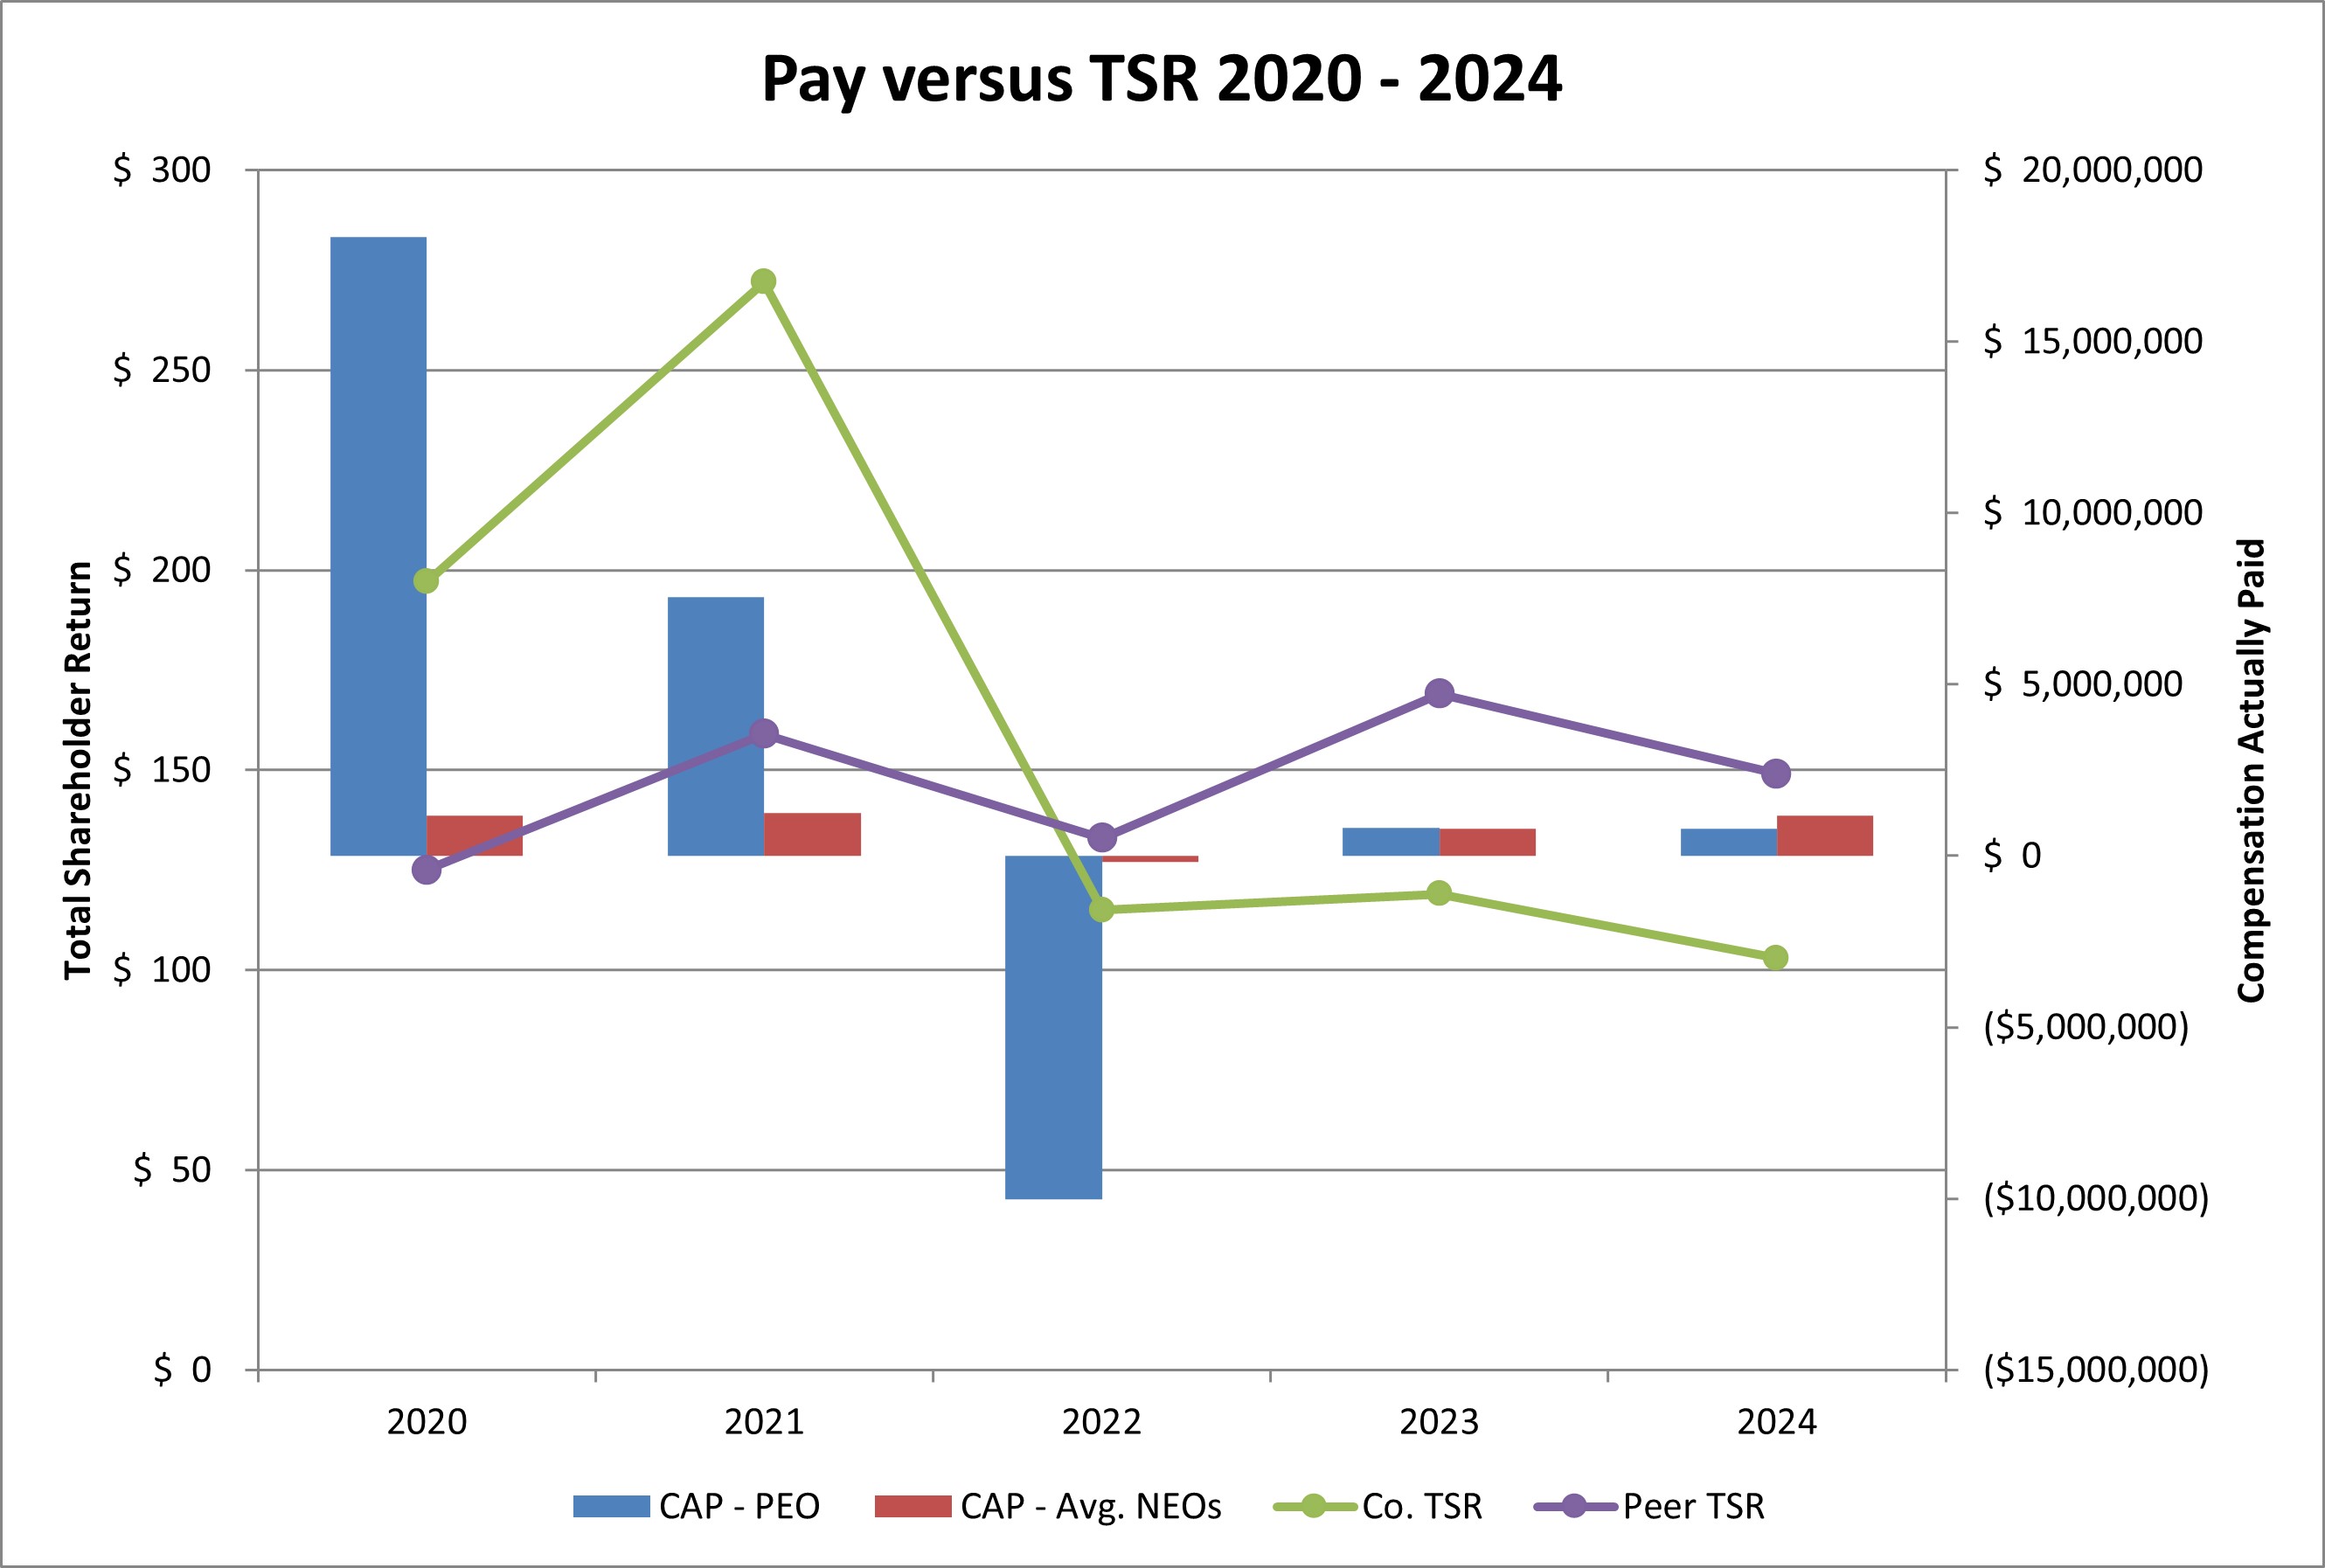
Total |
|
|
Peer Group |
|
|
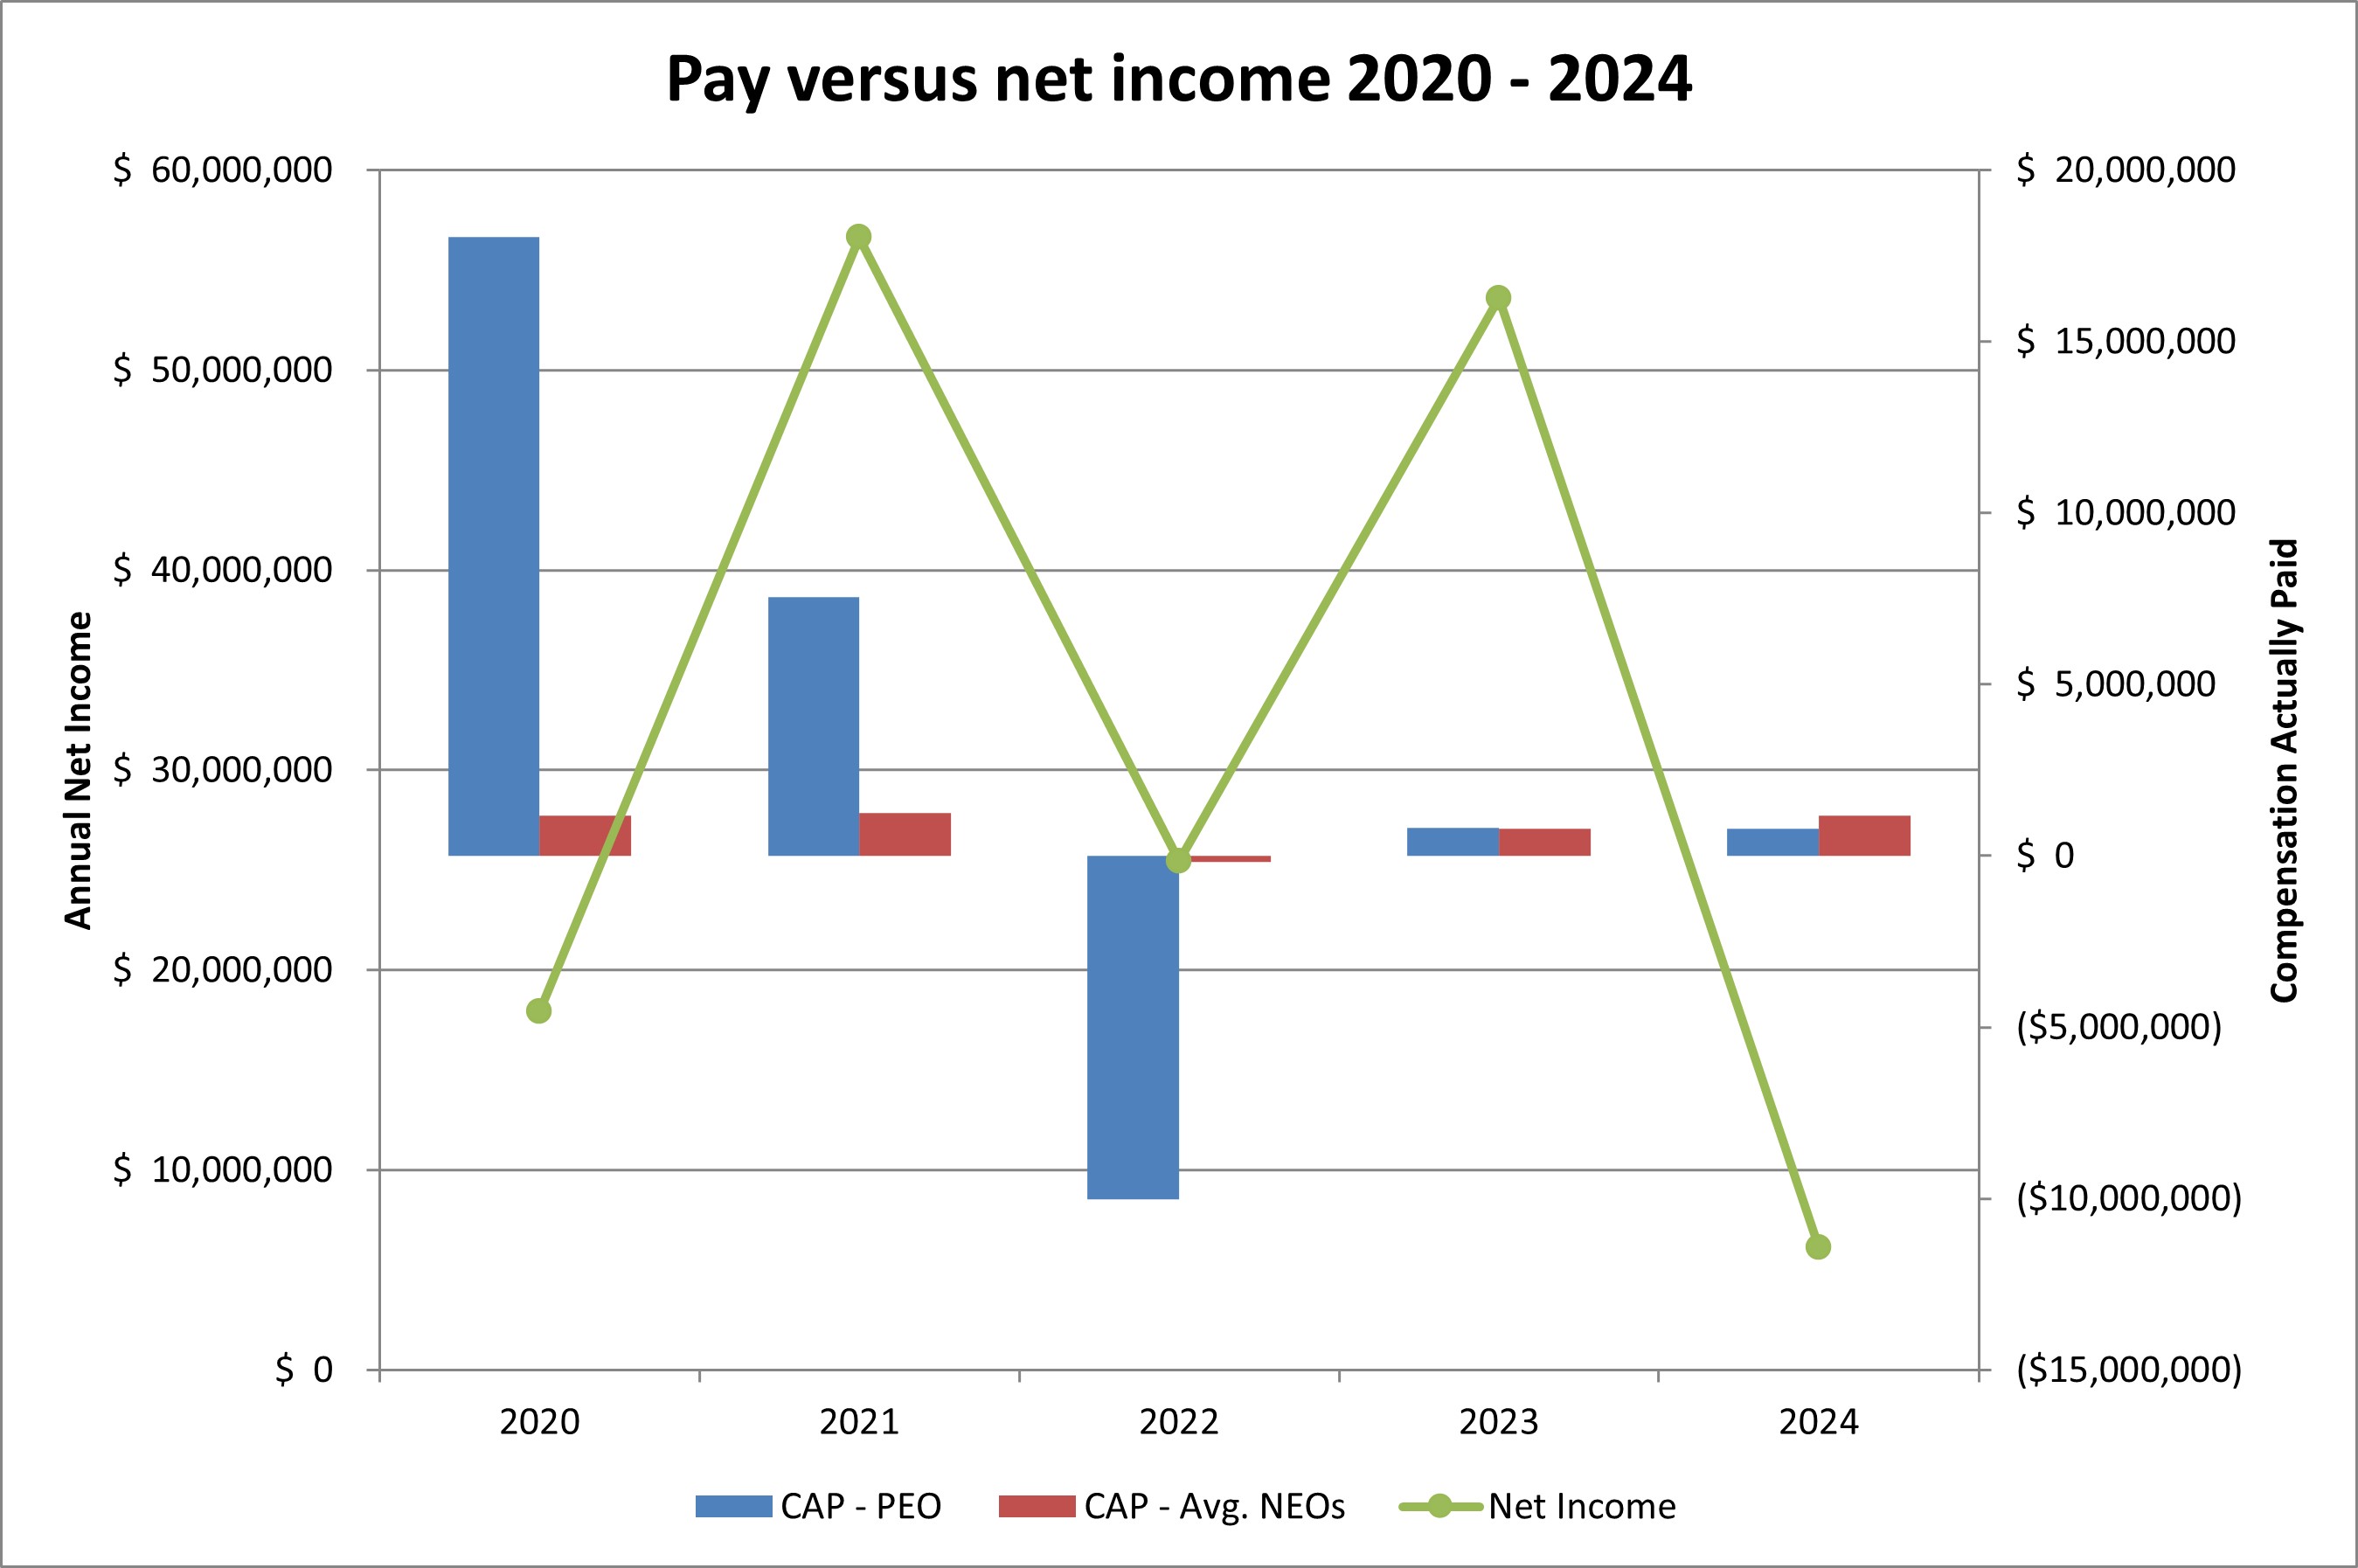
Net Income |
|
|
EPS |
|
||||||||
(a) |
|
(b) |
|
|
(c) |
|
|
(d) |
|
|
(e) |
|
|
(f) |
|
|
(g) |
|
|
(h) |
|
|
(i) |
|
||||||||
2024 |
|
$ |
719,107 |
|
|
$ |
785,223 |
|
|
$ |
975,190 |
|
|
$ |
1,183,331 |
|
|
$ |
103 |
|
|
$ |
149 |
|
|
$ |
6,129 |
|
|
$ |
0.14 |
|
2023 |
|
$ |
821,250 |
|
|
$ |
818,521 |
|
|
$ |
873,114 |
|
|
$ |
777,903 |
|
|
$ |
119 |
|
|
$ |
169 |
|
|
$ |
53,595 |
|
|
$ |
1.19 |
|
2022 |
|
$ |
657,101 |
|
|
$ |
(10,016,269 |
) |
|
$ |
803,540 |
|
|
$ |
(189,505 |
) |
|
$ |
115 |
|
|
$ |
133 |
|
|
$ |
25,446 |
|
|
$ |
0.57 |
|
2021 |
|
$ |
464,212 |
|
|
$ |
7,549,094 |
|
|
$ |
918,714 |
|
|
$ |
1,254,491 |
|
|
$ |
272 |
|
|
$ |
159 |
|
|
$ |
56,625 |
|
|
$ |
1.26 |
|
2020 |
|
$ |
143,495 |
|
|
$ |
18,060,019 |
|
|
$ |
578,776 |
|
|
$ |
1,183,531 |
|
|
$ |
197 |
|
|
$ |
125 |
|
|
$ |
17,910 |
|
|
$ |
0.41 |
|
Year |
|
Reported |
|
|
Reported Value |
|
|
Equity |
|
|
Reported |
|
Pension Benefit |
|
Compensation |
|
||||
2024 |
|
$ |
719,107 |
|
|
$ |
(198,319 |
) |
|
$ |
264,435 |
|
|
NA |
|
NA |
|
$ |
785,223 |
|
2023 |
|
$ |
821,250 |
|
|
$ |
(318,988 |
) |
|
$ |
316,259 |
|
|
NA |
|
NA |
|
$ |
818,521 |
|
2022 |
|
$ |
657,101 |
|
|
$ |
(172,142 |
) |
|
$ |
(10,501,218 |
) |
|
NA |
|
NA |
|
$ |
(10,016,269 |
) |
2021 |
|
$ |
464,212 |
|
|
|
— |
|
|
$ |
7,084,882 |
|
|
NA |
|
NA |
|
$ |
7,549,094 |
|
2020 |
|
$ |
143,495 |
|
|
|
— |
|
|
$ |
17,916,524 |
|
|
NA |
|
NA |
|
$ |
18,060,019 |
|
Year |
|
Year End Fair |
|
|
Change in |
|
|
Fair Value as |
|
|
Change in |
|
|
Fair Value at |
|
|
Value of |
|
|
Total |
|
|||||||
2024 |
|
$ |
320,774 |
|
|
$ |
(30,918 |
) |
|
|
— |
|
|
$ |
(25,421 |
) |
|
|
— |
|
|
|
— |
|
|
$ |
264,435 |
|
2023 |
|
$ |
366,853 |
|
|
$ |
(49,498 |
) |
|
|
— |
|
|
$ |
(1,096 |
) |
|
|
— |
|
|
|
— |
|
|
$ |
316,259 |
|
2022 |
|
$ |
143,261 |
|
|
|
— |
|
|
|
— |
|
|
$ |
(10,644,480 |
) |
|
|
— |
|
|
|
— |
|
|
$ |
(10,501,218 |
) |
2021 |
|
|
— |
|
|
$ |
5,432,919 |
|
|
|
— |
|
|
$ |
1,651,962 |
|
|
|
— |
|
|
|
— |
|
|
$ |
7,084,882 |
|
2020 |
|
|
— |
|
|
$ |
14,085,122 |
|
|
|
— |
|
|
$ |
3,831,402 |
|
|
|
— |
|
|
|
— |
|
|
$ |
17,916,524 |
|
Year |
|
Average |
|
|
Average |
|
|
Average Equity |
|
|
Average |
|
Average Pension |
|
Average |
|
||||
2024 |
|
$ |
975,190 |
|
|
$ |
(507,540 |
) |
|
$ |
715,681 |
|
|
NA |
|
NA |
|
$ |
1,183,331 |
|
2023 |
|
$ |
873,114 |
|
|
$ |
(422,810 |
) |
|
$ |
327,599 |
|
|
NA |
|
NA |
|
$ |
777,903 |
|
2022 |
|
$ |
803,540 |
|
|
$ |
(306,693 |
) |
|
$ |
(686,352 |
) |
|
NA |
|
NA |
|
$ |
(189,505 |
) |
2021 |
|
$ |
918,714 |
|
|
$ |
(411,411 |
) |
|
$ |
747,188 |
|
|
NA |
|
NA |
|
$ |
1,254,491 |
|
2020 |
|
$ |
578,776 |
|
|
$ |
(162,259 |
) |
|
$ |
767,014 |
|
|
NA |
|
NA |
|
$ |
1,183,531 |
|
Year |
|
Average |
|
|
Average |
|
|
Average |
|
|
Average |
|
|
Average |
|
|
Average |
|
|
Total |
|
|||||||
2024 |
|
$ |
832,272 |
|
|
$ |
(19,699 |
) |
|
|
— |
|
|
$ |
(96,892 |
) |
|
|
— |
|
|
|
— |
|
|
$ |
715,681 |
|
2023 |
|
$ |
445,212 |
|
|
$ |
(142,205 |
) |
|
|
— |
|
|
$ |
24,592 |
|
|
|
— |
|
|
|
— |
|
|
$ |
327,599 |
|
2022 |
|
$ |
266,136 |
|
|
$ |
(701,359 |
) |
|
|
— |
|
|
$ |
(251,128 |
) |
|
|
— |
|
|
|
— |
|
|
$ |
(686,352 |
) |
2021 |
|
$ |
477,342 |
|
|
$ |
196,342 |
|
|
|
— |
|
|
$ |
73,504 |
|
|
|
— |
|
|
|
— |
|
|
$ |
747,188 |
|
2020 |
|
$ |
251,286 |
|
|
$ |
416,846 |
|
|
|
— |
|
|
$ |
98,882 |
|
|
|
— |
|
|
|
— |
|
|
$ |
767,014 |
|
Year |
|
Reported |
|
|
Reported Value |
|
|
Equity |
|
|
Reported |
|
Pension Benefit |
|
Compensation |
|
||||
2024 |
|
$ |
719,107 |
|
|
$ |
(198,319 |
) |
|
$ |
264,435 |
|
|
NA |
|
NA |
|
$ |
785,223 |
|
2023 |
|
$ |
821,250 |
|
|
$ |
(318,988 |
) |
|
$ |
316,259 |
|
|
NA |
|
NA |
|
$ |
818,521 |
|
2022 |
|
$ |
657,101 |
|
|
$ |
(172,142 |
) |
|
$ |
(10,501,218 |
) |
|
NA |
|
NA |
|
$ |
(10,016,269 |
) |
2021 |
|
$ |
464,212 |
|
|
|
— |
|
|
$ |
7,084,882 |
|
|
NA |
|
NA |
|
$ |
7,549,094 |
|
2020 |
|
$ |
143,495 |
|
|
|
— |
|
|
$ |
17,916,524 |
|
|
NA |
|
NA |
|
$ |
18,060,019 |
|
Year |
|
Year End Fair |
|
|
Change in |
|
|
Fair Value as |
|
|
Change in |
|
|
Fair Value at |
|
|
Value of |
|
|
Total |
|
|||||||
2024 |
|
$ |
320,774 |
|
|
$ |
(30,918 |
) |
|
|
— |
|
|
$ |
(25,421 |
) |
|
|
— |
|
|
|
— |
|
|
$ |
264,435 |
|
2023 |
|
$ |
366,853 |
|
|
$ |
(49,498 |
) |
|
|
— |
|
|
$ |
(1,096 |
) |
|
|
— |
|
|
|
— |
|
|
$ |
316,259 |
|
2022 |
|
$ |
143,261 |
|
|
|
— |
|
|
|
— |
|
|
$ |
(10,644,480 |
) |
|
|
— |
|
|
|
— |
|
|
$ |
(10,501,218 |
) |
2021 |
|
|
— |
|
|
$ |
5,432,919 |
|
|
|
— |
|
|
$ |
1,651,962 |
|
|
|
— |
|
|
|
— |
|
|
$ |
7,084,882 |
|
2020 |
|
|
— |
|
|
$ |
14,085,122 |
|
|
|
— |
|
|
$ |
3,831,402 |
|
|
|
— |
|
|
|
— |
|
|
$ |
17,916,524 |
|
Year |
|
Average |
|
|
Average |
|
|
Average Equity |
|
|
Average |
|
Average Pension |
|
Average |
|
||||
2024 |
|
$ |
975,190 |
|
|
$ |
(507,540 |
) |
|
$ |
715,681 |
|
|
NA |
|
NA |
|
$ |
1,183,331 |
|
2023 |
|
$ |
873,114 |
|
|
$ |
(422,810 |
) |
|
$ |
327,599 |
|
|
NA |
|
NA |
|
$ |
777,903 |
|
2022 |
|
$ |
803,540 |
|
|
$ |
(306,693 |
) |
|
$ |
(686,352 |
) |
|
NA |
|
NA |
|
$ |
(189,505 |
) |
2021 |
|
$ |
918,714 |
|
|
$ |
(411,411 |
) |
|
$ |
747,188 |
|
|
NA |
|
NA |
|
$ |
1,254,491 |
|
2020 |
|
$ |
578,776 |
|
|
$ |
(162,259 |
) |
|
$ |
767,014 |
|
|
NA |
|
NA |
|
$ |
1,183,531 |
|
Year |
|
Average |
|
|
Average |
|
|
Average |
|
|
Average |
|
|
Average |
|
|
Average |
|
|
Total |
|
|||||||
2024 |
|
$ |
832,272 |
|
|
$ |
(19,699 |
) |
|
|
— |
|
|
$ |
(96,892 |
) |
|
|
— |
|
|
|
— |
|
|
$ |
715,681 |
|
2023 |
|
$ |
445,212 |
|
|
$ |
(142,205 |
) |
|
|
— |
|
|
$ |
24,592 |
|
|
|
— |
|
|
|
— |
|
|
$ |
327,599 |
|
2022 |
|
$ |
266,136 |
|
|
$ |
(701,359 |
) |
|
|
— |
|
|
$ |
(251,128 |
) |
|
|
— |
|
|
|
— |
|
|
$ |
(686,352 |
) |
2021 |
|
$ |
477,342 |
|
|
$ |
196,342 |
|
|
|
— |
|
|
$ |
73,504 |
|
|
|
— |
|
|
|
— |
|
|
$ |
747,188 |
|
2020 |
|
$ |
251,286 |
|
|
$ |
416,846 |
|
|
|
— |
|
|
$ |
98,882 |
|
|
|
— |
|
|
|
— |
|
|
$ |
767,014 |
|
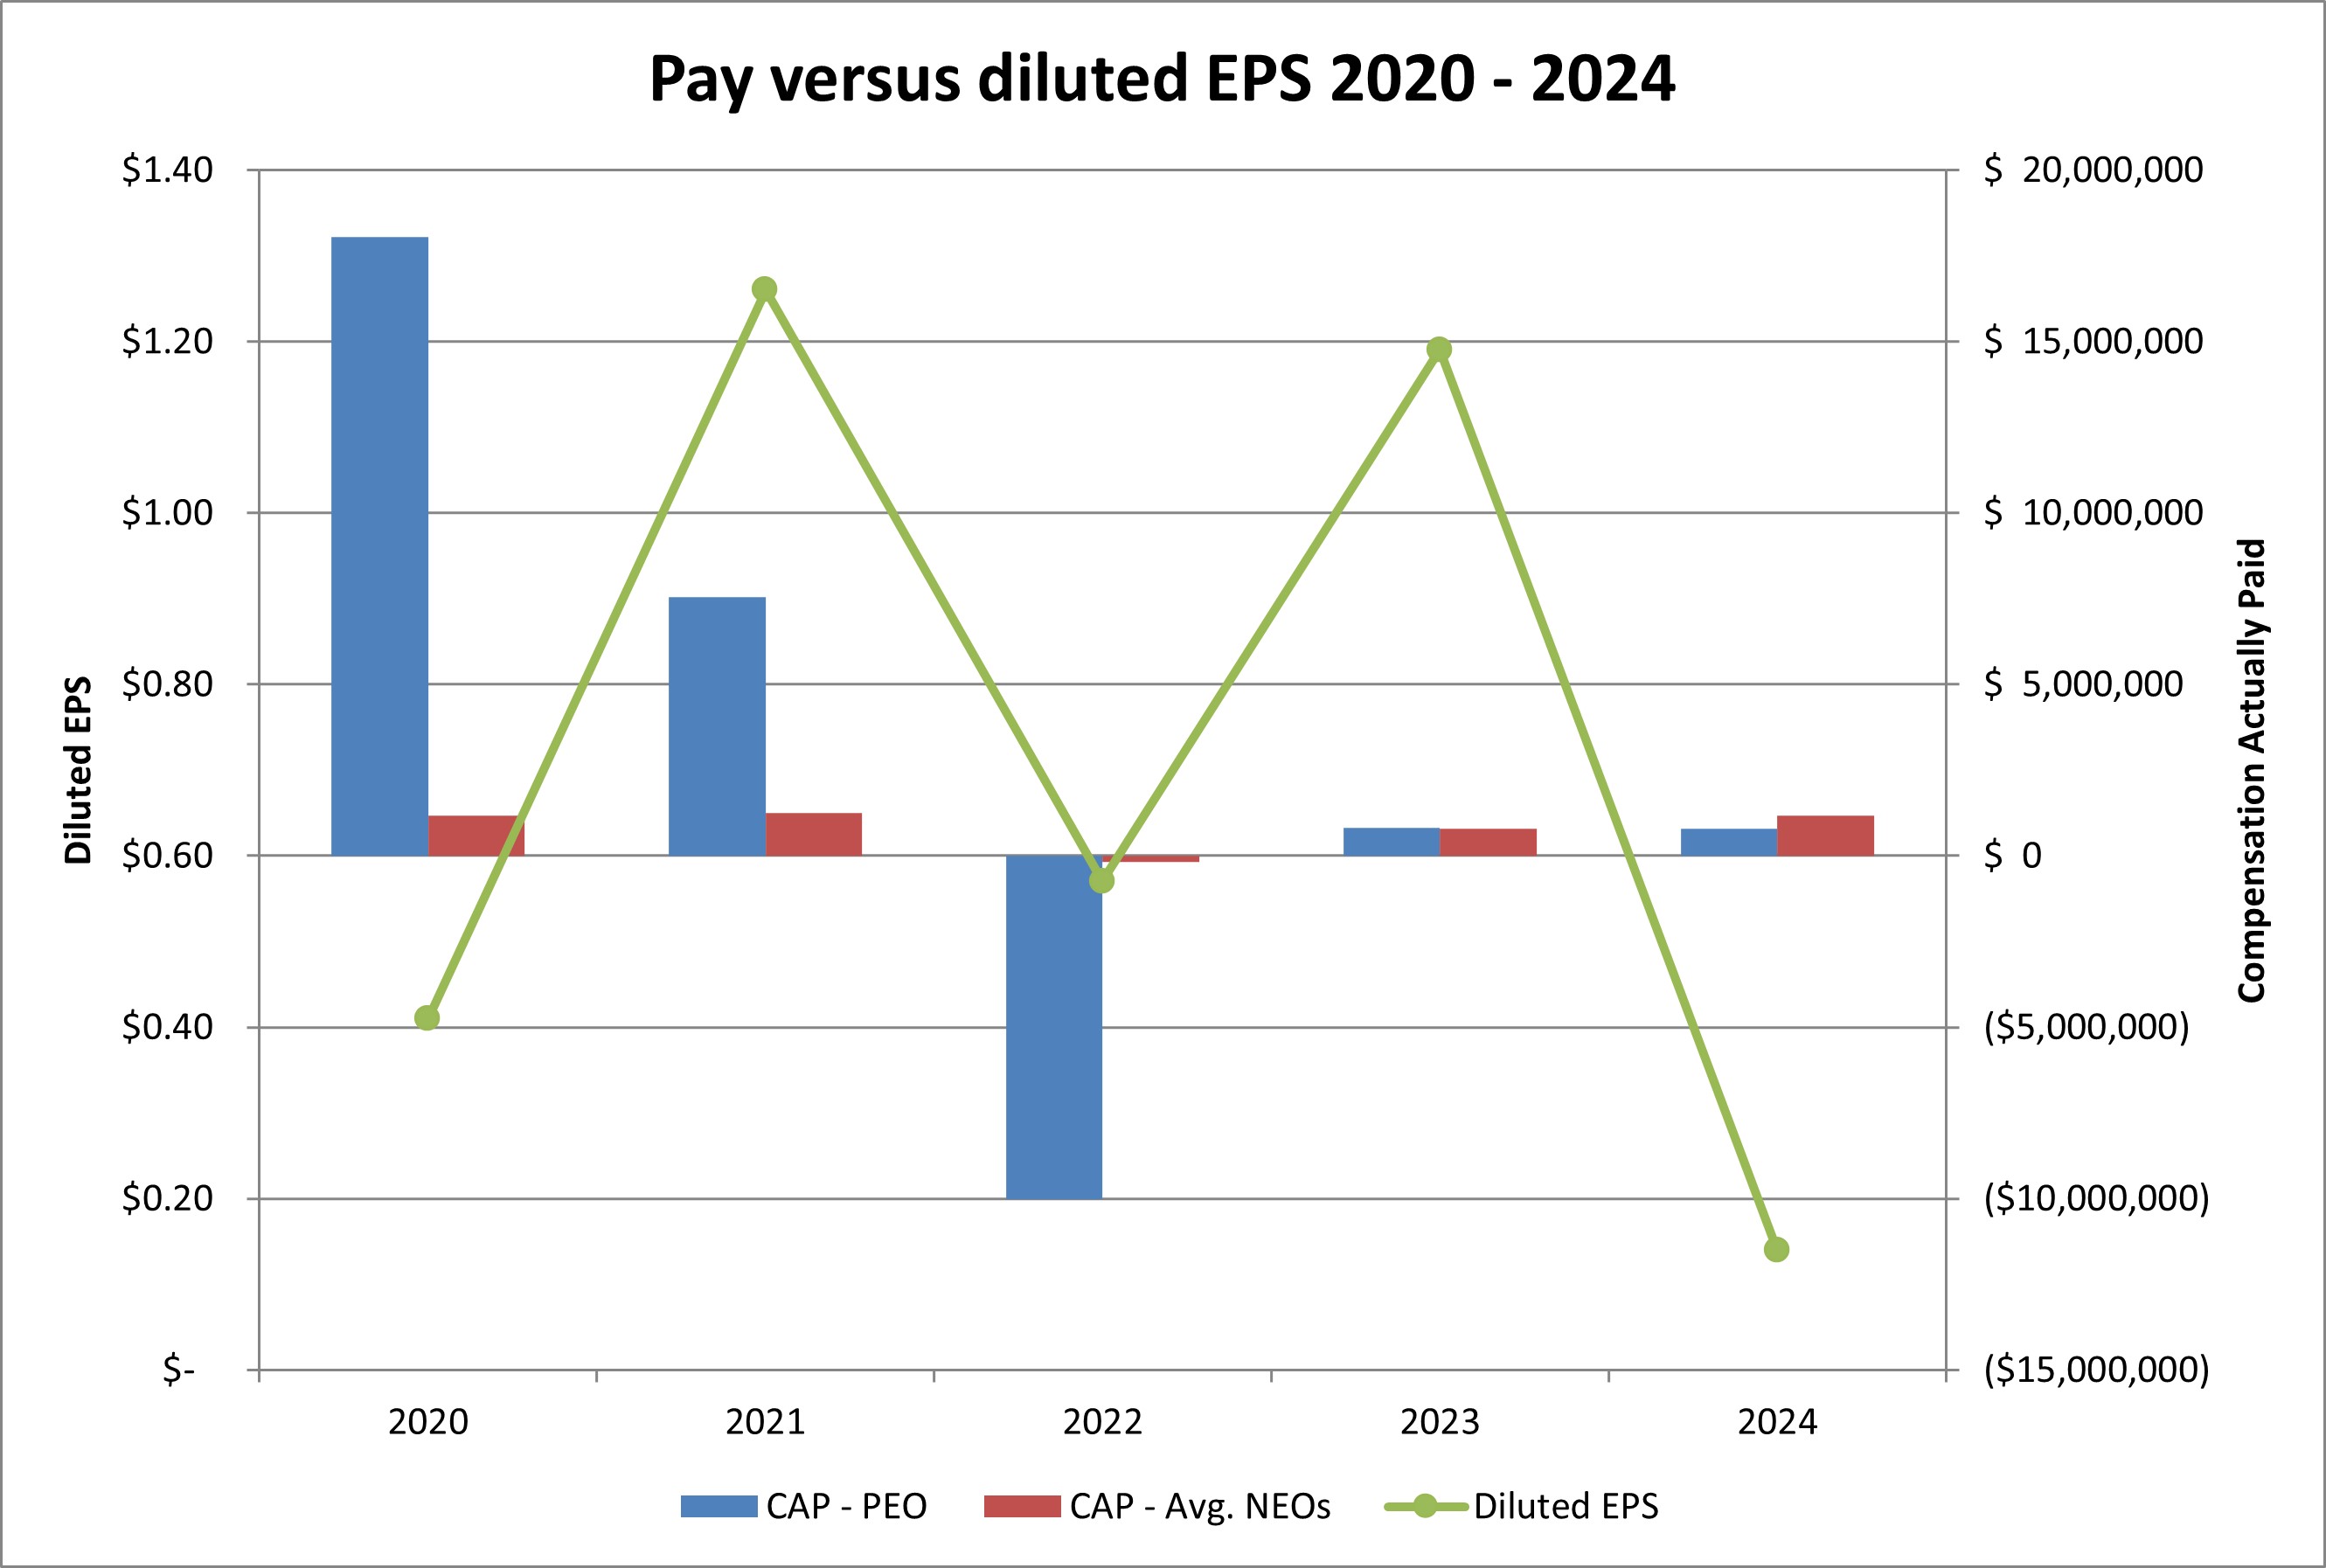
The following table lists diluted EPS and three additional financial performance measures that represent important performance measures for our long-term financial success and that are therefore relevant to discretionary compensation decisions through which we seek to motivate and reward superior performance.
Diluted EPS |
Revenue Growth |
Gross Margin Percentage |
Operating Profit Percentage |