pure in Thousands
Pay Versus Performance
We are required by SEC rules to disclose information regarding the relationship between “compensation actually paid” to our NEOs, including H. Lutnick, who served as our principal executive officer (“PEO”) during the periods described below and the NEOs listed in the following table other than the PEO (the “non-PEO NEOs”), and the financial performance of the Company. The following table sets forth additional compensation information for our PEO and non-PEO NEOs during the periods described below along with total stockholder return (“TSR”), net income, and the “Company Selected Measure,” which we have selected as Total Revenues, each for fiscal years 2020, 2021, 2022, 2023 and 2024. The amounts set forth below under the headings “Compensation Actually Paid to PEO” and “Average Compensation Actually Paid to Non-PEO NEOs” differ significantly from the Summary Compensation Table calculation of compensation, as well as from the way in which we and our Compensation Committee views annual compensation decisions, as discussed in the Compensation Discussion and Analysis. It does not reflect the amount of compensation actually realized or received by our NEOs during the applicable year. Footnote (5) below sets forth the adjustments from the Total Compensation for the PEO and Average Total Compensation for the non-PEO NEOs reported in the Summary Compensation Table to arrive at the values presented for “compensation actually paid” for each of the fiscal years shown.
| Average Summary Compensation | Average Compensation | Value of Initial Fixed $100 Investment Based On: | ||||||||||||||||||||||||||||||
| Year | Summary Compensation Table Total for PEO(1) | Compensation Actually Paid to PEO(1)(5) | Table Total for Non-PEO NEOs(2) | Actually Paid to Non-PEO NEOs(2)(5) | Total Shareholder Return | Peer Group Total Shareholder Return(3) | Net Income (in thousands) | Total
Revenues (in thousands) 4) | ||||||||||||||||||||||||
| (a) | (b) | (c) | (d) | (e) | (f) | (g) | (h) | (i) | ||||||||||||||||||||||||
| 2024 | $ | 20,000,000 | $ | 20,137,500 | $ | 10,253,221 | $ | 16,029,695 | $ | 100.69 | $ | 170.76 | $ | 85,491 | $ | 2,738,502 | ||||||||||||||||
| 2023 | $ | 20,000,000 | $ | 20,192,500 | $ | 16,862,912 | $ | 21,713,811 | $ | 85.30 | $ | 128.18 | $ | 62,375 | $ | 2,470,368 | ||||||||||||||||
| 2022 | $ | 20,000,000 | $ | 20,263,064 | $ | 3,704,691 | $ | 3,683,250 | $ | 60.98 | $ | 106.86 | $ | 112,545 | $ | 2,705,527 | ||||||||||||||||
| 2021 | $ | 35,025,000 | $ | 35,139,752 | $ | 5,281,796 | $ | 5,290,923 | $ | 141.69 | $ | 162.59 | $ | 978,134 | $ | 2,906,443 | ||||||||||||||||
| 2020 | $ | 4,125,000 | $ | 4,135,112 | $ | 3,590,821 | $ | 3,622,332 | $ | 55.06 | $ | 95.11 | $ | 109,277 | $ | 1,904,998 | ||||||||||||||||
| (1) | The PEO was Mr. H. Lutnick during all periods presented. The amount reported for Mr. H. Lutnick for 2021 includes $20,000,000 paid to Mr. H. Lutnick in 2021 in connection with the Lutnick Award which was approved by the Compensation Committee on December 27, 2021 in consideration of his success in managing certain aspects of the Company’s performance as its PEO and Chairman. Mr. H. Lutnick has purchased Newmark Class A common stock with the after-tax proceeds of the initial tranche of the Lutnick Award. The amount reported for Mr. H. Lutnick for 2022-2024 includes $10,000,000 paid to Mr. H. Lutnick for each respective year’s tranche of the Lutnick Award. For further information on the Lutnick Award, see “Compensation Discussion and Analysis — 2021 Lutnick Award.” | |
| (2) | The non-PEO NEOs in fiscal years 2020, 2021, 2022, 2023 and 2024 consisted of Messrs. Gosin, Rispoli and Merkel. Average compensation actually paid to non-PEO NEOs in the table above includes (i) the $5,650,000 aggregate grant date fair value of Mr. Rispoli’s award under the Rispoli Employment Agreement which was presented in its totality in our Summary Compensation Table for calendar year 2022 in accordance with SEC rules but was attributed ratably by the Compensation Committee to Mr. Rispoli’s compensation with respect to each of calendar years 2022, 2023, 2024, 2025, and 2026, (ii) the $40,000,000 aggregate grant date fair value of Mr. Gosin’s award under the Gosin Employment Agreement which was presented in its totality in our Summary Compensation Table for calendar year 2023 in accordance with SEC rules but was attributed ratably by the Compensation Committee to Mr. Gosin’s compensation with respect to each of calendar years 2022, 2023, 2024 and 2025, and (iii) the $20,000,000 aggregate grant date fair value of Mr. Gosin’s award under the 2024 Gosin Employment Agreement which was presented in its totality in our Summary Compensation Table for calendar year 2024 in accordance with SEC rules but was attributed ratably by the Compensation Committee to Mr. Gosin’s compensation with respect to each of calendar years 2025 and 2026 ($5,000,000 attributable to calendar year 2025 and $15,000,000 attributable to calendar year 2026). See “— Employment Agreements” for more information. | |
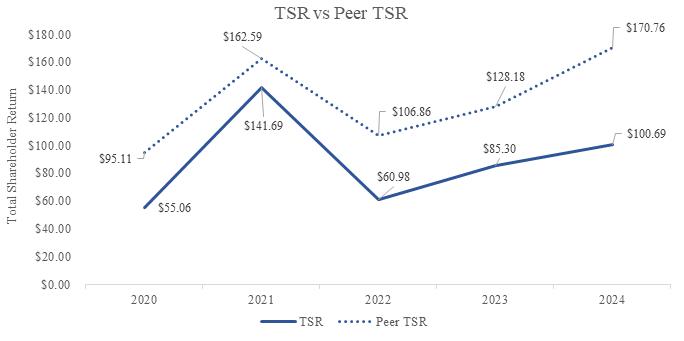
| (3) | The peer group consists of CBRE Group, Inc., Colliers International Group, Inc., Jones Lang LaSalle Incorporated, Savills plc and Cushman & Wakefield plc. The returns of the peer group companies have been weighted according to their U.S. dollar stock market capitalization for purposes of arriving at a peer group average. TSR is calculated as the cumulative total stockholder return, on a gross dividend reinvestment basis, of $100 invested in shares of each of the Company and the peer group invested on December 31, 2019. | |
| (4) | The Company selected Total Revenues to be the most important financial performance measure that is not otherwise required to be disclosed in the table above used by the Company to link compensation actually paid to its NEOs for the most recently completed fiscal year to its performance. While Total Revenues was chosen for this table, our executive compensation programs use a balanced portfolio of measures to drive short and long-term objectives aligned with our strategy and stockholder interests as further described in our Compensation Discussion and Analysis above. | |
| (5) | For each year, “Compensation Actually Paid to PEO” in column (c) and “Average Compensation Actually Paid to Non-PEO NEOs” in column (e) reflect the following adjustments from Total Compensation amounts reported in the Summary Compensation Table (all amounts are averages for the non-PEO NEOs). As described in the footnotes to the Summary Compensation Table, these adjustments do not include Newmark Holdings units that were the subject of dollar-denominated awards under the Incentive Plan included in column (g) of the Summary Compensation Table at full notional value and not subsequently reportable as “Equity Awards.” |
| Adjustments to Determine Compensation Actually Paid to PEO | 2024 | 2023 | 2022 | 2021 | 2020 | |||||||||||||||
| Deduction for change in actuarial present value of accumulated benefit under all defined benefit and actuarial pension plans reported in the Summary Compensation Table | ||||||||||||||||||||
| Increase for aggregate of service cost and prior service cost for all defined benefit and actuarial pension plans reported in the Summary Compensation Table | ||||||||||||||||||||
| Deduction for amounts reported under the “Equity Awards” column in the Summary Compensation Table | $ | (5,025,000 | ) | |||||||||||||||||
| Deduction for amounts reported under the “Option Awards” column in the Summary Compensation Table | ||||||||||||||||||||
| Increase for fair value of stock and option awards granted during the year that are outstanding and unvested as of year-end | ||||||||||||||||||||
| Increase/deduction for change in fair value as of year-end (from prior year-end) of stock and option awards granted in any prior year that were outstanding and unvested as of year-end | ||||||||||||||||||||
| Increase for fair value as of vesting date of stock and option awards granted and vested in the same year | $ | 5,025,000 | ||||||||||||||||||
| Increase/deduction for change in fair value as of vesting date (from prior year-end) of stock and option awards granted in any prior year for which all vesting conditions were satisfied during the year or at year-end | ||||||||||||||||||||
| Deduction for fair value as of prior year-end of stock and option awards granted in any prior year that were forfeited during the year | ||||||||||||||||||||
| Increase for dollar value of any dividends or other earnings paid on stock or option awards in the year prior to the vesting date that are not otherwise included in total compensation for the year | $ | 137,500 | $ | 192,500 | $ | 263,063.78 | $ | 114,752.04 | $ | 10,111.72 | ||||||||||
| Total Adjustments | $ | 137,500 | $ | 192,500 | $ | 263,063.78 | $ | 114,752.04 | $ | 10,111.72 | ||||||||||
| Adjustments to Determine Average Compensation Actually Paid to Non-PEO NEOs |
2024 | 2023 | 2022 | 2021 | 2020 | |||||||||||||||
| Deduction for change in actuarial present value of accumulated benefit under all defined benefit and actuarial pension plans reported in the Summary Compensation Table | ||||||||||||||||||||
| Increase for aggregate of service cost and prior service cost for all defined benefit and actuarial pension plans reported in the Summary Compensation Table | ||||||||||||||||||||
| Deduction for amounts reported under the “Equity Awards” column in the Summary Compensation Table | $ | (6,666,667 | ) | $ | (13,333,333 | ) | $ | (1,883,333 | ) | |||||||||||
| Deduction for amounts reported under the “Option Awards” column in the Summary Compensation Table | ||||||||||||||||||||
| Increase for fair value of stock and option awards granted during the year that are outstanding and unvested as of year-end | $ | 7,237,287 | $ | 16,778,558 | $ | 1,860,833 | ||||||||||||||
| Increase/deduction for change in fair value as of year-end (from prior year-end) of stock and option awards granted in any prior year that were outstanding and unvested as of year-end | $ | 3,430,274 | $ | 733,258 | ||||||||||||||||
| Increase for fair value as of vesting date of stock and option awards granted and vested in the same year | $ | 645,924 | ||||||||||||||||||
| Increase/deduction for change in fair value as of vesting date (from prior year-end) of stock and option awards granted in any prior year for which all vesting conditions were satisfied during the year or at year-end | $ | 1,423,984 | $ | (7,336 | ) | |||||||||||||||
| Deduction for fair value as of prior year-end of stock and option awards granted in any prior year that were forfeited during the year | ||||||||||||||||||||
| Increase for dollar value of any dividends or other earnings paid on stock or option awards in the year prior to the vesting date that are not otherwise included in total compensation for the year | $ | 351,596 | $ | 33,829 | $ | 1,059 | $ | 9,127 | $ | 31,511 | ||||||||||
| Total Adjustments | $ | 5,776,474 | $ | 4,850,899 | $ | (21,441 | ) | $ | 9,127 | $ | 31,511 | |||||||||
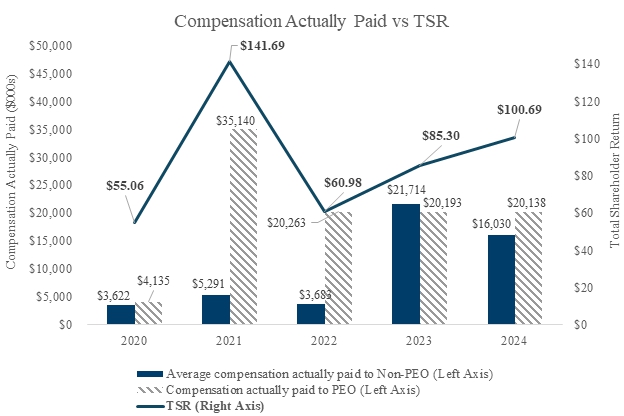
TSR. The graphs below show the relationship between (1) “compensation actually paid” to our PEO and the average of “compensation actually paid” to our non-PEO NEOs and our cumulative TSR and (2) our cumulative TSR and peer group TSR, over the five fiscal years ended December 31, 2024.
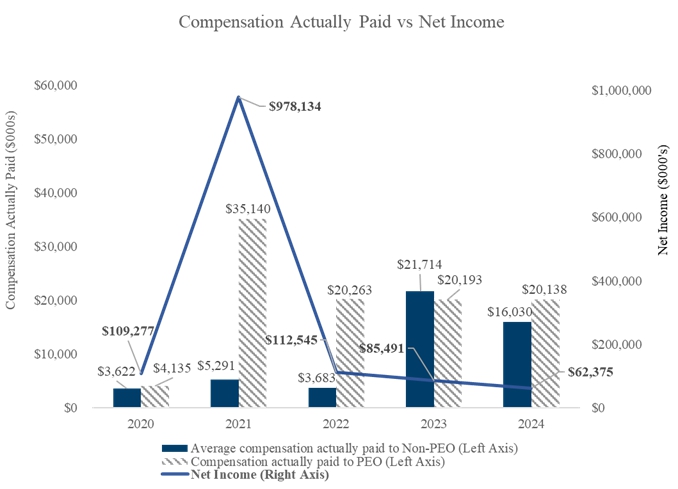
Net Income. The graph below shows the relationship between “compensation actually paid” to our PEO and the average of the “compensation actually paid” to our non-PEO NEOs and net income, as reported in our consolidated financial statements, over the five fiscal years ended December 31, 2024.
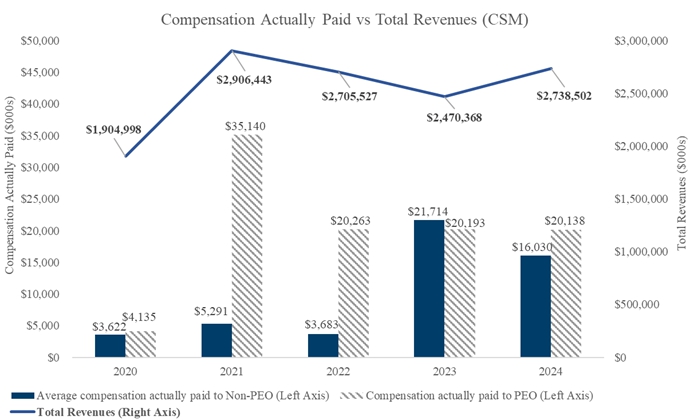
Company Selected Measure (CSM). The graph below shows the relationship between “compensation actually paid” to our PEO and the average of the “compensation actually paid” to our non-PEO NEOs and our Total Revenues over the five fiscal years ended December 31, 2024.
Performance Measures Tabular List
The table below lists our most important performance measures, including the Company Selected Measure, used to link “compensation actually paid” for our NEOs to Company performance for the fiscal year ended December 31, 2024. The performance measures included in this table are not ranked by relative importance.
Performance Measures
| Total Revenues |
| Pre-tax Adjusted Earnings |
| Origination and Mortgage Broker Market Share |
| Catalyst Transactions and Hires, Acquisitions, and Strategy Development |
| Fees from Management Services, Servicing, and Other |
| Retentive Compensation Considerations |
| Significant Client Transaction Volumes |
| [1] | The PEO was Mr. H. Lutnick during all periods presented. The amount reported for Mr. H. Lutnick for 2021 includes $20,000,000 paid to Mr. H. Lutnick in 2021 in connection with the Lutnick Award which was approved by the Compensation Committee on December 27, 2021 in consideration of his success in managing certain aspects of the Company’s performance as its PEO and Chairman. Mr. H. Lutnick has purchased Newmark Class A common stock with the after-tax proceeds of the initial tranche of the Lutnick Award. The amount reported for Mr. H. Lutnick for 2022-2024 includes $10,000,000 paid to Mr. H. Lutnick for each respective year’s tranche of the Lutnick Award. For further information on the Lutnick Award, see “Compensation Discussion and Analysis — 2021 Lutnick Award.” |
| [2] | For each year, “Compensation Actually Paid to PEO” in column (c) and “Average Compensation Actually Paid to Non-PEO NEOs” in column (e) reflect the following adjustments from Total Compensation amounts reported in the Summary Compensation Table (all amounts are averages for the non-PEO NEOs). As described in the footnotes to the Summary Compensation Table, these adjustments do not include Newmark Holdings units that were the subject of dollar-denominated awards under the Incentive Plan included in column (g) of the Summary Compensation Table at full notional value and not subsequently reportable as “Equity Awards.” |
| [3] | The non-PEO NEOs in fiscal years 2020, 2021, 2022, 2023 and 2024 consisted of Messrs. Gosin, Rispoli and Merkel. Average compensation actually paid to non-PEO NEOs in the table above includes (i) the $5,650,000 aggregate grant date fair value of Mr. Rispoli’s award under the Rispoli Employment Agreement which was presented in its totality in our Summary Compensation Table for calendar year 2022 in accordance with SEC rules but was attributed ratably by the Compensation Committee to Mr. Rispoli’s compensation with respect to each of calendar years 2022, 2023, 2024, 2025, and 2026, (ii) the $40,000,000 aggregate grant date fair value of Mr. Gosin’s award under the Gosin Employment Agreement which was presented in its totality in our Summary Compensation Table for calendar year 2023 in accordance with SEC rules but was attributed ratably by the Compensation Committee to Mr. Gosin’s compensation with respect to each of calendar years 2022, 2023, 2024 and 2025, and (iii) the $20,000,000 aggregate grant date fair value of Mr. Gosin’s award under the 2024 Gosin Employment Agreement which was presented in its totality in our Summary Compensation Table for calendar year 2024 in accordance with SEC rules but was attributed ratably by the Compensation Committee to Mr. Gosin’s compensation with respect to each of calendar years 2025 and 2026 ($5,000,000 attributable to calendar year 2025 and $15,000,000 attributable to calendar year 2026). See “— Employment Agreements” for more information. |
| [4] | The peer group consists of CBRE Group, Inc., Colliers International Group, Inc., Jones Lang LaSalle Incorporated, Savills plc and Cushman & Wakefield plc. The returns of the peer group companies have been weighted according to their U.S. dollar stock market capitalization for purposes of arriving at a peer group average. TSR is calculated as the cumulative total stockholder return, on a gross dividend reinvestment basis, of $100 invested in shares of each of the Company and the peer group invested on December 31, 2019. |
| [5] | The Company selected Total Revenues to be the most important financial performance measure that is not otherwise required to be disclosed in the table above used by the Company to link compensation actually paid to its NEOs for the most recently completed fiscal year to its performance. While Total Revenues was chosen for this table, our executive compensation programs use a balanced portfolio of measures to drive short and long-term objectives aligned with our strategy and stockholder interests as further described in our Compensation Discussion and Analysis above. |