Pay vs Performance Disclosure - USD ($)
Dec. 31, 2024
Dec. 31, 2023
Dec. 31, 2022
| Reporting Period | Summary Compensation Table total for CEO ($) | Compensation actually paid to CEO (1) ($) | Average Summary Compensation Table Total for non-CEO NEOs (2) ($) | Average compensation actually paid to non-CEO NEOs (1) ($) | Value of initial fixed $100 investment based on total shareholder return (3) ($) | Net income (loss) (4) ($) | |||||||||||||||||||||||||||||||||||
| 2024 | $ | 1,563,800 | $ | 1,563,800 | $ | 972,749 | $ | 1,238,606 | $ | 167 | $ | 14,560,356 | |||||||||||||||||||||||||||||
| 2023 | 1,363,200 | 1,363,200 | 906,211 | 930,645 | 91 | 7,783,219 | |||||||||||||||||||||||||||||||||||
| 2022 | 1,112,200 | 1,112,200 | 1,052,456 | 965,944 | 88 | 7,346,858 | |||||||||||||||||||||||||||||||||||
(1) | Reflects "Summary Compensation Table" total (or average total for non-CEO NEOs) adjusted as set forth below in the Reconciliation of Compensation Actually Paid Table. Fair value or change in fair value, as applicable, of equity awards included in the compensation actually paid are estimated using assumptions and methodologies substantially consistent with those used at grant. These are consistent with the principles in ASC 718 and described further in our Annual Report on Form 10-K. | ||||||||||||||||||||||||||||||||||||||||
(2) | Reflects the average compensation amounts reported in the “Summary Compensation Table” for our NEOs (excluding the Chief Executive Officer), which included the following executive officers: 2024 (Christopher M. Guthrie and Timothy J. Steffan); 2023 (Christopher M. Guthrie and Timothy J. Steffan); 2022 (Christopher M. Guthrie and Timothy J. Steffan). | ||||||||||||||||||||||||||||||||||||||||
(3) | Reflects the total shareholder return (“TSR”) of a $100 investment in the Company from the beginning of fiscal year 2022 through end of each fiscal year presented. | ||||||||||||||||||||||||||||||||||||||||
(4) | Reflects “Net income (loss)” in the Company’s consolidated statements of operations for the fiscal years ended December 31, 2024, 2023 and 2022. On March 31, 2022, the Company completed the sale of Comstock Environmental Services, LLC ("CES"), a wholly owned subsidiary that is reflected as a discontinued operation for the period. Net income from continuing operations for the fiscal years ended December 31, 2022 was $7.7 million. | ||||||||||||||||||||||||||||||||||||||||
| CEO | Non-CEO NEOs (Average) | |||||||||||||||||||||||||||||||||||||
| 2024 | 2023 | 2022 | 2024 | 2023 | 2022 | |||||||||||||||||||||||||||||||||
| Summary Compensation Table (SCT) total | $ | 1,563,800 | $ | 1,363,200 | $ | 1,112,200 | $ | 972,749 | $ | 906,211 | $ | 1,052,456 | ||||||||||||||||||||||||||
Deduct: SCT value of equity awards | — | — | — | (84,261) | (45,055) | (46,457) | ||||||||||||||||||||||||||||||||
Add: Equity award adjustments: | ||||||||||||||||||||||||||||||||||||||
Period-end fair value of equity awards granted during the period (1) | — | — | — | 147,993 | 48,320 | 44,413 | ||||||||||||||||||||||||||||||||
Change in fair value of outstanding and unvested equity awards (1) | — | — | — | 192,629 | 14,090 | (71,598) | ||||||||||||||||||||||||||||||||
Change in fair value of equity awards that vested during the period (2) | — | — | — | 9,496 | 7,079 | (12,870) | ||||||||||||||||||||||||||||||||
| Compensation actually paid | $ | 1,563,800 | $ | 1,363,200 | $ | 1,112,200 | $ | 1,238,606 | $ | 930,645 | $ | 965,944 | ||||||||||||||||||||||||||
(1) | Calculated using closing prices of CHCI common stock as of the last day of the respective fiscal years: $8.08 for 2024, $4.43 for 2023, and $4.25 for 2022 | |||||||||||||||||||||||||||||||||||||
(2) | Calculated by comparing closing prices of CHCI common stock on the various vesting date(s) to the closing price as of the prior fiscal year end. | |||||||||||||||||||||||||||||||||||||
Relationship Between Pay and Performance
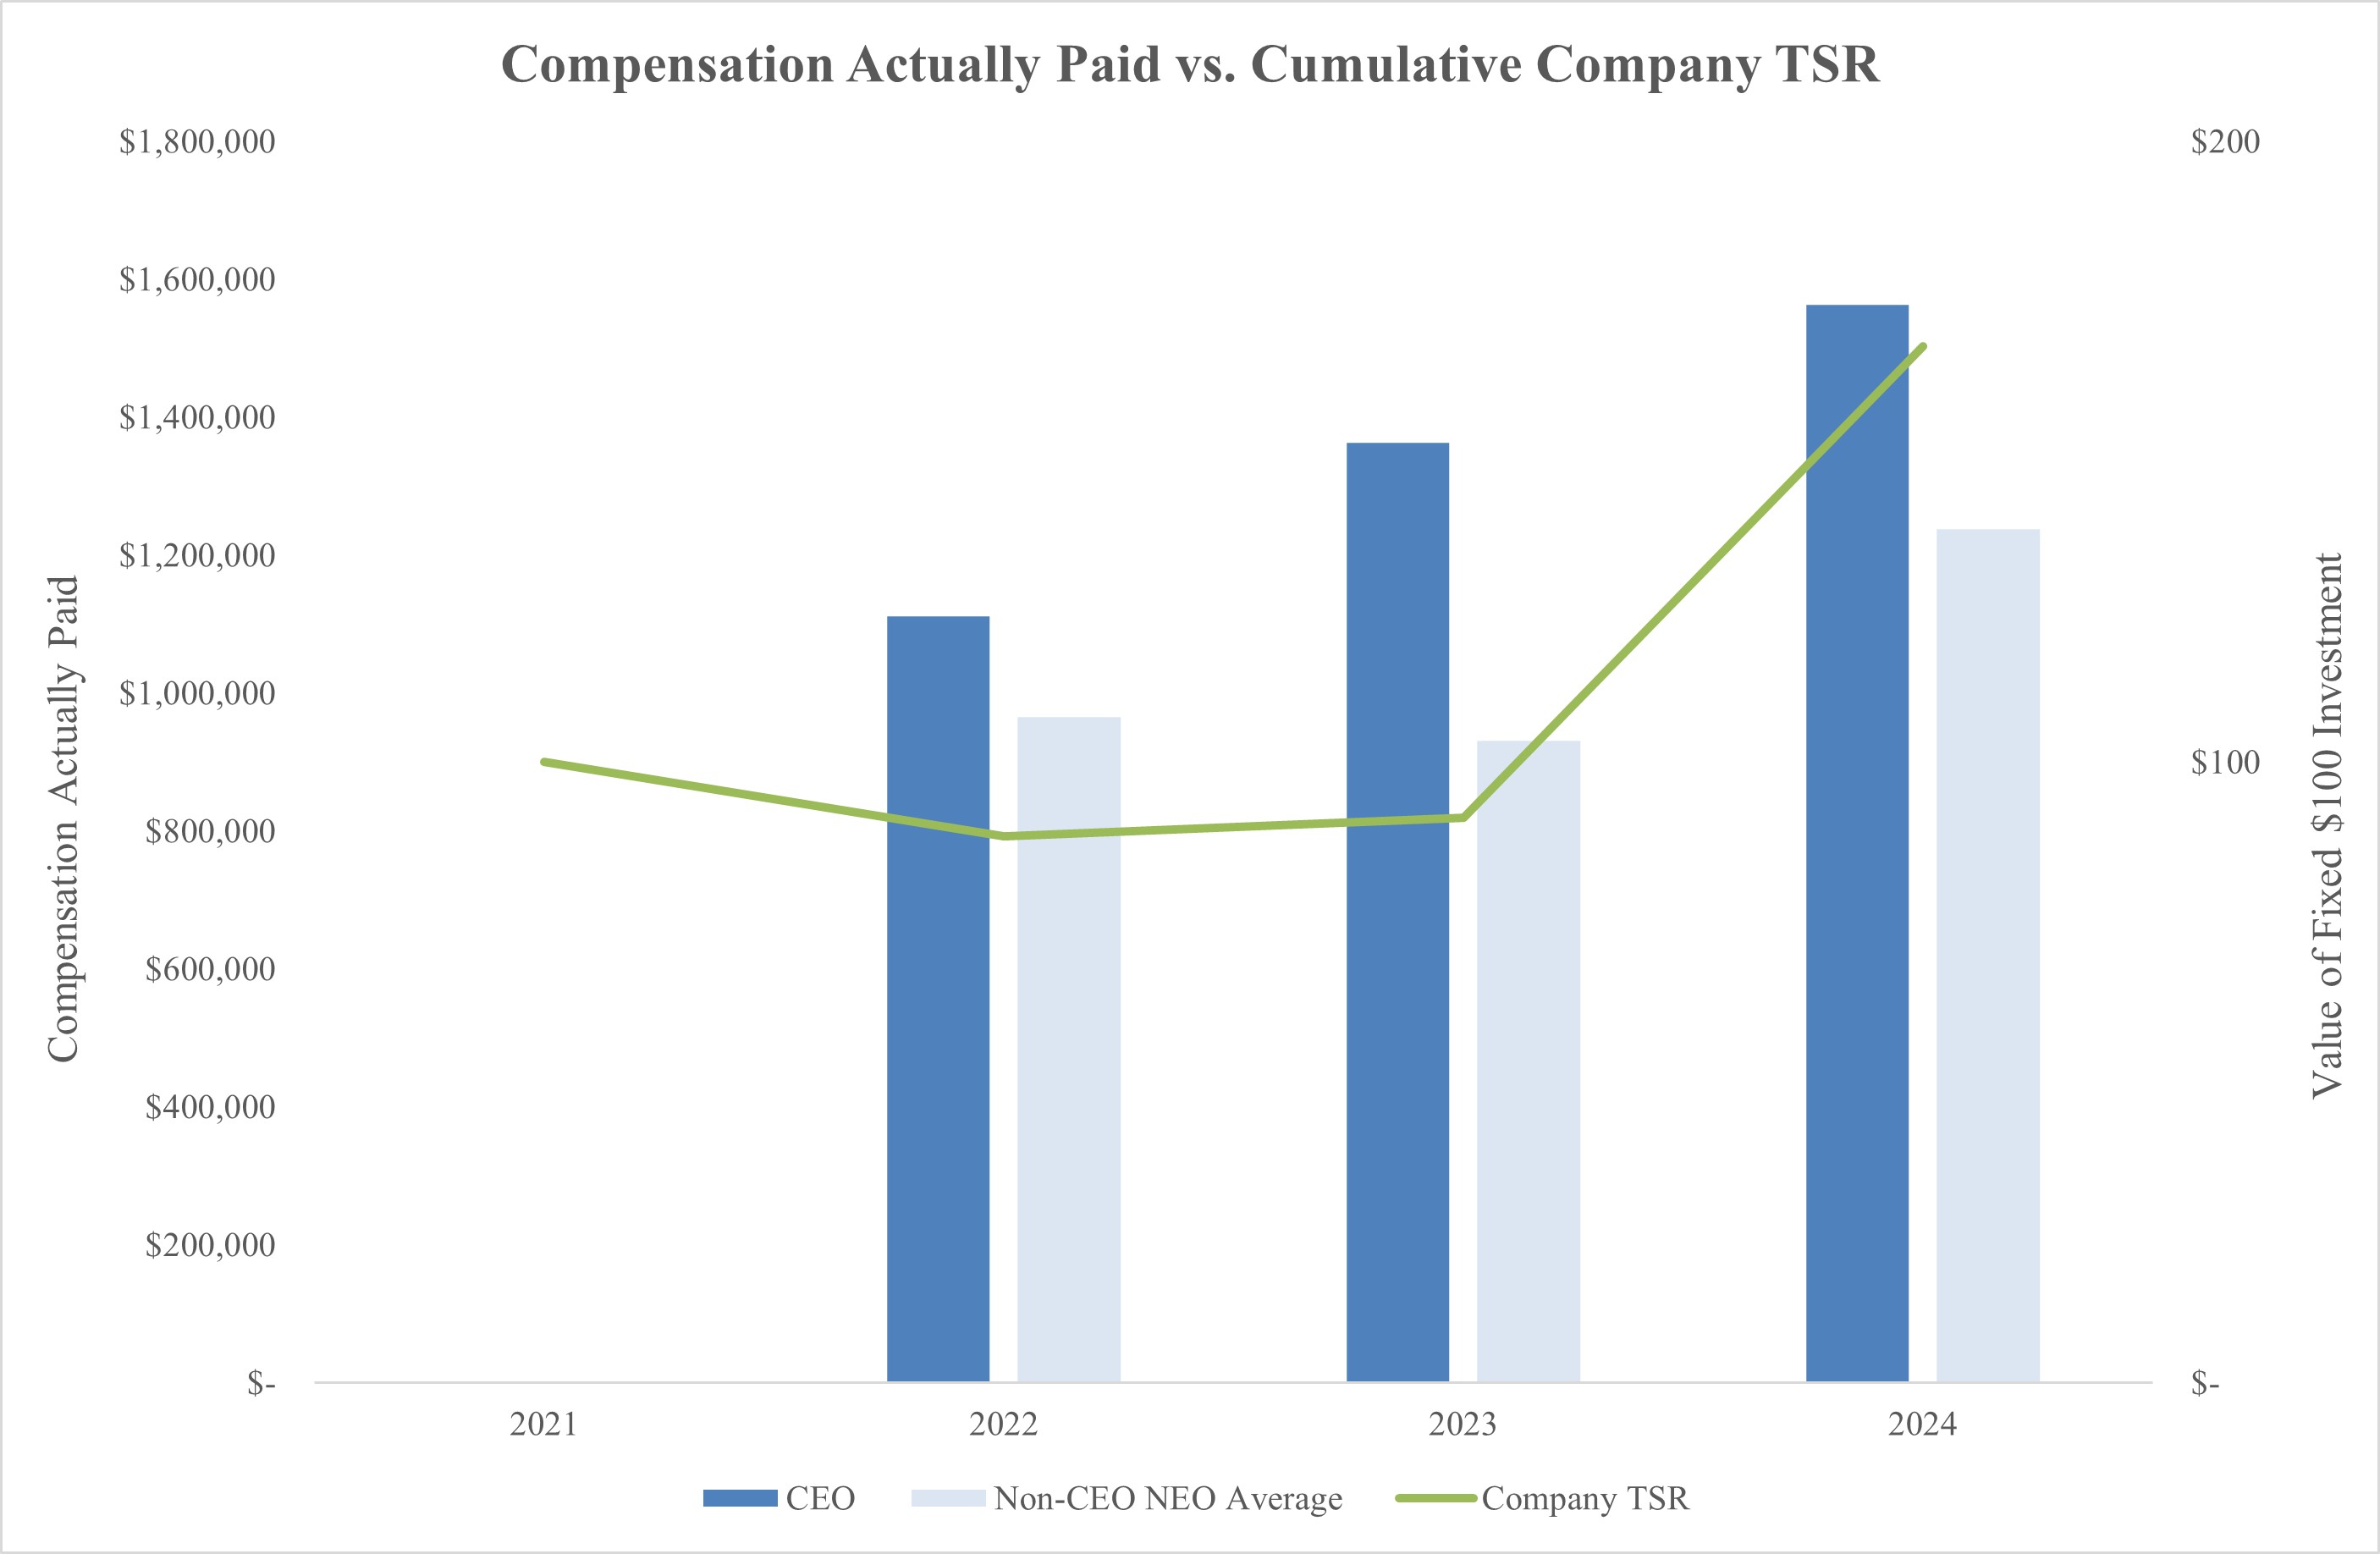
Below are graphs showing the relationship of “compensation actually paid” (as defined by the SEC) and other information contained in the pay-versus-performance table. There were no adjustments required to be made to CEO compensation, as Mr. Clemente's compensation for the covered periods shown was entirely based in cash and he had no unvested equity awards outstanding during any of the covered periods.
Relationship Between Compensation Actually Paid and TSR
Compensation actually paid to NEOs has increased in line with total shareholder return due to the impact of the revaluation of unvested equity awards and a significantly higher stock price as of December 31, 2024 than in prior years.
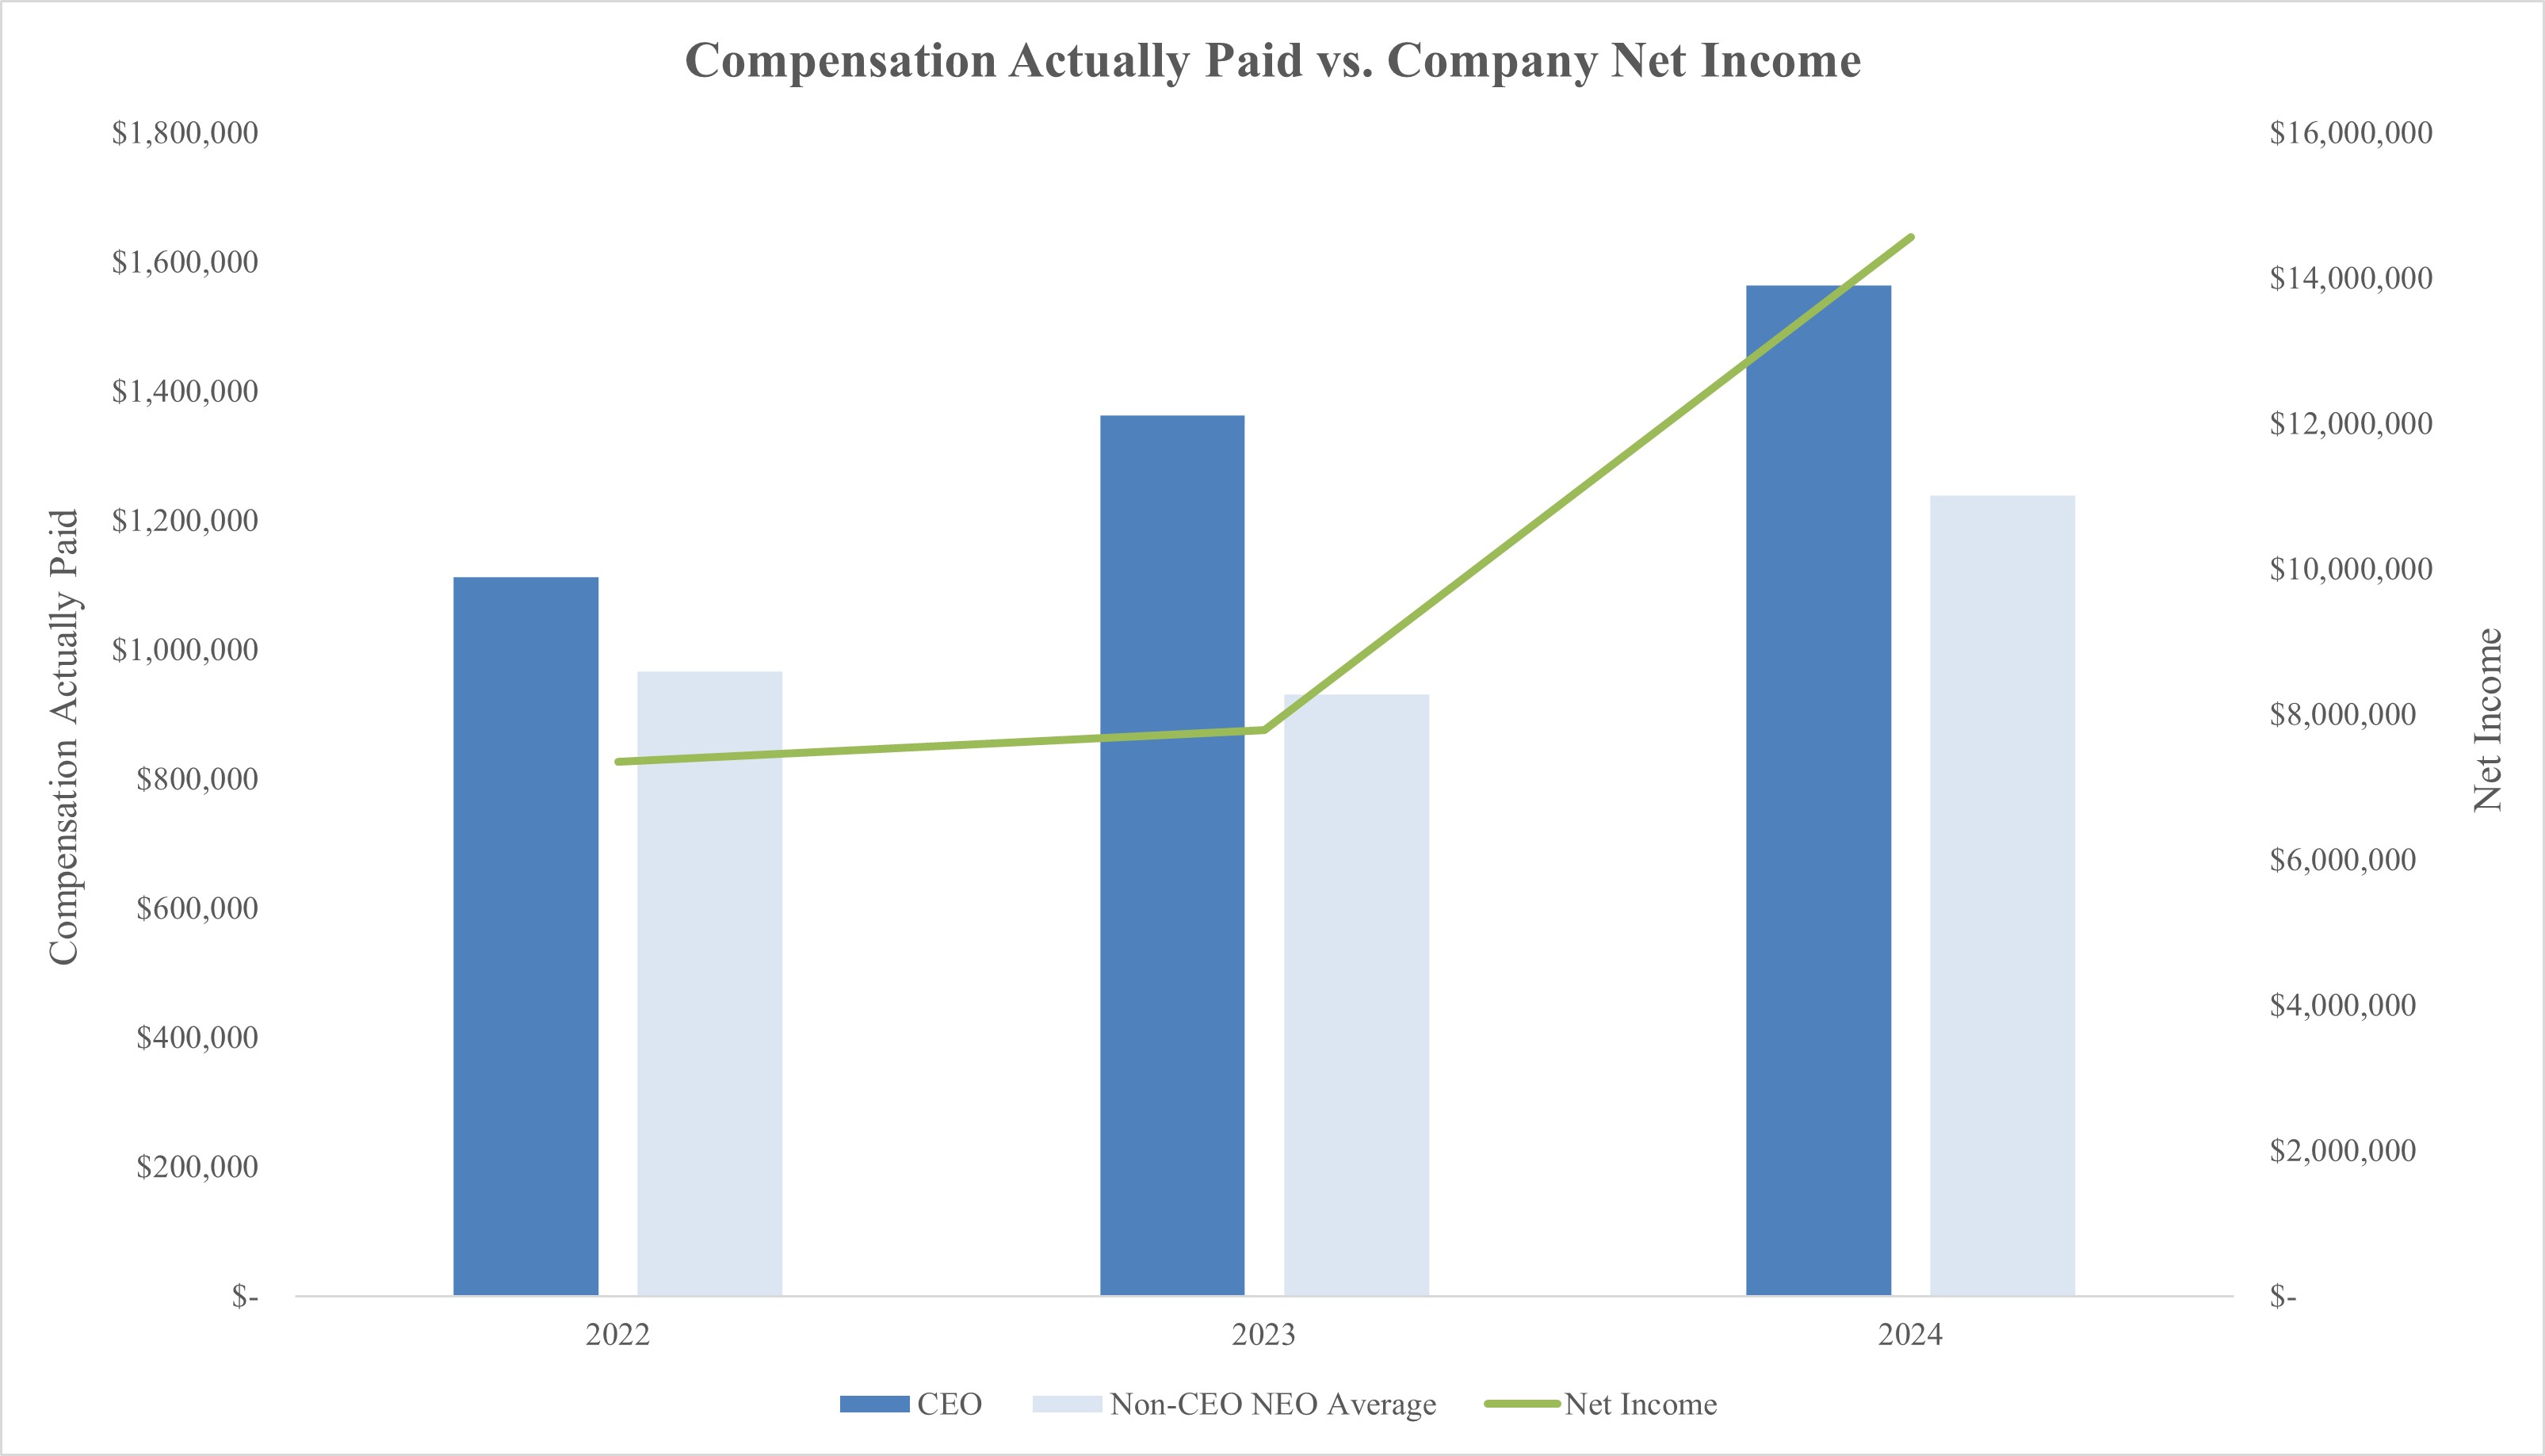
Relationship Between Compensation Actually Paid and Net Income
Compensation actually paid to NEOs has increased in line with net income, as the Company generally utilizes both net income and Adjusted EBITDA as key performance metrics when determining executive compensation and both metrics have increased from 2022 through 2024.
Relationship Between Pay and Performance
Below are graphs showing the relationship of “compensation actually paid” (as defined by the SEC) and other information contained in the pay-versus-performance table. There were no adjustments required to be made to CEO compensation, as Mr. Clemente's compensation for the covered periods shown was entirely based in cash and he had no unvested equity awards outstanding during any of the covered periods.
Relationship Between Compensation Actually Paid and TSR
Compensation actually paid to NEOs has increased in line with total shareholder return due to the impact of the revaluation of unvested equity awards and a significantly higher stock price as of December 31, 2024 than in prior years.
Reflects the total shareholder return (“TSR”) of a $100 investment in the Company from the beginning of fiscal year 2022 through end of each fiscal year presented.
Reflects “Net income (loss)” in the Company’s consolidated statements of operations for the fiscal years ended December 31, 2024, 2023 and 2022. On March 31, 2022, the Company completed the sale of Comstock Environmental Services, LLC ("CES"), a wholly owned subsidiary that is reflected as a discontinued operation for the period. Net income from continuing operations for the fiscal years ended December 31, 2022 was $7.7 million.