This table describes the fees and expenses that you may pay if you buy and hold shares of the Fund.
Shareholder Fees |
TFA Tactical Income Fund
TFA Tactical Income Fund Class I
USD ($)
|
|---|---|
| Shareholder Fees (fees paid directly from your investment) | none |
Annual Fund Operating Expenses |
TFA Tactical Income Fund
TFA Tactical Income Fund Class I
|
|
|---|---|---|
| Management Fees | 1.30% | |
| Shareholder Services Fee | 0.15% | [1] |
| Other Expenses | 1.03% | |
| Acquired Fund Fees and Expenses | 0.58% | [2] |
| Total Annual Fund Operating Expenses | 3.06% | |
| Fee Waiver and/or Expense Reimbursement | (0.34%) | [2],[3] |
| Total Annual Fund Operating Expenses After Fee Waiver and/or Expense Reimbursement | 2.72% | [2] |
| [1] | The Fund has implemented a Shareholder Services Plan on behalf of its I Shares that allows it to make payments of up to 0.15% to financial intermediaries and other service providers in return for shareholder servicing and maintenance of shareholder accounts. |
| [2] | |
| [3] | Tactical Fund Advisors, LLC (the “Adviser”) has contractually agreed to reduce its fees and to reimburse expenses, at least through April 30, 2026, to ensure that total annual Fund operating expenses after fee waivers and reimbursements (exclusive of any front-end or contingent deferred loads, interest, borrowing expenses, shareholder service fees pursuant to a Shareholder Service Plan, taxes, acquired fund fees and expenses, brokerage fees and commissions, dividend expenses on short sales, litigation expenses, expenditures which are capitalized in accordance with generally accepted accounting principles and, other extraordinary expenses not incurred in the ordinary course of such Fund’s business) will not exceed 1.99% of the Fund’s average daily net assets. These fee waivers and expense reimbursements are subject to recoupment from the Fund within three years of the date on which the waiver or reimbursement occurs, provided that the recoupment payments do not cause Total Annual Fund Operating Expenses (after the repayment is taken into account) to exceed (i) the expense limitation then in effect, if any, and (ii) the expense limitation in effect at the time the expenses to be repaid were incurred. This agreement may be terminated only by the Board of Trustees (the “Board”), on 60 days’ written notice to the Fund’s Adviser. |
This Example is intended to help you compare the cost of investing in the Fund with the cost of investing in other mutual funds.
The Example assumes that you invest $10,000 in the Fund for the time periods indicated and then redeem all your shares at the end of those periods. The Example also assumes that your investment has a 5% return each year and that the Fund’s operating expenses remain the same. The Example further assumes that the Fund’s operating expense limitation agreement will only be in place for the term specified above. Although your actual costs may be higher or lower, based upon these assumptions your costs would be:
Expense Example |
Expense Example, with Redemption, 1 Year |
Expense Example, with Redemption, 3 Years |
Expense Example, with Redemption, 5 Years |
Expense Example, with Redemption, 10 Years |
|---|---|---|---|---|
| TFA Tactical Income Fund | TFA Tactical Income Fund Class I | USD ($) | 275 | 913 | 1,576 | 3,350 |
The Fund pays transaction costs, such as commissions, when it buys and sells securities (or “turns over” its portfolio). A higher portfolio turnover may indicate higher transaction costs and may result in higher taxes when Fund shares are held in a taxable account. These costs, which are not reflected in annual fund operating expenses or in the Example, affect the Fund’s performance. During the fiscal year ended December 31, 2024, the Fund’s portfolio turnover rate was 537.33%.
The Fund’s adviser, Tactical Fund Advisors, LLC (the “Adviser”), delegates the daily management of the Fund’s assets to multiple sub-advisers. The Adviser is responsible for the overall management of the Fund, overseeing the Fund’s sub-advisers and determining the amount of the Fund’s assets that each sub-adviser will manage, which will vary from time to time.
The Fund pursues its objective by investing, under normal circumstances, at least 80% of its net assets in income-producing securities. These securities include both debt and equity securities. Income-producing debt securities include sovereign, municipal, and corporate debt securities, and other investment companies, including exchange-traded funds (“ETFs”) that invest in such securities. Income-producing equity securities include preferred stock, dividend-paying equity securities, and other investment companies, including ETFs, that invest in such securities. The Fund may invest in debt securities or ETFs of any credit quality and with any duration, including high-yield bonds (commonly known as “junk bonds”). High yield bonds are securities that are generally rated below investment grade by the primary rating agencies (BBB- or lower by S&P and Baa3 or lower by Moody’s). The Fund normally invests at least 50% of its total assets in ETFs that invest in both domestic and foreign U.S. Dollar-denominated securities, including leveraged fixed-income ETFs. The blend of domestic versus foreign securities will change over time according to the sub-advisers’ dynamic strategies, with no pre-set limitation on the percentage balance at any one time.
The Fund’s sub-advisers invest the assets delegated to them by the Adviser as follows:
Synergy Asset Management, LLC (“Synergy”) – Synergy invests its allocation of the Fund’s assets via a portfolio management approach known as Focused Tactical Allocation. This strategy seeks to position assets to capitalize on the prevailing market factors and conditions. Diverging from the conventional Modern Portfolio Theory, the strategy is constructed upon an innovative mathematical fusion of technical and fundamental insights. The strategy is consistently monitored and rests on the foundation of diligent and continuous assessment of global markets. The rebalancing process enables the strategy to adapt to changing market conditions while maintaining a disciplined approach to asset allocation.
Heritage Capital Advisors, LLC (“Heritage”) – Heritage invests its allocation of the Fund’s assets in a diversified portfolio of global fixed income and equity securities providing global fixed income-oriented and equity exposure. Multiple allocation strategies are employed to enhance portfolio income and diversification.
The Fund expects to have a high portfolio turnover, which may result in higher transactional costs.
The Fund was reorganized on August 20, 2021, from a series of Collaborative Investment Series Trust, a Delaware statutory trust, to a series of Tactical Investment Series Trust, a Delaware statutory trust (the “Reorganization”).
The bar chart and table that follow provide some indication of the risks of investing in the Fund by showing changes in the Fund’s performance yearly and by showing how the Fund’s average annual total returns for one year and since inception compare with those of a broad-based securities market index. How the Fund has performed in the past (before and after taxes) is not necessarily an indication of how the Fund will perform in the future. Updated performance information, current through the most recent month end, is available by calling (833) 974-3787 or by visiting the Fund’s website at www.tfafunds.com.
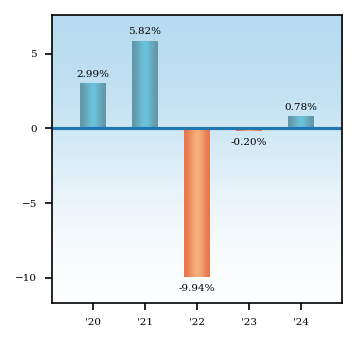
| Quarterly Returns During This Time Period | |
| Highest: | % (quarter ended ) |
| Lowest: | % (quarter ended ) |
Average Annual Total Returns - TFA Tactical Income Fund |
1 Year |
5 Years |
Since Inception |
Inception Date |
|||
|---|---|---|---|---|---|---|---|
| TFA Tactical Income Fund Class I | 0.78% | (0.26%) | 0.57% | Jun. 10, 2019 | |||
| TFA Tactical Income Fund Class I | After Taxes on Distributions | (0.08%) | (1.69%) | (0.78%) | Jun. 10, 2019 | |||
| TFA Tactical Income Fund Class I | After Taxes on Distributions and Sales | 0.50% | (0.73%) | (0.04%) | Jun. 10, 2019 | |||
| Bloomberg Barclays U.S. Aggregate Bond Index | 1.25% | [1] | (0.33%) | [1] | 0.34% | [1] | Jun. 10, 2019 |
| [1] | The Bloomberg Barclays U.S. Aggregate Bond Index is a widely-used indicator of the bond market. The index is market capitalization-weighted and is made up of U.S. bonds that are primarily investment grade and has a greater number of securities than is found in the Fund’s portfolio. Individuals cannot invest directly in the index; however, an individual can invest in exchange-traded funds or other investment vehicles that attempt to track the performance of a benchmark index. The annual total returns included for the above Fund are net of the total annual operating expenses for the Fund, while no annual operating expenses are deducted for the Bloomberg Barclays U.S. Aggregate Bond Index. |
After-tax returns are calculated using the historical highest individual federal marginal income tax rates and do not reflect the impact of state and local taxes. Actual after-tax returns depend on an investor’s tax situation and may differ from those shown above. After-tax returns shown are not relevant to investors who hold their shares through tax-deferred arrangements, such as a 401(k) plan or an individual retirement account (“IRA”). Return After Taxes on Distributions and Sale of Fund Shares may be higher than other returns for the same period due to a tax benefit of realizing a capital loss on the same of Fund shares.
Management Risk: The portfolio managers’ judgments about the attractiveness, value and potential appreciation of particular stocks or other securities in which the Fund invests or sells short may prove to be incorrect and there is no guarantee that the portfolio managers’ judgment will produce the desired results. Additionally, the Adviser’s judgments about the potential performance of the sub-advisers may also prove incorrect and may not produce the desired results.
Model Risk: Like all quantitative analysis, investment models carry a risk that the mathematical models used might be based on one or more incorrect assumptions. Rapidly changing and unforeseen market dynamics could also lead to a decrease in short term effectiveness of the mathematical models. No assurance can be given that the Fund will be successful under all or any market conditions.
Equity Risk: The net asset value of the Fund will fluctuate based on changes in the value of its holdings in U.S. and foreign equity securities. Equity prices can fall rapidly in response to developments affecting a specific company or industry, or to changing economic, political or market conditions.
| ● | Small and Medium Capitalization Stock Risk. The earnings and prospects of small and medium sized companies are more volatile than larger companies and may experience higher failure rates than larger companies. Small and medium sized companies normally have a lower trading volume than larger companies, which may tend to make their market price fall more disproportionately than larger companies in response to selling pressures and may have limited markets, product lines, or financial resources and lack management experience. |
| ● | Large Capitalization Risk. Large capitalization companies may be less able than smaller capitalization companies to adapt to changing market conditions. Large-capitalization companies may be more mature and subject to more limited growth potential compared with smaller capitalization companies. During different market cycles, the performance of large capitalization companies has trailed the overall performance of the broader securities markets. |
Fixed Income Securities Risk. When the Fund invests in fixed income securities, the value of your investment in the Fund will fluctuate with changes in interest rates. Typically, a rise in interest rates causes a decline in the value of fixed income securities owned by the Fund. In general, the market price of fixed income securities with longer maturities will increase or decrease more in response to changes in interest rates than shorter-term securities. Other risk factors include credit risk (the debtor may default), extension risk (an issuer may exercise its right to repay principal on a fixed rate obligation held by the Fund later than expected), and prepayment risk (the debtor may pay its obligation early, reducing the amount of interest payments). These risks could affect the value of a particular investment by the Fund, possibly causing the Fund's share price and total return to be reduced and fluctuate more than other types of investments.
| ● | Floating Rate Risk. Changes in short-term market interest rates will directly affect the yield on the shares of a fund whose investments are normally invested in floating rate debt. If short-term market interest rates fall, the yield on the Fund’s shares will also fall. Conversely, when short-term market interest rates rise, because of the lag between changes in such short-term rates and the resetting of the floating rates on the floating rate debt in the Fund’s portfolio, the impact of rising rates will be delayed to the extent of such lag. |
| ● | Credit Risk: There is a risk that issuers will not make payments on fixed income securities held by the Fund, resulting in losses to the Fund. In addition, the credit quality of fixed income securities held by the Fund may be lowered if an issuer's financial condition changes. The issuer of a fixed income security may also default on its obligations. |
| ● | High Yield Risk: Lower-quality bonds, known as “high yield” or “junk” bonds, present greater risk than bonds of higher quality, including an increased risk of default. An economic downturn or period of rising interest rates could adversely affect the market for these bonds and reduce the Fund's ability to sell its bonds. The lack of a liquid market for these bonds could decrease the Fund's share price. |
| ● | Interest Rate Risk: Interest rate risk is the risk that bond prices overall, including the prices of securities held by the Fund, will decline over short or even long periods of time due to rising interest rates. Bonds with longer maturities tend to be more sensitive to interest rates than bonds with shorter maturities. For example, if interest rates go up by 1.0%, the price of a 4% coupon bond will decrease by approximately 1.0% for a bond with 1 year to maturity and approximately 4.4% for a bond with 5 years to maturity. |
| ● | Mortgage-Related and/or Other Asset-Backed Securities Risk: Investments in mortgage-related and other asset-backed securities are subject to certain additional risks. The value of these securities may be particularly sensitive to changes in interest rates. These risks include “extension risk”, which is the risk that, in periods of rising interest rates, issuers may delay the payment of principal, and “prepayment risk”, which is the risk that in periods of falling interest rates, issuers may pay principal sooner than expected, exposing the Fund to a lower rate of return upon reinvestment of principal. Mortgage-backed securities offered by non-governmental issuers and other asset-backed securities may be subject to other risks, such as higher rates of default in the mortgages or assets backing the securities or risks associated with the nature and servicing of mortgages or assets backing the securities. |
Exchange-Traded Fund Risk: The Fund may invest in ETFs as part of its principal investment strategies. ETFs are subject to investment advisory and other expenses, which will be indirectly paid by the Fund. As a result, your cost of investing in the Fund will be higher than the cost of investing directly in ETFs and may be higher than other mutual funds that invest directly in stocks and bonds. ETFs are listed on national stock exchanges and are traded like stocks listed on an exchange. The market price for the Fund’s shares may deviate from the Fund’s net asset value, particularly during times of market stress, with the result that investors may pay significantly more or receive significantly less for Fund shares than the Fund’s net asset value, which is reflected in the bid and ask price for Fund shares or in the closing price.
Portfolio Turnover Risk: Portfolio turnover results in higher brokerage commissions, dealer mark-ups and other transaction costs and may result in taxable capital gains. Higher costs associated with increased portfolio turnover may offset gains in the Fund’s performance.
Leverage Risk: The use of leverage by the funds or ETFs in which the Fund invests, such as borrowing money to purchase securities, will cause a fund to incur additional expenses and magnify the fund's gains or losses. Investments in derivative instruments, such as futures, options, and swap agreements, have the economic effect of creating financial leverage in a fund’s portfolio because such investments may give rise to losses that exceed the amount the fund has invested in those instruments. Financial leverage will magnify, sometimes significantly, investment exposure to any increase or decrease in prices associated with a particular reference asset resulting in increased volatility in the value of the fund’s portfolio. Accordingly, the value of the Fund’s portfolio is likely to experience greater volatility over short-term periods.
Foreign Risk: Changes in foreign economies and political climates are more likely to affect the Fund than a mutual fund that invests exclusively in U.S. companies. Foreign companies are generally not subject to the same regulatory requirements of U.S. companies thereby resulting in less publicly available information about these companies. In addition, foreign accounting, auditing, and financial reporting standards generally differ from those applicable to U.S. companies.
The Tactical Growth Allocation Fund seeks to provide capital appreciation.
This table describes the fees and expenses that you may pay if you buy and hold shares of the Fund.
Shareholder Fees |
Tactical Growth Allocation Fund
Tactical Growth Allocation Fund Class I
USD ($)
|
|---|---|
| Shareholder Fees (fees paid directly from your investment) | none |
Annual Fund Operating Expenses |
Tactical Growth Allocation Fund
Tactical Growth Allocation Fund Class I
|
|
|---|---|---|
| Management Fees | 1.30% | |
| Shareholder Services Fee | 0.15% | [1] |
| Other Expenses | 0.96% | |
| Acquired Fund Fees and Expenses | 0.50% | [2] |
| Total Annual Fund Operating Expenses | 2.91% | [2] |
| Fee Waiver and/or Expense Reimbursement | (0.27%) | [2],[3] |
| Total Annual Fund Operating Expenses After Fee Waiver and/or Expense Reimbursement | 2.64% | [2] |
| [1] | The Fund has implemented a Shareholder Services Plan on behalf of its I Shares that allows it to make payments of up to 0.15% to financial intermediaries and other service providers in return for shareholder servicing and maintenance of shareholder accounts. |
| [2] | |
| [3] | Tactical Fund Advisors, LLC (the “Adviser”) has contractually agreed to reduce its fees and to reimburse expenses, at least through April 30, 2026, to ensure that total annual Fund operating expenses after fee waivers and reimbursements (exclusive of any front-end or contingent deferred loads, interest, borrowing expenses, shareholder service fees pursuant to a Shareholder Service Plan, taxes, acquired fund fees and expenses, brokerage fees and commissions, dividend expenses on short sales, litigation expenses, expenditures which are capitalized in accordance with generally accepted accounting principles and, other extraordinary expenses not incurred in the ordinary course of such Fund’s business) will not exceed 1.99% of the Fund’s average daily net assets. These fee waivers and expense reimbursements are subject to recoupment from the Fund within three years of the date on which the waiver or reimbursement occurs, provided that the recoupment payments do not cause Total Annual Fund Operating Expenses (after the repayment is taken into account) to exceed (i) the expense limitation then in effect, if any, and (ii) the expense limitation in effect at the time the expenses to be repaid were incurred. This agreement may be terminated only by the Board of Trustees (the “Board”), on 60 days’ written notice to the Fund’s Adviser. |
This Example is intended to help you compare the cost of investing in the Fund with the cost of investing in other mutual funds.
The Example assumes that you invest $10,000 in the Fund for the time periods indicated and then redeem all of your shares at the end of those periods. The Example also assumes that your investment has a 5% return each year and that the Fund’s operating expenses remain the same. Although your actual costs may be higher or lower, based upon these assumptions your costs would be:
Expense Example |
Expense Example, with Redemption, 1 Year |
Expense Example, with Redemption, 3 Years |
Expense Example, with Redemption, 5 Years |
Expense Example, with Redemption, 10 Years |
|---|---|---|---|---|
| Tactical Growth Allocation Fund | Tactical Growth Allocation Fund Class I | USD ($) | 267 | 875 | 1,509 | 3,214 |
The Fund pays transaction costs, such as commissions, when it buys and sells securities (or “turns over” its portfolio). A higher portfolio turnover may indicate higher transaction costs and may result in higher taxes when Fund shares are held in a taxable account. These costs, which are not reflected in annual fund operating expenses or in the Example, affect the Fund’s performance. During the fiscal year ended December 31, 2024, the Fund’s portfolio turnover rate was 288.55%.
The Fund may invest in equity securities of domestic and foreign issuers of any size, equity-related securities such as options on equity indices or index exchange-traded funds (“ETFs”), and exchange-traded notes (“ETNs”) linked to the VIX (market volatility) index. Fixed income securities include corporate bonds, municipal securities, and U.S. Treasury securities. The Fund’s ETF investments include leveraged ETFs and ETFs that invest in fixed-income securities of any duration or credit quality, including high-yield bonds (commonly known as “junk bonds”). High yield bonds are securities that are generally rated below investment grade by the primary rating agencies (BBB- or lower by S&P and Baa3 or lower by Moody’s). The Fund may short shares of equity and fixed income ETFs and foreign equity securities or ETFs, including issuers from emerging market countries. The Fund considers emerging market countries to be those found in the MSCI EAFE Index.
Under normal circumstances, the Fund intends to target a long-term equity beta relative to the S&P 500® Index (the “S&P 500”) within a range of 0.80 to 0.90. Beta is a statistical measure of the sensitivity of a company’s stock price to the movement of a broad market index, like the S&P 500. A beta greater than 1.0 means a security moves up and down more than the movement of the index. A beta less than 1.0 means that a security moves up and down less than the movement of the stock market. The tactical nature of the Fund’s underlying investment methodology may temporarily result in wider variations depending on current market conditions.
The Fund expects to have a high portfolio turnover, which may result in higher transactional costs.
The Fund’s adviser, Tactical Fund Advisors, LLC (the “Adviser”), delegates the daily management of the Fund’s assets to multiple sub-advisers. The Adviser is responsible for the overall management of the Fund, overseeing the Fund’s sub-advisers and determining the amount of the Fund’s assets that each sub-adviser will manage, which will vary from time to time. The Fund’s sub-advisers invest the assets delegated to them by the Adviser as follows:
Synergy Asset Management, LLC (“Synergy”) – Synergy invests its allocation of the Fund’s assets primarily in a diversified portfolio of global equity securities and ETFs that seeks to outperform the S&P 500.
Heritage Capital Advisors, LLC (“Heritage”) – Heritage invests its allocation of the Fund’s assets in a diversified portfolio of global equity securities and short, intermediate, and long-term bonds.
Howard Capital Management, Inc. (“Howard”) – Howard invests its allocation of the Fund’s assets in domestic equity securities of any market capitalization, other investment companies, closed-end funds, ETFs, cash and cash equivalents and options. These investment companies invest in equity securities of companies in sectors, styles, and asset classes selected by the Adviser’s proprietary quantitative model, which indicates which investments are outperforming at any given time based on the Adviser’s proprietary strength criteria.
The Fund expects to have a high portfolio turnover which may result in higher transactional costs.
The Fund was reorganized on August 20, 2021, from a series of Collaborative Investment Series Trust, a Delaware statutory trust, to a series of Tactical Investment Series Trust, a Delaware statutory trust (the “Reorganization”). While the Fund’s investment objective, principal investment strategies and risks are identical to the Fund and theoretically would have invested in the same portfolio of securities, the Fund’s performance may be different than the performance of the Fund, due to, among other things, differences in fees and expenses.
The bar chart and table that follow provide some indication of the risks of investing in the Fund by showing changes in the Fund’s performance from year to year and by showing how the Fund’s average annual total returns for one year and since inception compare with those of a broad-based securities market index. How the Fund has performed in the past (before and after taxes) is not necessarily an indication of how the Fund will perform in the future. Updated performance information, current through the most recent month end, is available by calling (833) 974-3787 or by visiting the Fund’s website at www.tfafunds.com.
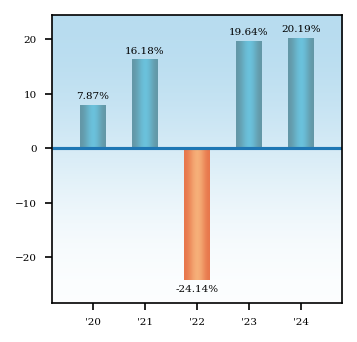
| Quarterly Returns During This Time Period | |
| Highest: | % (quarter ended ) |
| Lowest: | % (quarter ended ) |
Average Annual Total Returns - Tactical Growth Allocation Fund |
1 Year |
5 Years |
Since Inception |
Inception Date |
|||
|---|---|---|---|---|---|---|---|
| Tactical Growth Allocation Fund Class I | 20.19% | 6.45% | 6.51% | Jun. 10, 2019 | |||
| Tactical Growth Allocation Fund Class I | After Taxes on Distributions | 20.19% | 5.05% | 5.24% | Jun. 10, 2019 | |||
| Tactical Growth Allocation Fund Class I | After Taxes on Distributions and Sales | 12.72% | 4.60% | 4.72% | Jun. 10, 2019 | |||
| Wilshire Liquid Alternative Index | 4.44% | [1] | 2.49% | [1] | 2.74% | [1] | Jun. 10, 2019 |
| Morningstar Moderately Aggressive Target Risk TR USD Index | 10.66% | [2] | 7.02% | [2] | 8.06% | [2] | Jun. 10, 2019 |
| [1] | The Wilshire Liquid Alternative IndexSM measures the collective performance of the five Wilshire Liquid Alternative strategies that make up the Wilshire Liquid Alternative Universe. The Wilshire Liquid Alternative Index (WLIQA) is designed to provide a broad measure of the liquid alternative market by combining the performance of the Wilshire Liquid Alternative Equity Hedge IndexSM (WLIQAEH), Wilshire Liquid Alternative Global Macro IndexSM (WLIQAGM), Wilshire Liquid Alternative Relative Value IndexSM (WLIQARV), Wilshire Liquid Alternative Multi-Strategy IndexSM (WLIQAMS), and Wilshire Liquid Alternative Event Driven IndexSM (WLIQAED). Please note that indices do not take into account any fees and expenses of investing in the individual securities that they track and individuals cannot invest directly in any index. |
| [2] | The Morningstar Moderately Aggressive Target Risk Total Return USD Index seeks approximately 80% exposure to global equity markets. This Index does not incorporate Environmental, Social, or Governance (ESG) criteria. Investors cannot invest directly in an index. |
During the year, the Fund changed its primary benchmark from the Wilshire Liquid Alternative IndexSM to the Morningstar Moderately Aggressive Target Risk Total Return USD Index as it is more aligned with the Fund’s investment strategies, holdings and risk characteristics.
After-tax returns are calculated using the historical highest individual federal marginal income tax rates and do not reflect the impact of state and local taxes. Actual after-tax returns depend on an investor’s tax situation and may differ from those shown above. After-tax returns shown are not relevant to investors who hold their shares through tax-deferred arrangements, such as a 401(k) plan or an individual retirement account (“IRA”). Return After Taxes on Distributions and Sale of Fund Shares may be higher than other returns for the same period due to a tax benefit of realizing a capital loss on the same of Fund shares.
Management Risk: The portfolio managers’ judgments about the attractiveness, value and potential appreciation of particular stocks or other securities in which the Fund invests or sells short may prove to be incorrect and there is no guarantee that the portfolio managers’ judgment will produce the desired results. Additionally, the Adviser’s judgments about the potential performance of the sub-advisers may also prove incorrect and may not produce the desired results.
Model Risk: Like all quantitative analysis, investment models carry a risk that the mathematical models used might be based on one or more incorrect assumptions. Rapidly changing and unforeseen market dynamics could also lead to a decrease in short term effectiveness of the mathematical models. No assurance can be given that the Fund will be successful under all or any market conditions.
Equity Risk: The net asset value of the Fund will fluctuate based on changes in the value of its holdings in U.S. and foreign equity securities. Equity prices can fall rapidly in response to developments affecting a specific company or industry, or to changing economic, political or market conditions.
| ● | Small and Medium Capitalization Stock Risk. The earnings and prospects of small and medium sized companies are more volatile than larger companies and may experience higher failure rates than larger companies. Small and medium sized companies normally have a lower trading volume than larger companies, which may tend to make their market price fall more disproportionately than larger companies in response to selling pressures and may have limited markets, product lines, or financial resources and lack management experience. |
| ● | Large Capitalization Risk. Large capitalization companies may be less able than smaller capitalization companies to adapt to changing market conditions. Large-capitalization companies may be more mature and subject to more limited growth potential compared with smaller capitalization companies. During different market cycles, the performance of large capitalization companies has trailed the overall performance of the broader securities markets. |
Fixed Income Securities Risk. When the Fund invests in fixed income securities, the value of your investment in the Fund will fluctuate with changes in interest rates. Typically, a rise in interest rates causes a decline in the value of fixed income securities owned by the Fund. In general, the market price of fixed income securities with longer maturities will increase or decrease more in response to changes in interest rates than shorter-term securities. Other risk factors include credit risk (the debtor may default), extension risk (an issuer may exercise its right to repay principal on a fixed rate obligation held by the Fund later than expected), and prepayment risk (the debtor may pay its obligation early, reducing the amount of interest payments). These risks could affect the value of a particular investment by the Fund, possibly causing the Fund's share price and total return to be reduced and fluctuate more than other types of investments.
| ● | Floating Rate Risk. Changes in short-term market interest rates will directly affect the yield on the shares of a fund whose investments are normally invested in floating rate debt. If short-term market interest rates fall, the yield on the Fund’s shares will also fall. Conversely, when short-term market interest rates rise, because of the lag between changes in such short-term rates and the resetting of the floating rates on the floating rate debt in the Fund’s portfolio, the impact of rising rates will be delayed to the extent of such lag. |
| ● | Credit Risk: There is a risk that issuers will not make payments on fixed income securities held by the Fund, resulting in losses to the Fund. In addition, the credit quality of fixed income securities held by the Fund may be lowered if an issuer's financial condition changes. The issuer of a fixed income security may also default on its obligations. |
| ● | High Yield Risk: Lower-quality bonds, known as “high yield” or “junk” bonds, present greater risk than bonds of higher quality, including an increased risk of default. An economic downturn or period of rising interest rates could adversely affect the market for these bonds and reduce the Fund's ability to sell its bonds. The lack of a liquid market for these bonds could decrease the Fund's share price. |
| ● | Interest Rate Risk: Interest rate risk is the risk that bond prices overall, including the prices of securities held by the Fund, will decline over short or even long periods of time due to rising interest rates. Bonds with longer maturities tend to be more sensitive to interest rates than bonds with shorter maturities. For example, if interest rates go up by 1.0%, the price of a 4% coupon bond will decrease by approximately 1.0% for a bond with 1 year to maturity and approximately 4.4% for a bond with 5 years to maturity. |
Exchange-Traded Fund Risk: The Fund may invest in ETFs as part of its principal investment strategies. ETFs are subject to investment advisory and other expenses, which will be indirectly paid by the Fund. As a result, your cost of investing in the Fund will be higher than the cost of investing directly in ETFs and may be higher than other mutual funds that invest directly in stocks and bonds. ETFs are listed on national stock exchanges and are traded like stocks listed on an exchange. The market price for the Fund’s shares may deviate from the Fund’s net asset value, particularly during times of market stress, with the result that investors may pay significantly more or receive significantly less for Fund shares than the Fund’s net asset value, which is reflected in the bid and ask price for Fund shares or in the closing price.
Portfolio Turnover Risk: Portfolio turnover results in higher brokerage commissions, dealer mark-ups and other transaction costs and may result in taxable capital gains. Higher costs associated with increased portfolio turnover may offset gains in the Fund’s performance.
Leverage Risk: The use of leverage by the funds or ETFs in which the Fund invests, such as borrowing money to purchase securities, will cause a fund to incur additional expenses and magnify the fund's gains or losses. Investments in derivative instruments, such as futures, options and swap agreements, have the economic effect of creating financial leverage in a fund’s portfolio because such investments may give rise to losses that exceed the amount the fund has invested in those instruments. Financial leverage will magnify, sometimes significantly, investment exposure to any increase or decrease in prices associated with a particular reference asset resulting in increased volatility in the value of the fund’s portfolio. Accordingly, the value of the Fund’s portfolio is likely to experience greater volatility over short-term periods.
Foreign Risk: Changes in foreign economies and political climates are more likely to affect the Fund than a mutual fund that invests exclusively in U.S. companies. Foreign companies are generally not subject to the same regulatory requirements of U.S. companies thereby resulting in less publicly available information about these companies. In addition, foreign accounting, auditing and financial reporting standards generally differ from those applicable to U.S. companies.
Options Risk: There are risks associated with the sale and purchase of call and put options. As a seller (writer) of a put option, the Fund will tend to lose money if the value of the reference index or security falls below the strike price. As the seller (writer) of a call option, the Fund will tend to lose money if the value of the reference index or security rises above the strike price. As the buyer of a put or call option, the Fund risks losing the entire premium invested if the value of the reference index or security is below (above) the call (put) strike at maturity.
Short Position Risk: The Fund may take short positions, including in shares of an ETF. A “short” position is, in effect, similar to a sale in which the Fund sells a security it does not own but, has borrowed in anticipation that the market price of the security will decline. The Fund must replace a short security position by purchasing it at the market price at the time of replacement. Therefore, the potential loss on a “short” position is unlimited.
Exchange Traded Note Risk: Similar to ETFs, owning an ETN generally reflects the risks of owning the assets that comprise the underlying market benchmark or strategy that the ETN is designed to reflect. ETNs also are subject to issuer, credit and interest rate risks.
| ● | Emerging Markets Risk: Investing in emerging markets involves not only the risks described above with respect to investing in foreign securities, but also other risks, including exposure to economic structures that are generally less diverse and mature, and to political systems that can be expected to have less stability, than those of developed countries. The typically small size of the markets of securities of issuers located in emerging markets and the possibility of a low or nonexistent volume of trading in those securities may also result in a lack of liquidity and in price volatility of those securities. |
The TFA Quantitative Fund (the “Fund”) seeks to provide capital appreciation.
This table describes the fees and expenses, excluding any brokerage fees, that you may pay if you buy and hold shares of the Fund.
Shareholder Fees |
TFA Quantitative Fund
TFA Quantitative Fund Class I
USD ($)
|
|---|---|
| Shareholder Fees (fees paid directly from your investment) | none |
Annual Fund Operating Expenses |
TFA Quantitative Fund
TFA Quantitative Fund Class I
|
|
|---|---|---|
| Management Fees | 1.30% | |
| Shareholder Services Fee | 0.15% | [1] |
| Other Expenses | 0.59% | |
| Acquired Fund Fees and Expenses | 0.63% | [2] |
| Total Annual Fund Operating Expenses | 2.67% | |
| [1] | The Fund has implemented a Shareholder Services Plan on behalf of its I Shares that allows it to make payments of up to 0.15% to financial intermediaries and other service providers in return for shareholder servicing and maintenance of shareholder accounts. |
| [2] |
This Example is intended to help you compare the cost of investing in the Fund with the cost of investing in other mutual funds.
The Example assumes that you invest $10,000 in the Fund for the time periods indicated and then redeem all of your shares at the end of those periods. The Example also assumes that your investment has a 5% return each year and that the Fund’s operating expenses remain the same. Although your actual costs may be higher or lower, based upon these assumptions your costs would be:
Expense Example |
Expense Example, with Redemption, 1 Year |
Expense Example, with Redemption, 3 Years |
Expense Example, with Redemption, 5 Years |
Expense Example, with Redemption, 10 Years |
|---|---|---|---|---|
| TFA Quantitative Fund | TFA Quantitative Fund Class I | USD ($) | 270 | 829 | 1,415 | 3,003 |
The Fund pays transaction costs, such as commissions, when it buys and sells securities (or “turns over” its portfolio). A higher portfolio turnover rate may indicate higher transaction costs and may result in higher taxes when Fund shares are held in a taxable account. These costs, which are not reflected in annual fund operating expenses or in the Example, may adversely affect the Fund’s performance. During the fiscal year ended December 31, 2024, the Fund’s portfolio turnover was 316.03%.
The Fund’s adviser, Tactical Fund Advisors, LLC (the “Adviser”), delegates the daily management of the Fund’s assets to multiple sub-advisers. The Adviser is responsible for the overall management of the Fund, overseeing the Fund’s sub-advisers and determining the amount of the Fund’s assets that each sub-adviser will manage, which will vary from time to time.
The Fund pursues its objective by investing, under normal market conditions, in long, inverse, leveraged, and unleveraged mutual funds and exchange-traded funds (the “Underlying Funds”) focused on major global equity and fixed income indices, industry sectors, and factor styles.
The Fund may invest in inverse funds, which are funds that are designed to provide returns that are the inverse, or opposite of a specific benchmark or index. The Fund may invest in an underlying fund up to the limits permitted by the Investment Company Act of 1940 and the rules thereunder.
The Adviser delegates the daily management of the Fund’s portfolio to the Sub-Advisers, whose models generate signals based on a quantitative analysis. The Sub-Advisers use these signals to invest in the Underlying Funds. Each model’s buy, sell, or hold signals are generated by its algorithmic, rules-based system. The Sub-Advisers’ models seek to anticipate a market advance, correction, or decline. The Sub-Advisers determine the final allocations among the Underlying Funds and other assets using short-term technical analysis and momentum indicators that track recent price changes in the Underlying Funds. See Sub-Advisers and Strategies on page 32 of the prospectus for more information on each Sub-Adviser’s investment process.
In managing the Fund’s portfolio, the Fund will engage in frequent trading, resulting in a high portfolio turnover rate.
The bar chart and table that follow provide some indication of the risks of investing in the Fund by showing changes in the Fund’s performance yearly and by showing how the Fund’s average annual total returns for one year and since inception compare with those of a broad-based securities market index. How the Fund has performed in the past (before and after taxes) is not necessarily an indication of how it will perform in the future. Updated performance information, current through the most recent month end, is available by calling (833) 974-3787 or by visiting the Fund’s website at www.tfafunds.com.
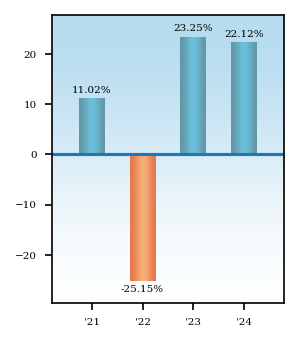
| Quarterly Returns During This Time Period | |
| Highest: | % (quarter ended ) |
| Lowest: | % (quarter ended ) |
Average Annual Total Returns - TFA Quantitative Fund |
1 Year |
Since Inception |
Inception Date |
||
|---|---|---|---|---|---|
| TFA Quantitative Fund Class I | 22.12% | 8.82% | May 18, 2020 | ||
| TFA Quantitative Fund Class I | After Taxes on Distributions | 22.12% | 6.60% | May 18, 2020 | ||
| TFA Quantitative Fund Class I | After Taxes on Distributions and Sales | 13.94% | 6.12% | May 18, 2020 | ||
| Wilshire Liquid Alternative Index | 4.44% | [1] | 3.99% | [1] | May 18, 2020 |
| S&P 500 Total Return Index | 25.02% | [2] | 17.86% | [2] | May 18, 2020 |
| Morningstar Aggressive Target Risk Total Return Index | 12.50% | [3] | 12.71% | [3] | May 18, 2020 |
| [1] | The Wilshire Liquid Alternative IndexSM measures the collective performance of the five Wilshire Liquid Alternative strategies that make up the Wilshire Liquid Alternative Universe. The Wilshire Liquid Alternative Index (WLIQA) is designed to provide a broad measure of the liquid alternative market by combining the performance of the Wilshire Liquid Alternative Equity Hedge IndexSM (WLIQAEH), Wilshire Liquid Alternative Global Macro IndexSM (WLIQAGM), Wilshire Liquid Alternative Relative Value IndexSM (WLIQARV), Wilshire Liquid Alternative Multi-Strategy IndexSM (WLIQAMS), and Wilshire Liquid Alternative Event Driven IndexSM (WLIQAED). Please note that indices do not take into account any fees and expenses of investing in the individual securities that they track and individuals cannot invest directly in any index. |
| [2] | The S&P 500 Total Return Index, a registered trademark of McGraw-Hill Co., Inc., is a market capitalization-weighted index of 500 widely held common stocks. Investors cannot invest directly in an index. |
| [3] | The Morningstar Aggressive Target Risk Total Return USD Index seeks approximately 95% exposure to global equity markets. This Index does not incorporate Environmental, Social, or Governance (ESG) criteria. Investors cannot invest directly in an index. |
During the year, the Fund replaced both of its benchmarks, the Wilshire Liquid Alternative IndexSM and the S&P 500® Total Return Index, with the Morningstar Aggressive Target Risk Total Return USD Index as it is more aligned with the Fund’s investment strategies, holdings and risk characteristics.
After-tax returns are calculated using the historical highest individual federal marginal income tax rates and do not reflect the impact of state and local taxes. Actual after-tax returns depend on an investor’s tax situation and may differ from those shown above. After-tax returns shown are not relevant to investors who hold their shares through tax-deferred arrangements, such as a 401(k) plan or an individual retirement account (“IRA”). Return After Taxes on Distributions and Sale of Fund Shares may be higher than other returns for the same period due to a tax benefit of realizing a capital loss on the same of Fund shares.
Management Risk: The portfolio managers’ judgments about the attractiveness, value and potential appreciation of particular stocks or other securities in which the Fund invests or sells short may prove to be incorrect and there is no guarantee that the portfolio managers’ judgment will produce the desired results. Additionally, the Adviser’s judgments about the potential performance of the sub-advisers may also prove incorrect and may not produce the desired results.
Model Risk: Like all quantitative analysis, investment models carry a risk that the mathematical models used might be based on one or more incorrect assumptions. Rapidly changing and unforeseen market dynamics could also lead to a decrease in short term effectiveness of the mathematical models. No assurance can be given that the Fund will be successful under all or any market conditions.
Equity Risk. The net asset value of the Fund will fluctuate based on changes in the value of the U.S. and/or foreign equity securities held by the Fund. Equity prices can fall rapidly in response to developments affecting a specific company or industry, or to changing economic, political or market conditions.
| ● | Large Capitalization Risk. The Underlying Funds invest in large-capitalization companies. Large Capitalization Companies may be less able than smaller capitalization companies to adapt to changing market conditions. Large-capitalization companies may be more mature and subject to more limited growth potential compared with smaller capitalization companies. During different market cycles, the performance of large capitalization companies has trailed the overall performance of the broader securities markets. |
Fixed Income Securities Risk. When the Fund invests in fixed income securities, the value of your investment in the Fund will fluctuate with changes in interest rates. Typically, a rise in interest rates causes a decline in the value of fixed income securities owned by the Fund. In general, the market price of fixed income securities with longer maturities will increase or decrease more in response to changes in interest rates than shorter-term securities. Other risk factors include credit risk (the debtor may default), extension risk (an issuer may exercise its right to repay principal on a fixed rate obligation held by the Fund later than expected), and prepayment risk (the debtor may pay its obligation early, reducing the amount of interest payments). These risks could affect the value of a particular investment by the Fund, possibly causing the Fund’s share price and total return to be reduced and fluctuate more than other types of investments.
| ● | Credit Risk: There is a risk that issuers will not make payments on fixed income securities held by the Fund, resulting in losses to the Fund. In addition, the credit quality of fixed income securities held by the Fund may be lowered if an issuer’s financial condition changes. The issuer of a fixed income security may also default on its obligations. |
| ● | Interest Rate Risk: Interest rate risk is the risk that bond prices overall, including the prices of securities held by the Fund, will decline over short or even long periods of time due to rising interest rates. Bonds with longer maturities tend to be more sensitive to interest rates than bonds with shorter maturities. For example, if interest rates go up by 1.0%, the price of a 4% coupon bond will decrease by approximately 1.0% for a bond with 1 year to maturity and approximately 4.4% for a bond with 5 years to maturity. |
Portfolio Turnover Risk: Portfolio turnover results in higher brokerage commissions, dealer mark-ups and other transaction costs and may result in taxable capital gains. Higher costs associated with increased portfolio turnover may offset gains in the Fund’s performance.
Leverage Risk. The use of leverage by the funds or ETFs in which the Fund invests, such as borrowing money to purchase securities, will cause a fund to incur additional expenses and magnify the fund’s gains or losses. Investments in derivative instruments, such as futures, options and swap agreements, have the economic effect of creating financial leverage in a fund’s portfolio because such investments may give rise to losses that exceed the amount the fund has invested in those instruments. Financial leverage will magnify, sometimes significantly, investment exposure to any increase or decrease in prices associated with a particular reference asset resulting in increased volatility in the value of the fund’s portfolio. Accordingly, the value of the Fund’s portfolio is likely to experience greater volatility over short-term periods.
Foreign Risk: Changes in foreign economies and political climates are more likely to affect the Fund than a mutual fund that invests exclusively in U.S. companies. Foreign companies are generally not subject to the same regulatory requirements of U.S. companies thereby resulting in less publicly available information about these companies. In addition, foreign accounting, auditing, and financial reporting standards generally differ from those applicable to U.S. companies.
Underlying Fund Risk. Other investment companies including mutual funds and ETFs in which the Fund invests are subject to investment advisory and other expenses, which will be indirectly paid by the Fund. As a result, the cost of investing in the Fund will be higher than the cost of investing directly in the underlying funds and may be higher than other mutual funds that invest directly in stocks and bonds. Each of the underlying funds is subject to its own specific risks, but the Sub-Adviser expects the principal investments risks of such underlying funds will be similar to the risks of investing in the Fund.
| ● | Exchange-Traded Funds Risk. The Fund may invest in ETFs as part of its principal investment strategies. ETFs are subject to investment advisory and other expenses, which will be indirectly paid by the Fund. As a result, your cost of investing in the Fund will be higher than the cost of investing directly in ETFs and may be higher than other mutual funds that invest directly in stocks and bonds. ETFs are listed on national stock exchanges and are traded like stocks listed on an exchange. The market price for the Fund’s shares may deviate from the Fund’s net asset value, particularly during times of market stress, with the result that investors may pay significantly more or receive significantly less for Fund shares than the Fund’s net asset value, which is reflected in the bid and ask price for Fund shares or in the closing price. |
| ● | Inverse Fund Risk. Investments in inverse funds, including ETFs, will prevent the Fund from participating in market-wide or sector-wide gains and may not prove to be an effective hedge. During periods of increased volatility, inverse funds may not perform in the manner they are designed. Inverse funds do not provide the inverse return of the target index over the life of the Fund. |
| ● | Risk of Concentrating in Underlying Funds. At times, the Fund can concentrate in one or more underlying funds, which means it will invest more than 25% of its assets in the underlying fund. To the extent the underlying fund concentrates or focuses in investments related to a particular security, industry, group of industries, or sectors, the Fund will also concentrate or focus in those investments. In such an event, the Fund’s performance will be particularly susceptible to adverse events impacting such security, industry, group of related industries, or sector. As a result, the Fund’s investments may experience more volatility in performance. |
The TFA AlphaGen Growth Fund (the “Fund”) seeks to provide capital appreciation.
This table describes the fees and expenses, excluding any brokerage fees, that you may pay if you buy and hold shares of the Fund.
Shareholder Fees |
TFA AlphaGen Growth Fund
TFA AlphaGen Growth Fund Class I
USD ($)
|
|---|---|
| Shareholder Fees (fees paid directly from your investment) | none |
Annual Fund Operating Expenses |
TFA AlphaGen Growth Fund
TFA AlphaGen Growth Fund Class I
|
|
|---|---|---|
| Management Fees | 1.30% | |
| Shareholder Services Fee | 0.15% | [1] |
| Other Expenses | 0.73% | |
| Acquired Fund Fees and Expenses | 0.34% | [2] |
| Total Annual Fund Operating Expenses | 2.52% | |
| Fee Waiver and/or Expense Reimbursement | (0.04%) | [2],[3] |
| Total Annual Fund Operating Expenses After Fee Waiver and/or Expense Reimbursement | 2.48% | [2] |
| [1] | The Fund has implemented a Shareholder Services Plan on behalf of its I Shares that allows it to pay up to 0.15% to financial intermediaries and other service providers in return for shareholder servicing and account maintenance. |
| [2] | |
| [3] | Tactical Fund Advisors, LLC (the “Adviser”) has contractually agreed to reduce its fees and to reimburse expenses, at least through April 30, 2026, to ensure that total annual Fund operating expenses after fee waivers and reimbursements (exclusive of any front-end or contingent deferred loads, interest, borrowing expenses, shareholder service fees pursuant to a Shareholder Service Plan, taxes, acquired fund fees and expenses, brokerage fees and commissions, dividend expenses on short sales, litigation expenses, expenditures which are capitalized in accordance with generally accepted accounting principles and, other extraordinary expenses not incurred in the ordinary course of such Fund’s business) will not exceed 1.99% of the Fund’s average daily net assets. These fee waivers and expense reimbursements are subject to recoupment from the Fund within three years of the date on which the waiver or reimbursement occurs, provided that the recoupment payments do not cause Total Annual Fund Operating Expenses (after the repayment is taken into account) to exceed (i) the expense limitation then in effect, if any, and (ii) the expense limitation in effect at the time the expenses to be repaid were incurred. This agreement may be terminated only by the Board of Trustees (the “Board”), on 60 days’ written notice to the Fund’s Adviser. |
This Example is intended to help you compare the cost of investing in the Fund with the cost of investing in other mutual funds.
The Example assumes that you invest $10,000 in the Fund for the time periods indicated and then redeem all of your shares at the end of those periods. The Example also assumes that your investment has a 5% return each year and that the Fund’s operating expenses remain the same. Although your actual costs may be higher or lower, based upon these assumptions your costs would be:
Expense Example |
Expense Example, with Redemption, 1 Year |
Expense Example, with Redemption, 3 Years |
Expense Example, with Redemption, 5 Years |
Expense Example, with Redemption, 10 Years |
|---|---|---|---|---|
| TFA AlphaGen Growth Fund | TFA AlphaGen Growth Fund Class I | USD ($) | 251 | 781 | 1,337 | 2,853 |
The Fund pays transaction costs, such as commissions, when it buys and sells securities (or “turns over” its portfolio). A higher portfolio turnover rate may indicate higher transaction costs and may result in higher taxes when Fund shares are held in a taxable account. These costs, which are not reflected in annual fund operating expenses or in the Example, may adversely affect the Fund’s performance During the fiscal year ended December 31, 2024, the Fund’s portfolio turnover was 431.58%.
The Fund’s adviser, Tactical Fund Advisors, LLC (the “Adviser”), has engaged Heritage Capital Advisors, LLC (the “Sub-Adviser”) to perform the daily management of the Fund’s portfolio. The Sub-Adviser seeks to achieve the Fund’s investment objective by employing an active, risk-managed, multi-strategy investment approach. The Sub-Adviser’s philosophy is that utilizing multiple, complementary strategies may enhance portfolio diversification and smooth investment returns over a full market cycle.
The Sub-Adviser employs multiple sub-strategies to manage the portfolio. Sub-strategy approaches may include:
| 1) | Tactical allocation strategies designed to reduce equity exposure and increase fixed-income exposure when market risk is considered elevated. |
| 2) | Relative strength-based strategies identifying leading indices in equity and fixed income markets. |
| 3) | Directional strategies utilizing adaptive risk management. |
| 4) | Leadership-based equity selection strategies focused on top-rated individual stocks (as defined by the Sub-Adviser’s proprietary rating system) and sector exposures. |
| 5) | Hedging overlay strategies. |
| 6) | Equity selection strategies utilizing rules-based selection criteria. |
In selecting securities for the Fund’s portfolio, each Sub-Adviser strategy component first determines if equity markets offer the potential for acceptable risk-adjusted returns. If so, the Fund typically invests in equity securities, including exchange-traded funds (“ETFs”), mutual funds, and individual stocks. The Fund may invest in issues of any size. If not, the Fund seeks investments that are uncorrelated with the equity market returns such as fixed-income securities, including ETFs, mutual funds, cash or cash equivalents, and other asset classes. The Fund can invest in fixed-income securities of any maturity, duration, or quality (including “junk bonds”). The Fund may short equity and fixed income securities and ETFs.
The Sub-Adviser uses a combination of discretionary, rules-based and quantitative processes to measure market risk and select securities. The Sub-Adviser uses all or parts of a multi-faceted approach in managing the Fund, including fundamental, technical, and quantitative analysis. Using its proprietary quantitative models that provide buy and sell signals, the Sub-Adviser sets the Fund’s market exposure based on a wide array of fundamental and technical factors. Fundamental factors include measures such as monetary conditions, economic growth rates and other economic indicators, inflation expectations, valuations, earnings growth rates, and dividend yield. Technical factors include measures such as price movement, momentum, breadth measures, volatility, investor sentiment, historical market cycles, mean reversion, and trading volume.
The Fund seeks equity exposure between -30% and 150% and fixed income exposure between -10% and 35%. During periods when the Fund has limited investment opportunities, it may invest in money market funds and other cash-like securities. In managing the Fund’s portfolio, the Fund may utilize enhanced and inverse ETFs, and engage in frequent trading, resulting in a high portfolio turnover rate.
The Fund’s partial hedging overlay is a quantitatively driven, structured hedging component that is designed to buffer the Fund against portfolio losses and volatility. Potential benefits include the ability to effectively manage cash, reduce costs and risk exposures, and express tactical views.
The bar chart and table that follow provide some indication of the risks of investing in the Fund by showing changes in the Fund’s performance yearly and by showing how the Fund’s average annual total returns for one year and since inception compare with those of a broad-based securities market index. How the Fund has performed in the past (before and after taxes) is not necessarily an indication of how it will perform in the future. Updated performance information, current through the most recent month end, is available by calling (833) 974-3787 or by visiting the Fund’s website at www.tfafunds.com.
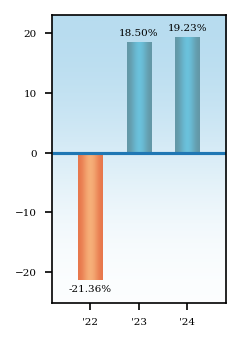
| Quarterly Returns During This Time Period | |
| Highest: | % (quarter ended ) |
| Lowest: | % (quarter ended ) |
Average Annual Total Returns - TFA AlphaGen Growth Fund |
1 Year |
Since Inception |
Inception Date |
||
|---|---|---|---|---|---|
| TFA AlphaGen Growth Fund Class I | 19.23% | 3.74% | Aug. 23, 2021 | ||
| TFA AlphaGen Growth Fund Class I | After Taxes on Distributions | 19.23% | 3.40% | Aug. 23, 2021 | ||
| TFA AlphaGen Growth Fund Class I | After Taxes on Distributions and Sales | 12.11% | 2.83% | Aug. 23, 2021 | ||
| Morningstar Aggressive Target Risk Total Return Index | 12.50% | [1] | 4.38% | [1] | Aug. 23, 2021 |
| S&P Target Risk Growth Index | 10.73% | [2] | 2.99% | [2] | Aug. 23, 2021 |
| S&P 500 Total Return Index | 25.02% | [3] | 10.12% | [3] | Aug. 23, 2021 |
| [1] | The Morningstar Aggressive Target Risk Total Return USD Index seeks approximately 95% exposure to global equity markets. This Index does not incorporate Environmental, Social, or Governance (ESG) criteria. Investors cannot invest directly in an index. |
| [2] | The S&P Target Risk Growth Index is designed to measure the performance of equity allocations, while seeking to provide limited fixed income exposure to diversify risk. Investors cannot invest directly in an index. |
| [3] | The S&P 500 Total Return Index, a registered trademark of McGraw-Hill Co., Inc., is a market capitalization-weighted index of 500 widely held common stocks. Investors cannot invest directly in an index. |
During the year, the Fund changed its benchmark from the S&P Target Risk Growth Total Return Index to the Morningstar Aggressive Target Risk Total Return USD Index as it is more aligned with the Fund’s investment strategies, holdings and risk characteristics.
After-tax returns are calculated using the historical highest individual federal marginal income tax rates and do not reflect the impact of state and local taxes. Actual after-tax returns depend on an investor’s tax situation and may differ from those shown above. After-tax returns shown are not relevant to investors who hold their shares through tax-deferred arrangements, such as a 401(k) plan or an individual retirement account (“IRA”). Return After Taxes on Distributions and Sale of Fund Shares may be higher than other returns for the same period due to a tax benefit of realizing a capital loss on the same of Fund shares.
Management Risk: The portfolio managers’ judgments about the attractiveness, value and potential appreciation of particular stocks or other securities in which the Fund invests or sells short may prove to be incorrect and there is no guarantee that the portfolio managers’ judgment will produce the desired results. Additionally, the Adviser’s judgments about the potential performance of the sub-advisers may also prove incorrect and may not produce the desired results.
Model Risk: Like all quantitative analysis, investment models carry a risk that the mathematical models used might be based on one or more incorrect assumptions. Rapidly changing and unforeseen market dynamics could also lead to a decrease in short term effectiveness of the mathematical models. No assurance can be given that the Fund will be successful under all or any market conditions.
Equity Risk: The net asset value of the Fund will fluctuate based on changes in the value of its holdings in U.S. and foreign equity securities. Equity prices can fall rapidly in response to developments affecting a specific company or industry, or to changing economic, political or market conditions.
| ● | Small and Medium Capitalization Stock Risk. The earnings and prospects of small and medium sized companies are more volatile than larger companies and may experience higher failure rates than larger companies. Small and medium sized companies normally have a lower trading volume than larger companies, which may tend to make their market price fall more disproportionately than larger companies in response to selling pressures and may have limited markets, product lines, or financial resources and lack management experience. |
| ● | Large Capitalization Risk. Large Capitalization Companies may be less able than smaller capitalization companies to adapt to changing market conditions. Large-capitalization companies may be more mature and subject to more limited growth potential compared with smaller capitalization companies. During different market cycles, the performance of large capitalization companies has trailed the overall performance of the broader securities markets. |
Fixed Income Securities Risk. When the Fund invests in fixed income securities, the value of your investment in the Fund will fluctuate with changes in interest rates. Typically, a rise in interest rates causes a decline in the value of fixed income securities owned by the Fund. In general, the market price of fixed income securities with longer maturities will increase or decrease more in response to changes in interest rates than shorter-term securities. Other risk factors include credit risk (the debtor may default), extension risk (an issuer may exercise its right to repay principal on a fixed rate obligation held by the Fund later than expected), and prepayment risk (the debtor may pay its obligation early, reducing the amount of interest payments). These risks could affect the value of a particular investment by the Fund, possibly causing the Fund’s share price and total return to be reduced and fluctuate more than other types of investments.
| ● | Floating Rate Risk. Changes in short-term market interest rates will directly affect the yield on the shares of a fund whose investments are normally invested in floating rate debt. If short-term market interest rates fall, the yield on the Fund’s shares will also fall. Conversely, when short-term market interest rates rise, because of the lag between changes in such short-term rates and the resetting of the floating rates on the floating rate debt in the Fund’s portfolio, the impact of rising rates will be delayed to the extent of such lag. |
| ● | Credit Risk: There is a risk that issuers will not make payments on fixed income securities held by the Fund, resulting in losses to the Fund. In addition, the credit quality of fixed income securities held by the Fund may be lowered if an issuer’s financial condition changes. The issuer of a fixed income security may also default on its obligations. |
| ● | High Yield Risk: Lower-quality bonds, known as “high yield” or “junk” bonds, present greater risk than bonds of higher quality, including an increased risk of default. An economic downturn or period of rising interest rates could adversely affect the market for these bonds and reduce the Fund’s ability to sell its bonds. The lack of a liquid market for these bonds could decrease the Fund’s share price. |
| ● | Interest Rate Risk: Interest rate risk is the risk that bond prices overall, including the prices of securities held by the Fund, will decline over short or even long periods of time due to rising interest rates. Bonds with longer maturities tend to be more sensitive to interest rates than bonds with shorter maturities. For example, if interest rates go up by 1.0%, the price of a 4% coupon bond will decrease by approximately 1.0% for a bond with 1 year to maturity and approximately 4.4% for a bond with 5 years to maturity. |
Exchange-Traded Fund Risk: The Fund may invest in ETFs as part of its principal investment strategies. ETFs are subject to investment advisory and other expenses, which will be indirectly paid by the Fund. As a result, your cost of investing in the Fund will be higher than the cost of investing directly in ETFs and may be higher than other mutual funds that invest directly in stocks and bonds. ETFs are listed on national stock exchanges and are traded like stocks listed on an exchange. The market price for the Fund’s shares may deviate from the Fund’s net asset value, particularly during times of market stress, with the result that investors may pay significantly more or receive significantly less for Fund shares than the Fund’s net asset value, which is reflected in the bid and ask price for Fund shares or in the closing price.
Portfolio Turnover Risk: Portfolio turnover results in higher brokerage commissions, dealer mark-ups and other transaction costs and may result in taxable capital gains. Higher costs associated with increased portfolio turnover may offset gains in the Fund’s performance.
Short Position Risk: The Fund may take short positions, including in shares of an ETF. A “short” position is, in effect, similar to a sale in which the Fund sells a security it does not own but, has borrowed in anticipation that the market price of the security will decline. The Fund must replace a short security position by purchasing it at the market price at the time of replacement. Therefore, the potential loss on a “short” position is unlimited.
| ● | Enhanced and Inverse ETF Risk. Enhanced and leveraged ETFs (the “underlying funds”) are index funds that seek to amplify the returns of an index by using active management to modify the weights of holdings, securities lending, leverage, and derivatives to enhance returns. These funds are riskier than non-enhanced or leveraged ETFs because of their leverage and derivative exposure. They also have higher compounding risk and are usually meant for short-term positions. |