This disclosure has been prepared in accordance with Section 953(a) of the Dodd-Frank Wall Street Reform and Consumer Protection Act and Item 402(v) of Regulation S-K and does not necessarily reflect how the Compensation Committee evaluates compensation decisions when contemplating Company or individual performance. The Compensation Committee did not consider the pay versus performance disclosure in making its pay decisions for any of the years shown. For further information concerning the Company’s pay-for-performance philosophy and how the Company aligns executive compensation with the Company’s performance, refer to the Compensation Discussion and Analysis section above.
Pay versus Performance Table
The following table sets forth information concerning the compensation of our PEO(s) and NEOs for each of the fiscal years ending December 31, 2024 and 2023:
|
Year |
Summary Compensation Table Total for PEO (1) ($) |
Compensation Actually Paid to PEO (2)(4) ($) |
Average Summary Compensation Table Total for Non-PEO NEOs (3) ($) |
Average Compensation Actually Paid to Non-PEO NEOs (2)(4) ($) |
Value of Initial Fixed $100 Investment Based on Total Shareholder Return (5) ($) |
Net Income (Loss) ($ in 000s) |
||||||||||||||||||
|
2024 |
209,275 | 208,786 | 124,742 | 124,620 | 102.00 | 522 | ||||||||||||||||||
|
2023 |
209,629 | 214,343 | 12,500 | 13,104 | 104.91 | 317 | ||||||||||||||||||
|
(1) |
The amounts shown for Summary Compensation Table Total for PEO are the amounts of total compensation reported for Mr. Foufas and Mr. Ferrantino for each corresponding year in the "Total" column of the Summary Compensation Table. Refer to the Summary Compensation Table on page 21 above. |
|
(2) |
The amounts shown for Compensation Actually Paid ("CAP") do not reflect the actual amount of compensation earned or paid to our executive officers during the applicable fiscal year and it is reported solely pursuant to the new SEC rules. Additionally, it does not represent amounts that have actually been earned or realized, including with respect to certain equity awards, for which performance conditions for these equity awards have not yet been realized. |
|
(3) |
The amounts shown for Average Summary Compensation Table Total for Non-PEO NEOs are the average amounts of total compensation reported for the Non-PEO Named Executive Officers for each corresponding year in the "Total" column of the Summary Compensation Table. Refer to the Summary Compensation Table on page 21 above. The individuals comprising the Non-PEO NEOs for each presented year are listed below: 2024 - Marc Gabelli, Patrick Huvane, and Christopher L. Nossokoff 2023 - Marc Gabelli, Patrick Huvane, James W. Tivy, and Linda Biles |
|
(4) |
Compensation Actually Paid reflects the exclusions and inclusions of certain amounts for the PEO and the Non-PEO NEOs as set forth below. Equity values are calculated in accordance with FASB ASC Topic 718. Amounts in the Exclusion of Stock Awards column are the totals from the "Stock Awards" column of the Summary Compensation Table. Refer to the Summary Compensation Table on page 21 above. |
|
PEO |
Summary Compensation Table Total |
Exclusion of Stock Awards |
Inclusion of Equity Values |
Compensation Actually Paid |
||||||||||||
|
2024 |
209,275 | — | (489 | ) | 208,786 | |||||||||||
|
2023 |
209,629 | (30,004 | ) | 34,718 | 214,343 | |||||||||||
|
Non-PEO NEOs |
Average Summary Compensation Table Total for Non-PEO NEOs ($) |
Average Exclusion of Stock Awards for Non-PEO NEOs ($) |
Inclusion of Equity Values for Non-PEO NEOs ($) |
Compensation Actually Paid to Non-PEO NEOs ($) |
||||||||||||
|
2024 |
124,742 | — | (122 | ) | 124,620 | |||||||||||
|
2023 |
12,500 | (3,751 | ) | 4,354 | 13,104 | |||||||||||
|
|
The amounts in the Inclusion of Equity Values in the tables above are derived from the amounts set forth in the following tables: |
|
PEO |
Year-End Fair Value of Equity Awards Granted During Year That Remained Unvested as of Last Day of Year |
Change in Fair Value from Last Day of Prior Year to Last Day of Year of Unvested Equity Awards |
Vesting-Date Fair Value of Equity Awards Granted During Year that Vested During Year |
Change in Fair Value from Last Day of Prior Year to Vesting Date of Unvested Equity Awards that Vested During Year |
Fair Value at Last Day of Prior Year of Equity Awards Forfeited During Year |
Total - Inclusion of Equity Values |
||||||||||||||||||
|
2024 |
— | (489 | ) | — | — | — | (489 | ) | ||||||||||||||||
|
2023 |
34,718 | — | — | — | — | 34,718 | ||||||||||||||||||
|
Non-PEO NEOs |
Average Year-End Fair Value of Equity Awards Granted During Year That Remained Unvested as of Last Day of Year for Non-PEO NEOs ($) |
Average Change in Fair Value from Last Day of Prior Year to Last Day of Year of Unvested Equity Awards for Non-PEO NEOs ($) |
Average Vesting-Date Fair Value of Equity Awards Granted During Year that Vested During Year for Non-PEO NEOs ($) |
Average Change in Fair Value from Last Day of Prior Year to Vesting Date of Unvested Equity Awards that Vested During Year for Non-PEO NEOs ($) |
Average Fair Value at Last Day of Prior Year of Equity Awards Forfeited During Year for Non-PEO NEOs ($) |
Total - Average Inclusion of Equity Values for Non-PEO NEOs ($) |
||||||||||||||||||
|
2024 |
— | (122 | ) | — | — | — | (122 | ) | ||||||||||||||||
|
2023 |
4,354 | — | — | — | — | 4,354 | ||||||||||||||||||
|
(5) |
The amounts shown for Value of Initial Fixed $100 Investment Based on Total Shareholder Return ("TSR") was set on December 31, 2020 and was adjusted for the impact of the spin-off of M-tron Industries, Inc. using the example allocation from the IRS Form 8937 which is posted on the Company's website. |
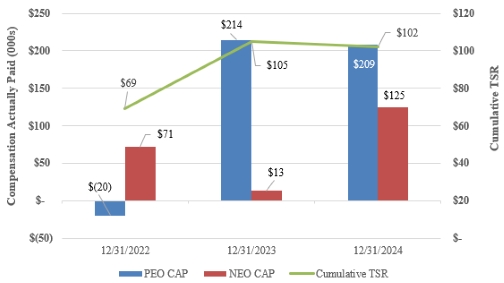
Relationship Between PEO and Non-PEO NEO Compensation Actually Paid and Total Shareholder Return
In accordance with SEC rules, the following chart sets forth the relationship between Compensation Actually Paid to our PEO, the average of Compensation Actually Paid to our Non-PEO NEOs, and the Company's cumulative TSR during the three most recently completed fiscal years.
PEO and Average Non-PEO NEO Compensation Actually Paid versus The LGL Group, Inc. Total Shareholder Return
All information provided herein under the heading Pay Versus Performance will not be deemed to be incorporated by reference into any filing made by us under the Securities Act or the Exchange Act, whether made before or after the date hereof and regardless of any general incorporation language included in any such filing, except to the extent we specifically incorporate such information by reference.
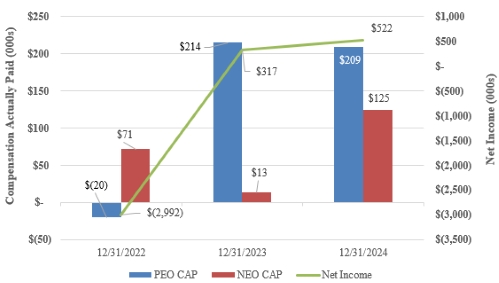
Relationship Between PEO and Non-PEO NEO Compensation Actually Paid and Net Income
In accordance with SEC rules, the following chart sets forth the relationship between Compensation Actually Paid to our PEO, the average of Compensation Actually Paid to our Non-PEO NEOs, and the Company's Net Income during the three most recently completed fiscal years.
PEO and Average Non-PEO NEO Compensation Actually Paid versus The LGL Group, Inc. Net Income