Pay | Performance | |||||||||||||||||||||||
|
|
|
|
|
|
|
|
|
| Cumulative Total |
|
|
| |||||||||||
Shareholder Return | ||||||||||||||||||||||||
PEO | Average of Non-PEO NEOs | (Value of Initial Fixed $100 Investment) | ||||||||||||||||||||||
SCT Total | Compensation | SCT Total | Compensation | Peer | Net | Basic Earnings | ||||||||||||||||||
Year (a) | Compensation | Actually Paid (b) | Compensation | Actually Paid (b) | HTH | Group (c) | Income ($M) | Per Share (d) | ||||||||||||||||
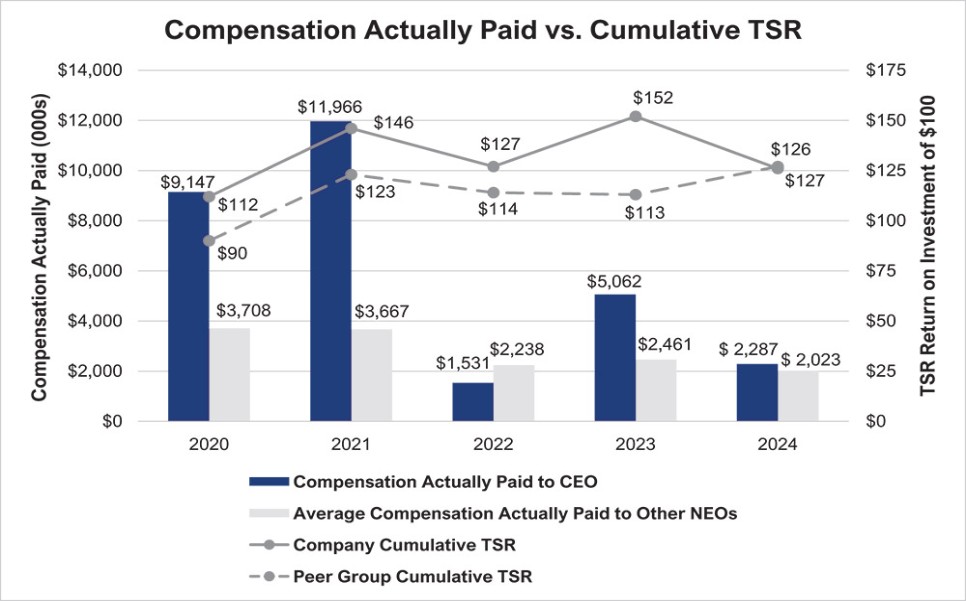
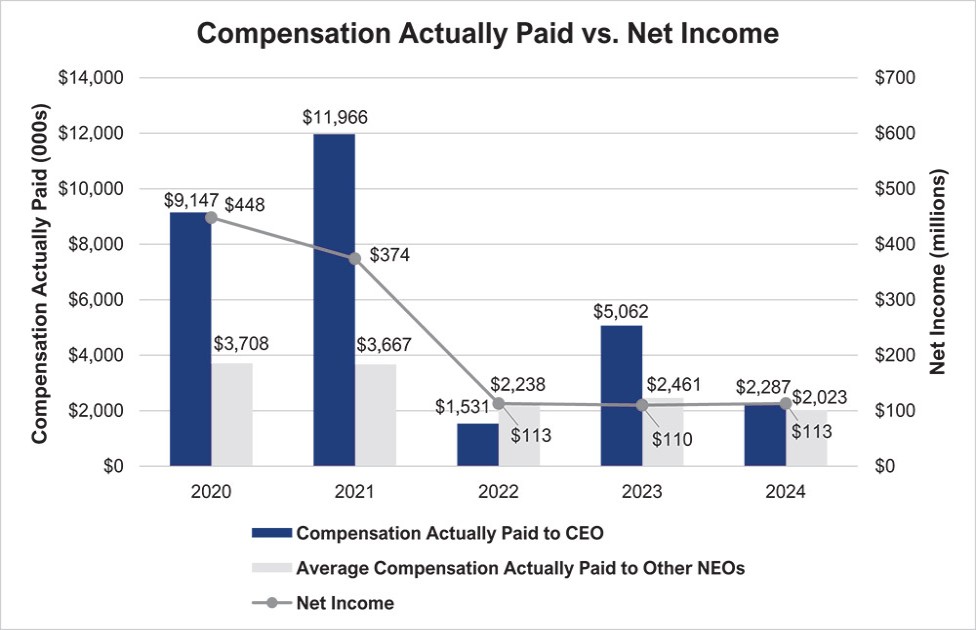
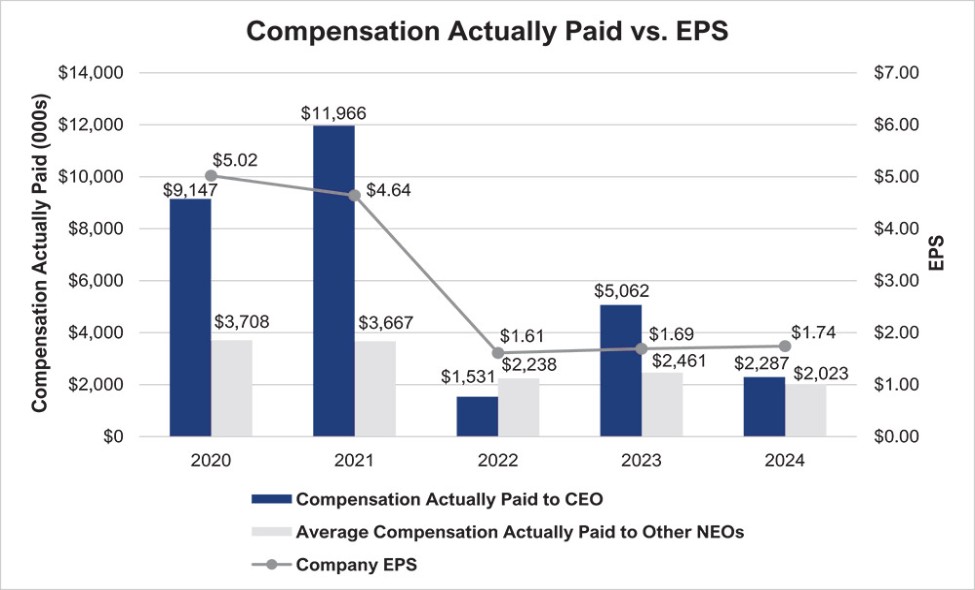
2024 | $ | 4,386,912 | $ | 2,287,072 | $ | 2,524,190 | $ | 2,022,813 | $ | 126 | $ | 127 | $ | 113 | $ | 1.74 | ||||||||
2023 | $ | 4,230,757 | $ | 5,062,081 | $ | 2,443,749 | $ | 2,460,899 | $ | 152 | $ | 113 | $ | 110 | $ | 1.69 | ||||||||
2022 | $ | 4,889,906 | $ | 1,531,156 | $ | 2,445,127 | $ | 2,237,700 | $ | 127 | $ | 114 | $ | 113 | $ | 1.61 | ||||||||
2021 | $ | 6,678,697 | $ | 11,966,446 | $ | 2,690,782 | $ | 3,667,347 | $ | 146 | $ | 123 | $ | 374 | $ | 4.64 | ||||||||
2020 | $ | 6,094,984 | $ | 9,147,376 | $ | 3,229,921 | $ | 3,707,625 | $ | 112 | $ | 90 | $ | 448 | $ | 5.02 | ||||||||
| (a) | For each covered year, the PEO was Mr. Jeremy B. Ford. For 2020-2023, the other NEOs were Messrs. Furr, Winges, Thompson, and Schaffner. For 2024, the other NEOs were Messrs. Furr, Winges, Thompson, Prestidge and Schaffner. |
| (b) | Amounts reported in this column are based on total compensation reported for our PEO and other NEOs in the Summary Compensation Table for the indicated fiscal years and adjusted as shown in the table below. Fair value of equity awards was computed in accordance with the Company’s methodology used for financial reporting purposes. |
| (c) | Pursuant to Item 402(v) of Regulation S-K, the Company used the same peer group used for purposes of Item 201(e) of Regulation S-K, the KBW NASDAQ Regional Bank Index. This reflects the corrected TSRs from 2020 to 2023 that has been updated due to a prior error. In prior year disclosures, the Pay Versus Performance table listed $88, $117, $106, and $102 for 2020, 2021, 2022 and 2023, respectively. |
| (d) | Represent Basic Earnings per Share as presented in our audited financial statements. |
2024 | 2023 | 2022 | 2021 | 2020 | |||||||||||||||||||||||||
Non-PEO | Non-PEO | Non-PEO | Non-PEO | Non-PEO | |||||||||||||||||||||||||
Adjustments | PEO |
| NEOs |
| PEO |
| NEOs |
| PEO |
| NEOs | PEO |
| NEOs | PEO |
| NEOs | ||||||||||||
Total from Summary Compensation Table | $ | 4,386,912 | $ | 2,524,190 | $ | 4,230,757 | $ | 2,443,749 | $ | 4,889,906 | $ | 2,445,127 | $ | 6,678,697 | $ | 2,690,782 | $ | 6,094,984 | $ | 3,229,921 | |||||||||
Subtract grant date fair value of equity awards reported in Summary Compensation Table for the covered year | (2,588,803) | (650,762) | (2,645,459) | (771,852) | (3,451,471) | (1,064,840) | (4,322,657) | (791,874) | (3,780,651) | (474,109) | |||||||||||||||||||
Add fair value at year-end of any equity awards granted in the covered year that are outstanding and unvested as of the end of the covered year | 2,133,572 | 530,845 | 2,167,801 | 651,786 | 2,655,725 | 777,458 | 6,062,446 | 1,106,608 | 6,058,037 | 781,492 | |||||||||||||||||||
Add/subtract change in fair value of awards granted in any prior year that are outstanding and unvested at end of covered year | (844,265) | (245,833) | 1,643,710 | 345,122 | (2,049,477) | (317,180) | 2,884,432 | 579,188 | 1,027,441 | 213,554 | |||||||||||||||||||
Add fair value as of the vesting date of any awards granted in the covered year that vested during the covered year | — | — | — | — | — | — | — | — | — | — | |||||||||||||||||||
Add/subtract change in fair value as of the vesting date of any equity awards granted in any prior year for which all applicable vesting conditions were satisfied during the covered year | (800,344) | (135,628) | 942,338 | 135,916 | (513,527) | 397,135 | 663,528 | 82,643 | (252,435) | (43,233) | |||||||||||||||||||
Subtract fair value of awards forfeited in current covered year determined at end of prior covered year | — | — | (1,277,066) | (343,821) | — | — | — | — | — | — | |||||||||||||||||||
Total Impact: Adjustments for stock and option awards | $ | (2,099,840) | $ | (501,378) | $ | 831,324 | $ | 17,150 | $ | (3,358,750) | $ | (207,427) | $ | 5,287,749 | $ | 976,565 | $ | 3,052,392 | $ | 477,704 | |||||||||
Compensation Actually Paid (as calculated) | $ | 2,287,072 | $ | 2,022,813 | $ | 5,062,081 | $ | 2,460,899 | $ | 1,531,156 | $ | 2,237,700 | $ | 11,966,446 | $ | 3,667,347 | $ | 9,147,376 | $ | 3,707,625 | |||||||||
| (a) | For each covered year, the PEO was Mr. Jeremy B. Ford. For 2020-2023, the other NEOs were Messrs. Furr, Winges, Thompson, and Schaffner. For 2024, the other NEOs were Messrs. Furr, Winges, Thompson, Prestidge and Schaffner. |
| (c) | Pursuant to Item 402(v) of Regulation S-K, the Company used the same peer group used for purposes of Item 201(e) of Regulation S-K, the KBW NASDAQ Regional Bank Index. This reflects the corrected TSRs from 2020 to 2023 that has been updated due to a prior error. In prior year disclosures, the Pay Versus Performance table listed $88, $117, $106, and $102 for 2020, 2021, 2022 and 2023, respectively. |
| (c) | Pursuant to Item 402(v) of Regulation S-K, the Company used the same peer group used for purposes of Item 201(e) of Regulation S-K, the KBW NASDAQ Regional Bank Index. This reflects the corrected TSRs from 2020 to 2023 that has been updated due to a prior error. In prior year disclosures, the Pay Versus Performance table listed $88, $117, $106, and $102 for 2020, 2021, 2022 and 2023, respectively. |
| (b) | Amounts reported in this column are based on total compensation reported for our PEO and other NEOs in the Summary Compensation Table for the indicated fiscal years and adjusted as shown in the table below. Fair value of equity awards was computed in accordance with the Company’s methodology used for financial reporting purposes. |
2024 | 2023 | 2022 | 2021 | 2020 | |||||||||||||||||||||||||
Non-PEO | Non-PEO | Non-PEO | Non-PEO | Non-PEO | |||||||||||||||||||||||||
Adjustments | PEO |
| NEOs |
| PEO |
| NEOs |
| PEO |
| NEOs | PEO |
| NEOs | PEO |
| NEOs | ||||||||||||
Total from Summary Compensation Table | $ | 4,386,912 | $ | 2,524,190 | $ | 4,230,757 | $ | 2,443,749 | $ | 4,889,906 | $ | 2,445,127 | $ | 6,678,697 | $ | 2,690,782 | $ | 6,094,984 | $ | 3,229,921 | |||||||||
Subtract grant date fair value of equity awards reported in Summary Compensation Table for the covered year | (2,588,803) | (650,762) | (2,645,459) | (771,852) | (3,451,471) | (1,064,840) | (4,322,657) | (791,874) | (3,780,651) | (474,109) | |||||||||||||||||||
Add fair value at year-end of any equity awards granted in the covered year that are outstanding and unvested as of the end of the covered year | 2,133,572 | 530,845 | 2,167,801 | 651,786 | 2,655,725 | 777,458 | 6,062,446 | 1,106,608 | 6,058,037 | 781,492 | |||||||||||||||||||
Add/subtract change in fair value of awards granted in any prior year that are outstanding and unvested at end of covered year | (844,265) | (245,833) | 1,643,710 | 345,122 | (2,049,477) | (317,180) | 2,884,432 | 579,188 | 1,027,441 | 213,554 | |||||||||||||||||||
Add fair value as of the vesting date of any awards granted in the covered year that vested during the covered year | — | — | — | — | — | — | — | — | — | — | |||||||||||||||||||
Add/subtract change in fair value as of the vesting date of any equity awards granted in any prior year for which all applicable vesting conditions were satisfied during the covered year | (800,344) | (135,628) | 942,338 | 135,916 | (513,527) | 397,135 | 663,528 | 82,643 | (252,435) | (43,233) | |||||||||||||||||||
Subtract fair value of awards forfeited in current covered year determined at end of prior covered year | — | — | (1,277,066) | (343,821) | — | — | — | — | — | — | |||||||||||||||||||
Total Impact: Adjustments for stock and option awards | $ | (2,099,840) | $ | (501,378) | $ | 831,324 | $ | 17,150 | $ | (3,358,750) | $ | (207,427) | $ | 5,287,749 | $ | 976,565 | $ | 3,052,392 | $ | 477,704 | |||||||||
Compensation Actually Paid (as calculated) | $ | 2,287,072 | $ | 2,022,813 | $ | 5,062,081 | $ | 2,460,899 | $ | 1,531,156 | $ | 2,237,700 | $ | 11,966,446 | $ | 3,667,347 | $ | 9,147,376 | $ | 3,707,625 | |||||||||
Most Important Financial Performance Measures
The following were the most important financial performance measures used by the Company to link executive compensation actually paid to the Company’s NEOs for the most recently completed fiscal year to the Company’s performance:
| ● | Total Shareholder Return (“TSR”) |
| ● | Basic Earnings Per Share (“EPS”) |
| ● | Net Income |
| (d) | Represent Basic Earnings per Share as presented in our audited financial statements. |