Pay vs Performance Disclosure
Apr. 13, 2022
Dec. 31, 2024
USD ($)
Dec. 31, 2023
USD ($)
Dec. 31, 2022
USD ($)
PAY VERSUS PERFORMANCE
As required by Section 953(a) of the Dodd-Frank Wall Street Reform and Consumer Protection Act and Item 402(v) of Regulation S-K, we are providing the following disclosure regarding
executive compensation for our principal executive officers (“PEOs”) and our other named executive officers (“Non-PEO NEOs”) and company performance for the fiscal years listed below. Our compensation committee did not consider
the pay versus performance disclosure below in making its pay decisions for any of the years shown. The amounts shown for “Compensation Actually Paid” (“CAP”) have been calculated in accordance with Item 402(v) of Regulation S-K
and do not reflect compensation actually earned, realized, or received by our named executive officers for any of the periods listed. These amounts reflect Summary Compensation Table (“SCT”) compensation with certain adjustments
as described in the following table and footnotes.
The following table shows the total compensation for our NEOs for the past three fiscal years as set forth in the SCT in this proxy statement and the prior year’s proxy statement,
the CAP to our PEO and on an average basis, our other NEOs (in each case, as determined under SEC rules), our TSR, our peer group TSR consisting of the S&P Aerospace & Defense Index, our net loss, and our Company-Selected
Measure, relative TSR percentile against the S&P 600 Index, which is the peer group used to determine performance for our NEOs’ PSU grants.
The majority of our NEOs’ target annual total compensation is variable in nature and “at-risk” and linked to our performance towards achieving key goals set by
our compensation committee that are aligned with our stockholders’ interests. Our CEO and average Non-PEO NEO CAP for 2024 was higher than the amount reflected in our SCT, reflecting an increase in our TSR.
|
Value of Initial
Fixed $100
Investment
Based on:
|
||||||||||
|
Year (1)
|
SCT Total
for PEO 1
($)
|
CAP to PEO
1 ($)(2)
|
SCT Total for
PEO 2 ($)
|
CAP to PEO
2 ($)(2)
|
Average
SCT Total for
non-PEO
NEOs ($)
|
Average
Compensation
Actually
Paid to
non-PEO
NEOs ($)(2)
|
TSR
$)(3)
|
Peer
Group
TSR
($)(4)
|
Net
Loss ($ millions
)(5)
|
Relative
TSR
Percentile
(%)(6)
|
|
2024
|
17,763,000
|
78,229,739
|
-
|
-
|
1,905,415
|
4,386,896
|
161.42
|
148.05
|
(537)
|
91
|
|
2023
|
1,003,750
|
27,950,070
|
-
|
-
|
3,627,746
|
11,188,491
|
101.66
|
118.20
|
(458)
|
99
|
|
2022
|
1,200,000
|
(45,146,083)
|
4,846,372
|
(46,473,291)
|
4,426,452
|
1,965,114
|
30.96
|
95.20
|
(317)
|
12
|
|
(1) Adam Goldstein served as our Chief Executive Officer
(PEO 1) for the entirety of the applicable years. Brett Adcock served as our co-Chief Executive Officer (PEO
2) for a portion of 2022. Our non-PEO NEOs were Mark Mesler and Tosha Perkins for 2022, Tom Muniz and Andy Missan for 2023, and Mark Mesler, Priya Gupta, Eric Lentell, Tom Muniz and Tosha Perkins for 2024.
|
|
(2) Compensation Actually Paid reflects the exclusions and inclusions of certain amounts from the total compensation amount reported in the SCT for the PEOs and the Non-PEO
NEOs as required by Item 402(v) of Regulation S-K, as set forth in the tables below. In making each of these adjustments, the “value” of an option or stock award is the fair value of the award on the applicable date
determined in accordance with FASB ASC Topic 718 using the valuation assumptions we then used to calculate the fair value of our equity awards. For more information on the valuation of our equity awards, please see the
notes to our financial statements that appear in our applicable Annual Report on Form 10-K and the footnotes to the SCT that appear in our applicable definitive proxy statement.
|
|
PEO 1
|
|||||||||
|
2024 ($)
|
2023 ($)
|
2022 ($)
|
|||||||
|
SCT Total
|
17,763,000
|
1,003,750
|
1,200,000
|
||||||
|
- Grant Date Fair Value of Option Awards and Stock Awards Granted in Fiscal Year
|
(16,487,500)
|
-
|
-
|
||||||
|
+ Fair Value at Fiscal Year-End of Outstanding and Unvested Option Awards and Stock Awards Granted in Fiscal Year
|
17,852,500
|
-
|
-
|
||||||
|
+ Change in Fair Value of Outstanding and Unvested Option Awards and Stock Awards Granted in Prior Fiscal Years
|
50,315,432
|
25,605,759
|
(44,531,306)
|
||||||
|
+ Fair Value at Vesting of Option Awards and Stock Awards Granted in Fiscal Year That Vested During Fiscal Year
|
-
|
-
|
-
|
||||||
|
+ Change in Fair Value as of Vesting Date of Option Awards and Stock Awards Granted in Prior Fiscal Years For Which Applicable Vesting Conditions Were Satisfied During Fiscal
Year
|
8,786,307
|
1,340,561
|
(1,814,777)
|
||||||
|
- Fair Value as of Prior Fiscal Year-End of Option Awards and Stock Awards Granted in Prior Fiscal Years That Failed to Meet Applicable Vesting Conditions During Fiscal Year
|
- |
-
|
-
|
||||||
|
Compensation Actually Paid
|
78,229,739
|
27,950,070
|
(45,146,083)
|
||||||
|
PEO 2
|
|||||||||
|
2024 ($)
|
2023 ($)
|
2022 ($)
|
|||||||
|
SCT Total
|
-
|
-
|
4,846,372
|
||||||
|
- Grant Date Fair Value of Option Awards and Stock Awards Granted in Fiscal Year
|
-
|
-
|
-
|
||||||
|
+ Fair Value at Fiscal Year-End of Outstanding and Unvested Option Awards and Stock Awards Granted in Fiscal Year
|
-
|
-
|
-
|
||||||
|
+ Change in Fair Value of Outstanding and Unvested Option Awards and Stock Awards Granted in Prior Fiscal Years
|
-
|
-
|
(48,722,460)
|
||||||
|
+ Fair Value at Vesting of Option Awards and Stock Awards Granted in Fiscal Year That Vested During Fiscal Year
|
-
|
-
|
-
|
||||||
|
+ Change in Fair Value as of Vesting Date of Option Awards and Stock Awards Granted in Prior Fiscal Years For Which Applicable Vesting Conditions Were Satisfied During Fiscal
Year
|
-
|
-
|
(2,597,203)
|
||||||
|
- Fair Value as of Prior Fiscal Year-End of Option Awards and Stock Awards Granted in Prior Fiscal Years That Failed to Meet Applicable Vesting Conditions During Fiscal Year
|
-
|
-
|
-
|
||||||
|
Compensation Actually Paid
|
-
|
-
|
(46,473,291)
|
||||||
|
Non-PEO NEOs (average)
|
|||||||||
|
2024 ($)
|
2023 ($)
|
2022 ($)
|
|||||||
| SCT Total |
1,905,415
|
3,627,746 | 4,426,452 | ||||||
|
- Grant Date Fair Value of Option Awards and Stock Awards Granted in Fiscal Year
|
(1,155,588)
|
(3,400,000) | (3,707,912) | ||||||
|
+ Fair Value at Fiscal Year-End of Outstanding and Unvested Option Awards and Stock Awards Granted in Fiscal Year
|
2,332,535
|
7,963,942 | 1,724,824 | ||||||
|
+ Change in Fair Value of Outstanding and Unvested Option Awards and Stock Awards Granted in Prior Fiscal Years
|
2,122,257
|
2,058,096 | (364,875) | ||||||
|
+ Fair Value at Vesting of Option Awards and Stock Awards Granted in Fiscal Year That Vested During Fiscal Year
|
104,437
|
171,606 | - | ||||||
|
+ Change in Fair Value as of Vesting Date of Option Awards and Stock Awards Granted in Prior Fiscal Years For Which Applicable Vesting Conditions Were Satisfied During Fiscal
Year
|
(922,160)
|
767,101 | (113,375) | ||||||
|
- Fair Value as of Prior Fiscal Year-End of Option Awards and Stock Awards Granted in Prior Fiscal Years That Failed to Meet Applicable Vesting Conditions During Fiscal Year
|
-
|
- | - | ||||||
|
Compensation Actually Paid
|
4,386,896
|
11,188,491 | 1,965,114 | ||||||
|
(3) Archer’s TSR was determined based on the value of an initial fixed investment of $100, as of December 31, 2021, including the reinvestment of any dividends.
|
|
(4) The peer group used in this table is the S&P Aerospace & Defense Select Index, which is the same peer group that we use for purposes of the stock performance
graph contained in our Annual Report on Form 10-K for the year ended December 31, 2024.
|
|
(5) Represents the Company’s net loss reflected in the Company’s audited financial statements.
|
|
(6) Our Company-Selected Measure is Relative TSR consistent
with the peer group used in the PSU metric under our annual Long-Term Incentive Program. For illustrative purposes, calculations within this column are based on 1-year measurements (as opposed to the 1-, 2-, and 3-year
relative TSR performance period regarding the Company’s PSUs). For purposes of Relative TSR, the peer group used in the PSU metric under our annual Long-Term Incentive Program consists of: (i) the S&P 600 Index.
|
|
(1) Adam Goldstein served as our Chief Executive Officer
(PEO 1) for the entirety of the applicable years. Brett Adcock served as our co-Chief Executive Officer (PEO
2) for a portion of 2022. Our non-PEO NEOs were Mark Mesler and Tosha Perkins for 2022, Tom Muniz and Andy Missan for 2023, and Mark Mesler, Priya Gupta, Eric Lentell, Tom Muniz and Tosha Perkins for 2024.
|
|
(4) The peer group used in this table is the S&P Aerospace & Defense Select Index, which is the same peer group that we use for purposes of the stock performance
graph contained in our Annual Report on Form 10-K for the year ended December 31, 2024.
|
|
(2) Compensation Actually Paid reflects the exclusions and inclusions of certain amounts from the total compensation amount reported in the SCT for the PEOs and the Non-PEO
NEOs as required by Item 402(v) of Regulation S-K, as set forth in the tables below. In making each of these adjustments, the “value” of an option or stock award is the fair value of the award on the applicable date
determined in accordance with FASB ASC Topic 718 using the valuation assumptions we then used to calculate the fair value of our equity awards. For more information on the valuation of our equity awards, please see the
notes to our financial statements that appear in our applicable Annual Report on Form 10-K and the footnotes to the SCT that appear in our applicable definitive proxy statement.
|
|
PEO 1
|
|||||||||
|
2024 ($)
|
2023 ($)
|
2022 ($)
|
|||||||
|
SCT Total
|
17,763,000
|
1,003,750
|
1,200,000
|
||||||
|
- Grant Date Fair Value of Option Awards and Stock Awards Granted in Fiscal Year
|
(16,487,500)
|
-
|
-
|
||||||
|
+ Fair Value at Fiscal Year-End of Outstanding and Unvested Option Awards and Stock Awards Granted in Fiscal Year
|
17,852,500
|
-
|
-
|
||||||
|
+ Change in Fair Value of Outstanding and Unvested Option Awards and Stock Awards Granted in Prior Fiscal Years
|
50,315,432
|
25,605,759
|
(44,531,306)
|
||||||
|
+ Fair Value at Vesting of Option Awards and Stock Awards Granted in Fiscal Year That Vested During Fiscal Year
|
-
|
-
|
-
|
||||||
|
+ Change in Fair Value as of Vesting Date of Option Awards and Stock Awards Granted in Prior Fiscal Years For Which Applicable Vesting Conditions Were Satisfied During Fiscal
Year
|
8,786,307
|
1,340,561
|
(1,814,777)
|
||||||
|
- Fair Value as of Prior Fiscal Year-End of Option Awards and Stock Awards Granted in Prior Fiscal Years That Failed to Meet Applicable Vesting Conditions During Fiscal Year
|
- |
-
|
-
|
||||||
|
Compensation Actually Paid
|
78,229,739
|
27,950,070
|
(45,146,083)
|
||||||
|
PEO 2
|
|||||||||
|
2024 ($)
|
2023 ($)
|
2022 ($)
|
|||||||
|
SCT Total
|
-
|
-
|
4,846,372
|
||||||
|
- Grant Date Fair Value of Option Awards and Stock Awards Granted in Fiscal Year
|
-
|
-
|
-
|
||||||
|
+ Fair Value at Fiscal Year-End of Outstanding and Unvested Option Awards and Stock Awards Granted in Fiscal Year
|
-
|
-
|
-
|
||||||
|
+ Change in Fair Value of Outstanding and Unvested Option Awards and Stock Awards Granted in Prior Fiscal Years
|
-
|
-
|
(48,722,460)
|
||||||
|
+ Fair Value at Vesting of Option Awards and Stock Awards Granted in Fiscal Year That Vested During Fiscal Year
|
-
|
-
|
-
|
||||||
|
+ Change in Fair Value as of Vesting Date of Option Awards and Stock Awards Granted in Prior Fiscal Years For Which Applicable Vesting Conditions Were Satisfied During Fiscal
Year
|
-
|
-
|
(2,597,203)
|
||||||
|
- Fair Value as of Prior Fiscal Year-End of Option Awards and Stock Awards Granted in Prior Fiscal Years That Failed to Meet Applicable Vesting Conditions During Fiscal Year
|
-
|
-
|
-
|
||||||
|
Compensation Actually Paid
|
-
|
-
|
(46,473,291)
|
||||||
|
Non-PEO NEOs (average)
|
|||||||||
|
2024 ($)
|
2023 ($)
|
2022 ($)
|
|||||||
| SCT Total |
1,905,415
|
3,627,746 | 4,426,452 | ||||||
|
- Grant Date Fair Value of Option Awards and Stock Awards Granted in Fiscal Year
|
(1,155,588)
|
(3,400,000) | (3,707,912) | ||||||
|
+ Fair Value at Fiscal Year-End of Outstanding and Unvested Option Awards and Stock Awards Granted in Fiscal Year
|
2,332,535
|
7,963,942 | 1,724,824 | ||||||
|
+ Change in Fair Value of Outstanding and Unvested Option Awards and Stock Awards Granted in Prior Fiscal Years
|
2,122,257
|
2,058,096 | (364,875) | ||||||
|
+ Fair Value at Vesting of Option Awards and Stock Awards Granted in Fiscal Year That Vested During Fiscal Year
|
104,437
|
171,606 | - | ||||||
|
+ Change in Fair Value as of Vesting Date of Option Awards and Stock Awards Granted in Prior Fiscal Years For Which Applicable Vesting Conditions Were Satisfied During Fiscal
Year
|
(922,160)
|
767,101 | (113,375) | ||||||
|
- Fair Value as of Prior Fiscal Year-End of Option Awards and Stock Awards Granted in Prior Fiscal Years That Failed to Meet Applicable Vesting Conditions During Fiscal Year
|
-
|
- | - | ||||||
|
Compensation Actually Paid
|
4,386,896
|
11,188,491 | 1,965,114 | ||||||
|
(2) Compensation Actually Paid reflects the exclusions and inclusions of certain amounts from the total compensation amount reported in the SCT for the PEOs and the Non-PEO
NEOs as required by Item 402(v) of Regulation S-K, as set forth in the tables below. In making each of these adjustments, the “value” of an option or stock award is the fair value of the award on the applicable date
determined in accordance with FASB ASC Topic 718 using the valuation assumptions we then used to calculate the fair value of our equity awards. For more information on the valuation of our equity awards, please see the
notes to our financial statements that appear in our applicable Annual Report on Form 10-K and the footnotes to the SCT that appear in our applicable definitive proxy statement.
|
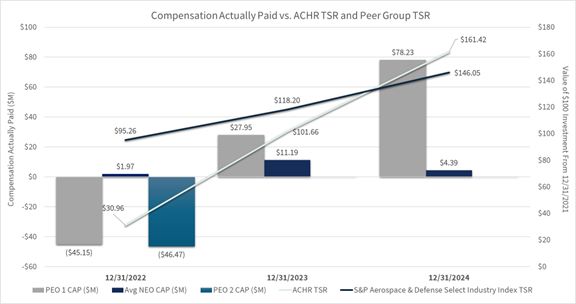
The chart below compares the compensation actually paid to the PEOs, the average of compensation actually paid to our remaining NEOs and the TSR performance of our
stock price and the TSR performance of the disclosed peer group, the S&P Aerospace & Defense Select Industry Index. Changes in compensation actually paid is generally proportional to changes in our Class A common stock
price since changes in the fair value of the NEOs’ equity awards are directly impacted by our stock price. Our stock price during the covered period has fluctuated significantly, much of which was driven by factors external to
our business. Since equity awards comprise a significant portion of the total compensation of our NEOs, compensation actually paid inherently fluctuates with our TSR.
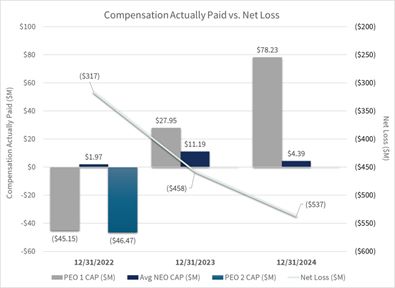
The chart below sets forth the relationship between compensation actually paid to the PEOs, the average of compensation actually paid to our non-PEO NEOs and our net loss during the three most recently
completed fiscal years. We do not use net loss as a performance measure in our overall executive compensation program. The compensation actually paid to our NEOs is not aligned with our net loss, as shown below, primarily due to
the significant portion of compensation actually paid to NEOs is equity awards, a result of which is much greater sensitivity of compensation actually paid to our Class A common stock price.
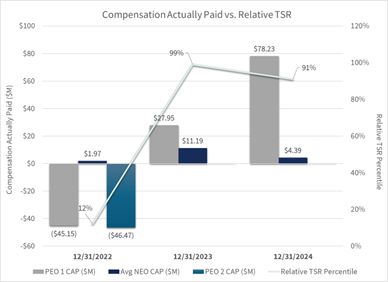
Description of Relationship Between PEO and Non-PEO NEO Compensation Actually Paid and Annual Relative Total Shareholder Percentile
The chart below sets forth the relationship between compensation actually paid to the PEOs, the average of compensation actually paid to our non-PEO NEOs and our annual relative TSR.
Since our PSUs are based on relative TSR, relative TSR percentile directly impacts the fair value of outstanding PSU grants to the NEOs. Higher relative TSR percentile increases the fair value of the outstanding PSUs and
conversely lower relative TSR percentile decreases the fair value of outstanding PSUs.
The chart below compares the compensation actually paid to the PEOs, the average of compensation actually paid to our remaining NEOs and the TSR performance of our
stock price and the TSR performance of the disclosed peer group, the S&P Aerospace & Defense Select Industry Index. Changes in compensation actually paid is generally proportional to changes in our Class A common stock
price since changes in the fair value of the NEOs’ equity awards are directly impacted by our stock price. Our stock price during the covered period has fluctuated significantly, much of which was driven by factors external to
our business. Since equity awards comprise a significant portion of the total compensation of our NEOs, compensation actually paid inherently fluctuates with our TSR.
In 2024, the compensation actually paid to our NEOs is linked to Company performance through our 2024 Annual Bonus Plan and Long-Term Incentive Program, which are
described in more detail in the CD&A. We do not currently use any financial performance measures to link executive compensation actually paid to Company performance. However, the most important performance measures used by
the Company for NEOs’ 2024 compensation decisions are listed below.
|
-
|
Goals related to advancing manufacturing objectives
|
|
-
|
Goals related to advancing flight test program
|
|
-
|
Goals related to advancing FAA certification
|
|
-
|
Goals related to advancing commercialization objectives
|
|
-
|
Annual cash burn relative to board-approved budget
|
|
-
|
Relative TSR compared to the S&P 600 Index
|