Summary Compensation Table Total for PEO | Compensation Actually Paid to PEO | Average Summary Compensation Total for Non- PEO Named Executive Officers | Average Compensation Actually Paid to Non- PEO Named Executive Officers | Value of Initial Fixed $100 Investment Based on Total Shareholder Return | Net Loss | |||||||||||||
Year | (1) | (2) | (1) | (2) | (3) | (in thousands) (4) | ||||||||||||
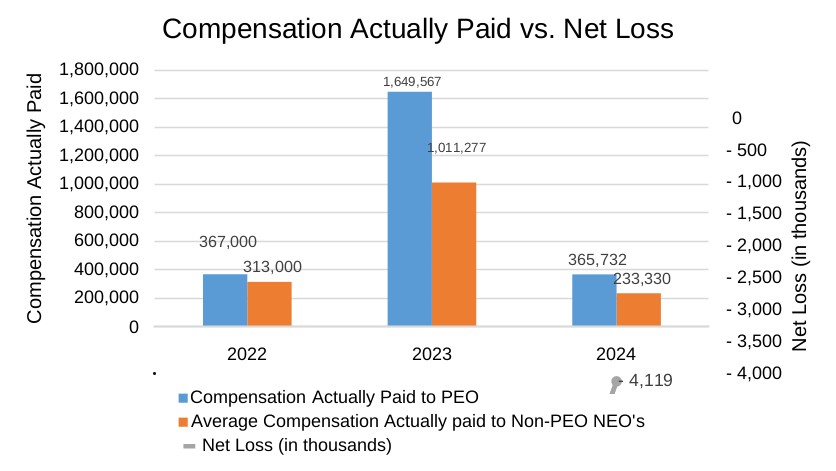
2024 | $ | 365,732 | $ | 365,732 | $ | 233,330 | $ | 233,330 | $ | 69 | $ | (4,119) | ||||||
2023 | $ | 1,649,567 | $ | 1,649,567 | $ | 1,011,277 | $ | 1,011,277 | $ | 79 | $ | (12,147) | ||||||
2022 | $ | 395,622 | $ | 367,297 | $ | 326,895 | $ | 312,733 | $ | 84 | $ | (18,645) | ||||||
(1) | In 2023 from January 1, 2023 until November 20, 2023 and all of 2022, Stephen Jumper was our Chief Executive Officer (“PEO”) and our remaining Named Executive Officers (“NEO’s”) consisted of James Brata and Ray Tobias. Beginning November 20, 2023 until December 31, 2024, Tony Clark was our PEO and our remaining NEO’s were Ray Mays and Ian Shaw. Calculation of compensation for 2023 was done with a weighted average of 89% for Messrs. Jumper, Brata and Tobias and 11% for Messrs. Clark, Mays and Shaw. |
(2) | See tables below for adjustments made to the summary compensation totals to calculate the compensation actually paid. |
(3) | Assumes $100 invested in our common shares on December 31, 2021, and is calculated based on the difference between the share price of our Common Stock at the end and the beginning of the measurement period, and reinvestment of all dividends. |
(4) | The dollar amounts reported represent the amount of net loss reflected in our consolidated audited financial statements for the applicable year. |
Adjustments to Determine Compensation "Actually Paid" for PEO |
| 2024 |
| 2023 | 2022 | ||||
Reported Weighted Average Summary Compensation Table total for PEO | $ | 365,732 | $ | 1,649,567 | $ | 395,622 | |||
Increase/deduction for Change in Fair Value from Prior Year-end to vesting Date of Awards Granted Prior to year that vested during year | - | - | (28,325) | ||||||
Total Adjustments | $ | - | $ | - | $ | (28,325) | |||
Weighted Average Compensation Actually paid to PEO | $ | 365,732 | $ | 1,649,567 | $ | 367,297 | |||
Adjustments to Determine Compensation "Actually Paid" for Non-PEO NEO's |
| 2024 |
| 2023 | 2022 | ||||
Reported Weighted Average Summary Compensation Table total for Non-PEO NEO's | $ | 233,330 | $ | 1,011,277 | $ | 326,895 | |||
Increase/deduction for Change in Fair Value from Prior Year-end to vesting Date of Awards Granted Prior to year that vested during year | - | - | (14,163) | ||||||
Total Adjustments | $ | - | $ | - | $ | (14,163) | |||
Weighted Average Compensation Actually paid to Non-PEO NEO's | $ | 233,330 | $ | 1,011,277 | $ | 312,733 | |||
(1) | In 2023 from January 1, 2023 until November 20, 2023 and all of 2022, Stephen Jumper was our Chief Executive Officer (“PEO”) and our remaining Named Executive Officers (“NEO’s”) consisted of James Brata and Ray Tobias. Beginning November 20, 2023 until December 31, 2024, Tony Clark was our PEO and our remaining NEO’s were Ray Mays and Ian Shaw. Calculation of compensation for 2023 was done with a weighted average of 89% for Messrs. Jumper, Brata and Tobias and 11% for Messrs. Clark, Mays and Shaw. |
Adjustments to Determine Compensation "Actually Paid" for PEO |
| 2024 |
| 2023 | 2022 | ||||
Reported Weighted Average Summary Compensation Table total for PEO | $ | 365,732 | $ | 1,649,567 | $ | 395,622 | |||
Increase/deduction for Change in Fair Value from Prior Year-end to vesting Date of Awards Granted Prior to year that vested during year | - | - | (28,325) | ||||||
Total Adjustments | $ | - | $ | - | $ | (28,325) | |||
Weighted Average Compensation Actually paid to PEO | $ | 365,732 | $ | 1,649,567 | $ | 367,297 | |||
Adjustments to Determine Compensation "Actually Paid" for Non-PEO NEO's |
| 2024 |
| 2023 | 2022 | ||||
Reported Weighted Average Summary Compensation Table total for Non-PEO NEO's | $ | 233,330 | $ | 1,011,277 | $ | 326,895 | |||
Increase/deduction for Change in Fair Value from Prior Year-end to vesting Date of Awards Granted Prior to year that vested during year | - | - | (14,163) | ||||||
Total Adjustments | $ | - | $ | - | $ | (14,163) | |||
Weighted Average Compensation Actually paid to Non-PEO NEO's | $ | 233,330 | $ | 1,011,277 | $ | 312,733 | |||