v3.25.1
Pay vs Performance Disclosure - USD ($)
12 Months Ended
Dec. 31, 2024
Dec. 31, 2023
Dec. 31, 2022
Dec. 31, 2021
Dec. 31, 2020
Pay vs Performance Disclosure          
Pay vs Performance Disclosure, Table

Pay Versus Performance

As required by Section 953(a) of the Dodd-Frank Wall Street Reform and Consumer Protection Act and with Item 402(v) of Regulation S-K, we provide the following disclosure regarding “executive compensation actually paid” (CAP), calculated in accordance with the SEC rules, and certain Company performance for the years listed below.

This disclosure was prepared in accordance with the requirements of Item 402(v) and does not necessarily reflect the value actually realized by our executives, how our executives’ compensation relates to Company performance, or how the Compensation Committee evaluates compensation decisions in light of Company or individual performance. For example, the Compensation Committee does not use CAP as a basis for making

compensation decisions, nor does it use net income (as reflected below) for purposes of determining our executive’s incentive compensation. Please refer to our Compensation Discussion and Analysis for a complete description of how executive compensation relates to Company performance and how the Compensation Committee makes its compensation decisions.

The information provided under this Pay versus Performance section will not be deemed to be incorporated by reference into any filing made by the Company under the Securities Act of 1933, as amended, or the Securities Exchange Act of 1934, as amended, except to the extent the Company specifically incorporates it by reference.


Value of Initial Fixed $100 Investment Based On:


Year
(a)

Summary
Compensation
Table Total
for PEO
(1)
(b)

Compensation
Actually Paid
to PEO
(2)
(c)

Average Summary
Compensation
Table for
Non-PEO NEOs
(1)
(d)

Average
Compensation
Actually Paid to
Non-PEO NEOs
(2)
(e)

Total
Stockholder
Return
(f)

Peer Group
Total Stockholder
Return
(3)
(g)

After Tax
Net Income
(in millions)
(h)

Adjusted
EBITDA
(in millions)
(i)
(4)

2024

$35,873,916

$44,261,401

$4,413,675

$4,568,815

$155

$73

$683

$2,004

2023

29,111,039

27,390,527

3,736,527

3,436,887

147

60

270

1,469

2022

39,318,892

44,590,917

2,405,595

3,205,364

159

66

944

2,223

2021

21,145,853

36,963,649

2,395,200

4,041,589

135

89

830

1,905

2020

23,564,264

17,368,770

3,934,418

3,771,789

95

88

808

1,996


(1)
Perry A. Sook served as the Company’s PEO (Chairman and Chief Executive Officer) for each year presented. The dollar amounts shown in column (b) are the amounts of total compensation reported for Mr. Sook for each corresponding year in the “Total” column of the Summary Compensation Table (“SCT”). The dollar amounts reported in column (d) represent the average of the amounts reported for the Company’s non-PEO NEOs as a group in the “Total” column of the SCT in each applicable year. The individuals comprising the non-PEO NEO for each year presented are listed below:


2024

2023

2022

2021

2020

Michael Biard(5)

Michael Biard(5)

Thomas E. Carter(5)

Thomas E. Carter

Thomas E. Carter

Lee Ann Gliha

Lee Ann Gliha

Lee Ann Gliha

Lee Ann Gliha

Timothy C. Bush(6)

Sean Compton

Dana Zimmer

Dana Zimmer

Dana Zimmer

Dana Zimmer

Dana Zimmer

Michael Strober(8)

Andrew Alford

Andrew Alford

Gregory R. Raifman(7)


Sean Compton

Sean Compton


(2)
The dollar amounts shown for CAP in columns (c) and (e) have been calculated in accordance with Item 402(v) of Regulation S-K and do not reflect compensation actually earned, realized, or received by the PEO and non-PEO NEOs. The following is a reconciliation of the “Total” column of SCT and the CAP for the year ended December 31, 2024. In calculating the CAP amounts reflected in these columns, the fair value or change in fair value, as applicable, of the equity award adjustments included in such calculations was computed in accordance with FASB ASC Topic 718. The valuation assumptions used to calculate such fair values did not materially differ from those disclosed at the time of grant.


2024


PEO

Non-PEO NEOs


Summary Compensation Table

$35,873,916

$4,413,675

Less: Grant date fair value of equity awards made during the applicable year and unvested at applicable year end

(27,746,271)

(1,797,215)

Plus: Year-end fair value of equity awards made during the applicable year and unvested at applicable year end

26,798,441

1,809,334

Change in fair value of equity awards made in prior years and unvested at applicable year end

3,698,638

11,071

Change in fair value of equity awards made in prior years and vested during applicable year

5,636,677

131,950

Less: Fair value of equity awards made in prior years that are forfeited during applicable year


Compensation Actually Paid

$44,261,401

$4,568,815


(3)
Represents the weighted peer group cumulative TSR, weighted according to the respective companies’ stock market capitalization at the beginning of each period for which a return is indicated. The peer group is comprised of the following publicly traded companies identified in Part 2, Item 5. of our 2024 Form 10-K as of December 31, 2024: Gray Media, Inc., TEGNA Inc., Sinclair, Inc., The E.W. Scripps Company, Fox Corporation and Paramount Global.
(4)
For purposes of determining eligibility for annual cash bonus payments and performance vesting under performance-based restricted stock units, the Company uses its calculation of Adjusted EBITDA (which is calculated in a manner consistent with the calculation of EBITDA that is referenced in the employment agreement) which is the primary financial metric it uses in its annual and quarterly earnings releases. A reconciliation of Adjusted EBITDA to Net Income for the year ended December 31, 2024 can be found on the Company’s Q4 2024 earnings release filed with the SEC on February 27, 2025 (Exhibit 99.1 to Current Report on Form 8-K).
(5)
Effective August 21, 2023, Mr. Carter transitioned from his role as President and Chief Operating Officer to a role as a Senior Advisor, and Mr. Biard was appointed as President and Chief Operating Officer.
(6)
On June 1, 2021, Mr. Busch retired from his position at Nexstar.
(7)
On March 31, 2021, Mr. Raifman’s employment agreement with the Company ended and was not renewed.
(8)
On December 31, 2024, Mr. Strober’s employment was terminated.
       
Company Selected Measure Name Adjusted EBITDA        
Named Executive Officers, Footnote Perry A. Sook served as the Company’s PEO (Chairman and Chief Executive Officer) for each year presented.The individuals comprising the non-PEO NEO for each year presented are listed below:


2024

2023

2022

2021

2020

Michael Biard(5)

Michael Biard(5)

Thomas E. Carter(5)

Thomas E. Carter

Thomas E. Carter

Lee Ann Gliha

Lee Ann Gliha

Lee Ann Gliha

Lee Ann Gliha

Timothy C. Bush(6)

Sean Compton

Dana Zimmer

Dana Zimmer

Dana Zimmer

Dana Zimmer

Dana Zimmer

Michael Strober(8)

Andrew Alford

Andrew Alford

Gregory R. Raifman(7)


Sean Compton

Sean Compton


Peer Group Issuers, Footnote The peer group is comprised of the following publicly traded companies identified in Part 2, Item 5. of our 2024 Form 10-K as of December 31, 2024: Gray Media, Inc., TEGNA Inc., Sinclair, Inc., The E.W. Scripps Company, Fox Corporation and Paramount Global.        
Changed Peer Group, Footnote
(5)
Effective August 21, 2023, Mr. Carter transitioned from his role as President and Chief Operating Officer to a role as a Senior Advisor, and Mr. Biard was appointed as President and Chief Operating Officer.
       
PEO Total Compensation Amount $ 35,873,916 $ 29,111,039 $ 39,318,892 $ 21,145,853 $ 23,564,264
PEO Actually Paid Compensation Amount 44,261,401 27,390,527 44,590,917 36,963,649 17,368,770
Non-PEO NEO Average Total Compensation Amount 4,413,675 3,736,527 2,405,595 2,395,200 3,934,418
Non-PEO NEO Average Compensation Actually Paid Amount $ 4,568,815 3,436,887 3,205,364 4,041,589 3,771,789
Compensation Actually Paid vs. Total Shareholder Return

img152504772_23.jpg

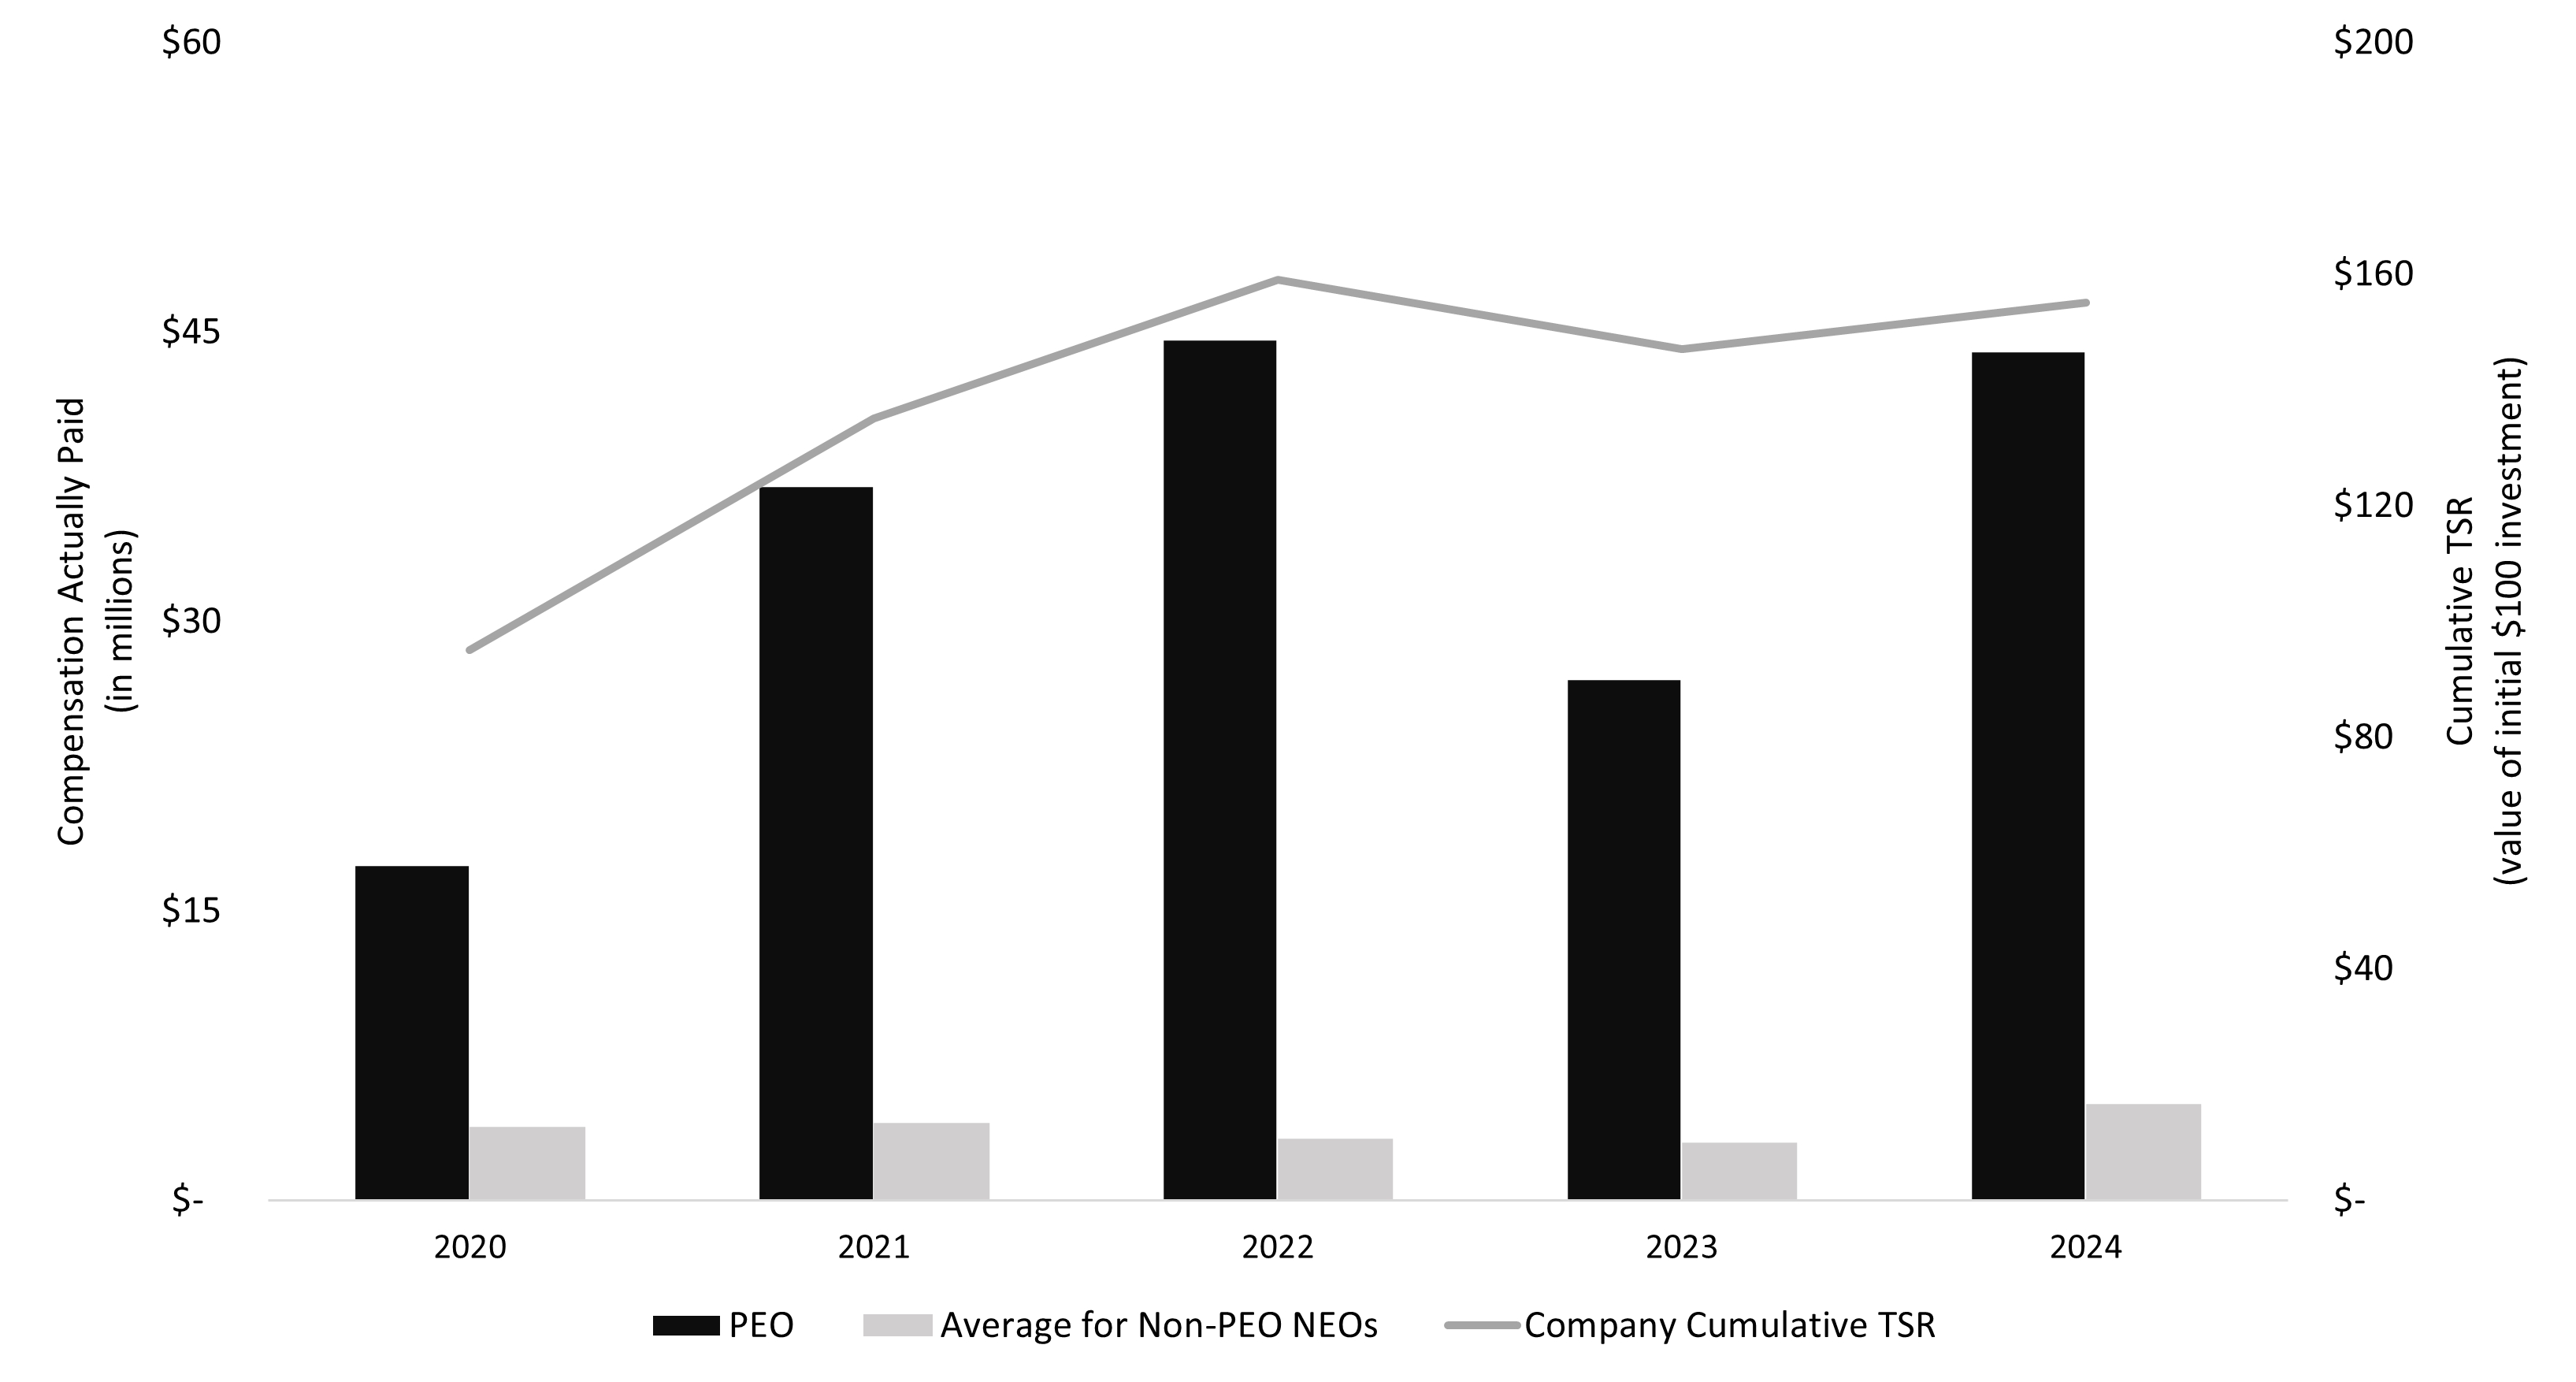
Compensation Actually Paid (in millions) $- $15 $30 $45 $60 2020 2021 2022 2023 2024 $-$40 $80 $120 $160 $200 PEO Average for Non-PEO NEOs Company Cumulative TSR Company Cumulative TSR (Value of Initial $100 investment)

       
Compensation Actually Paid vs. Net Income img152504772_25.jpg        
Compensation Actually Paid vs. Company Selected Measure

img152504772_26.jpg

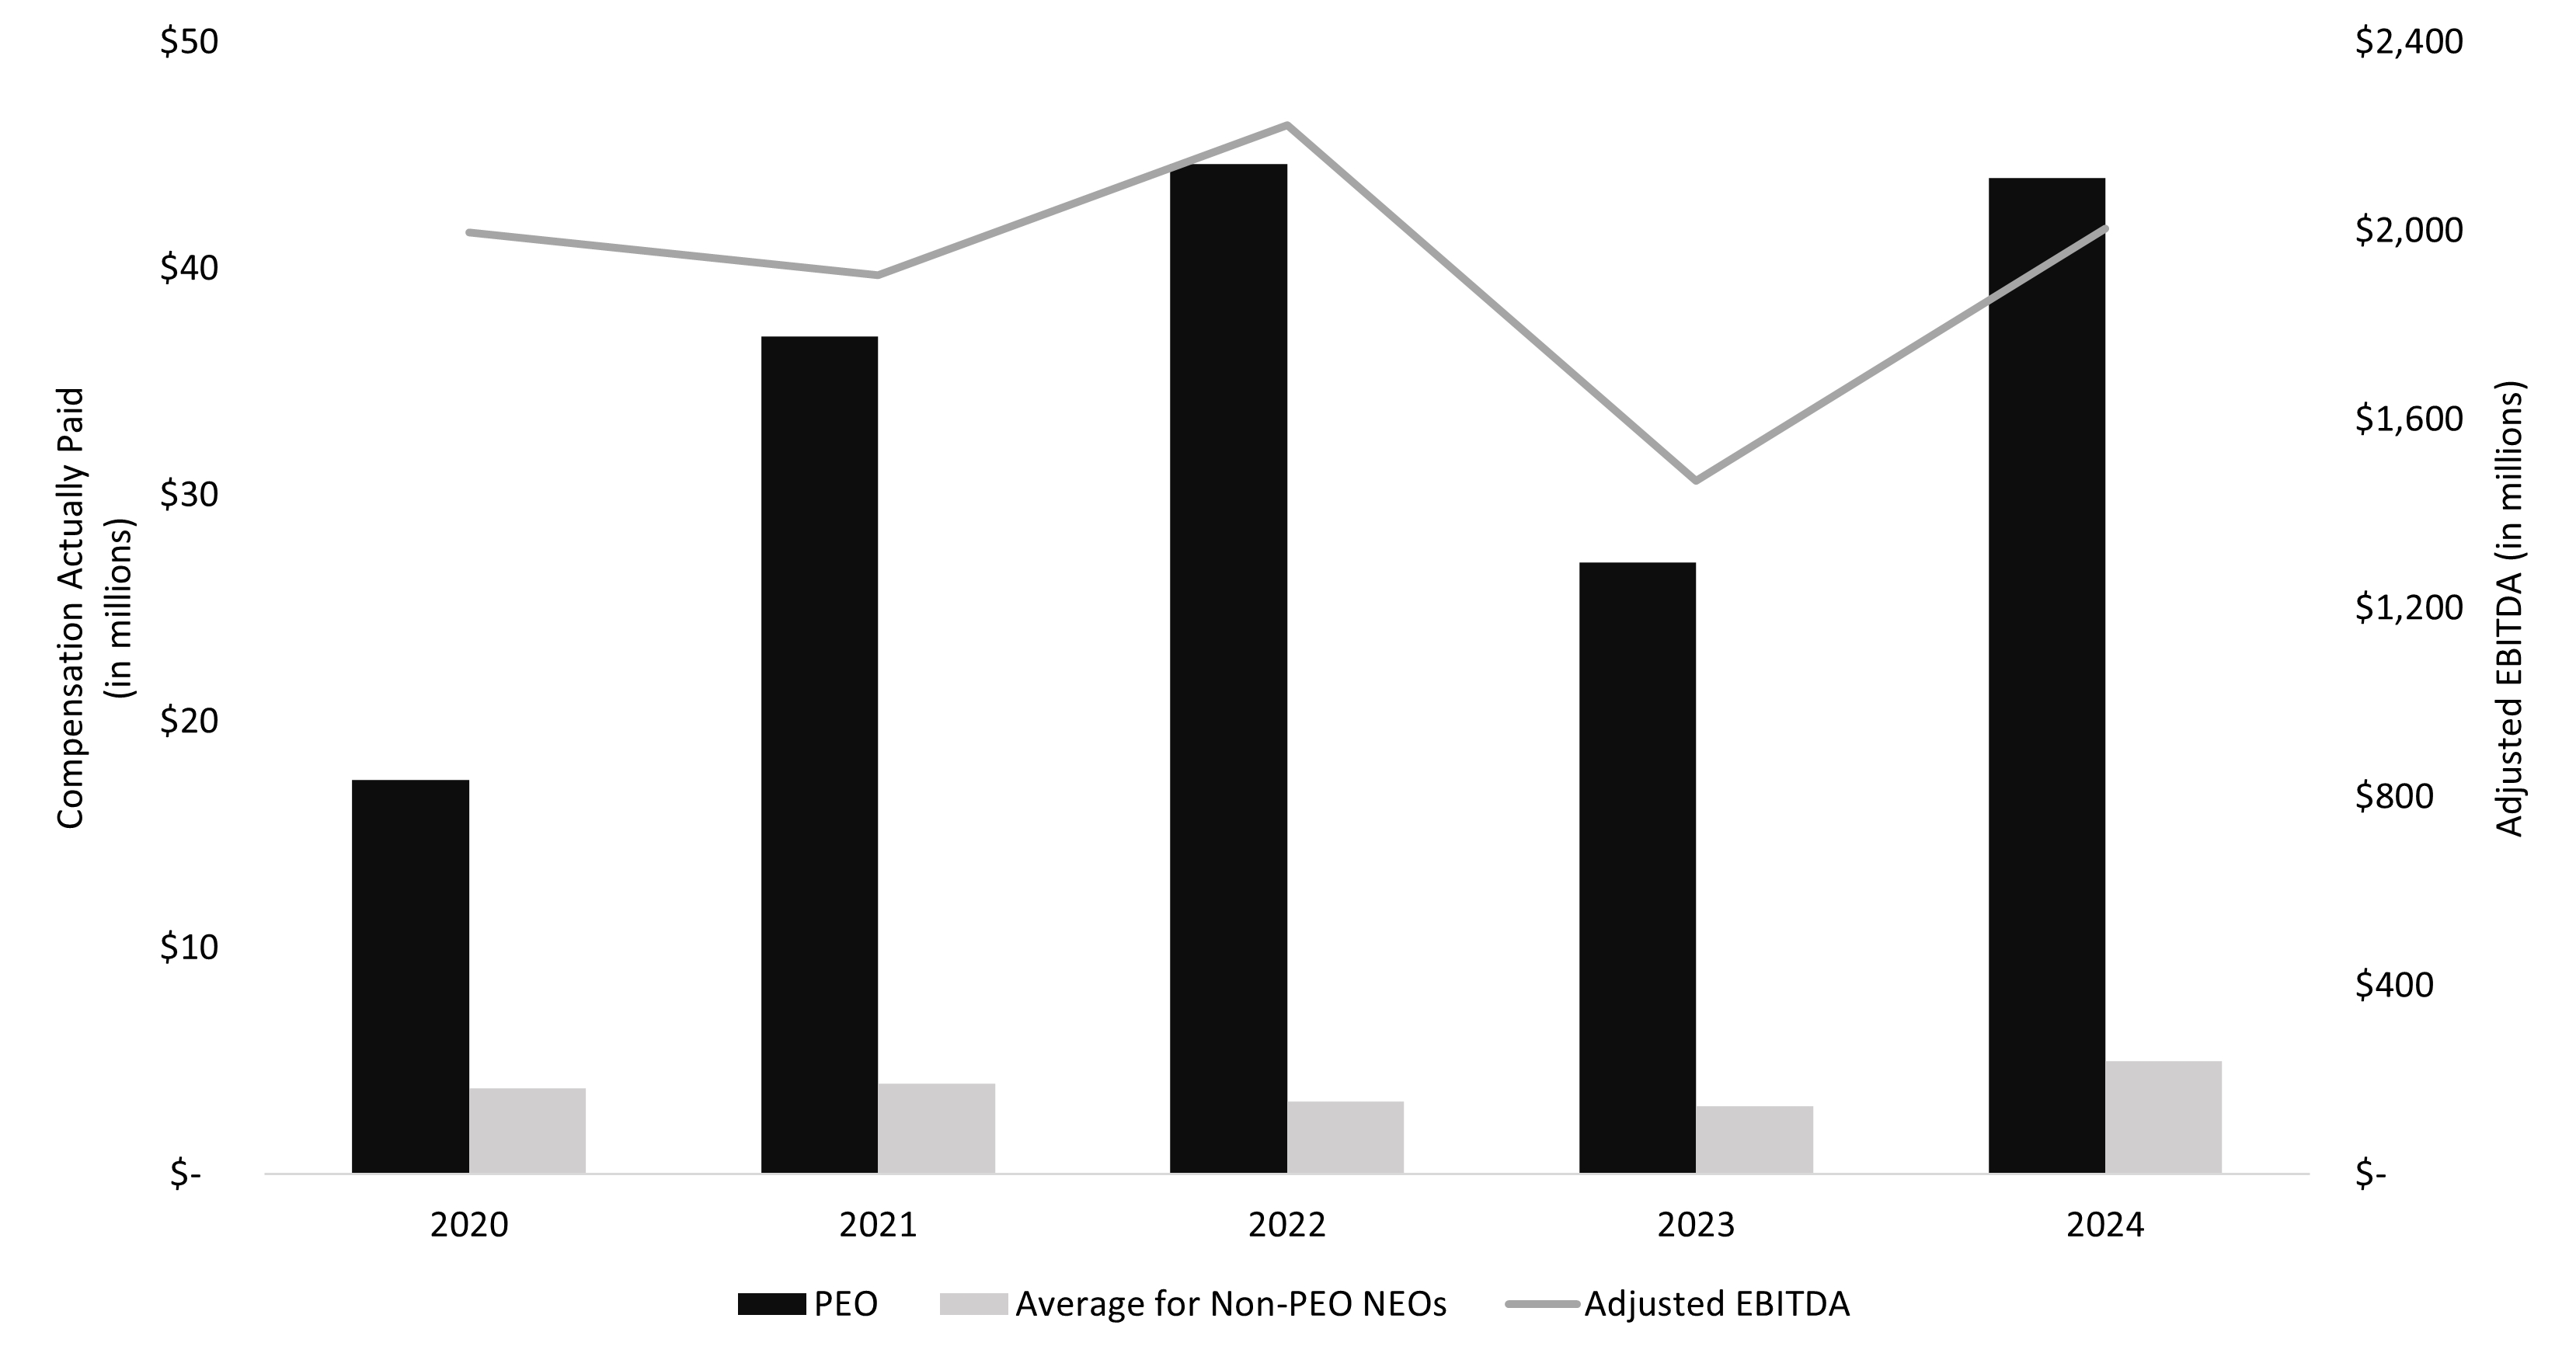
Compensation Actually Paid (in millions) $- $10 $20 $30 $40 $50 2020 2021 2022 2023 2024 PEO Average for Non-PEO NEOs Adjusted EBITDA $- $400 $800 $1200 $1600 $2000 $2400 Adjusted EBITDA (in millions)

       
Total Shareholder Return Vs Peer Group img152504772_24.jpg        
Total Shareholder Return Amount $ 155 147 159 135 95
Peer Group Total Shareholder Return Amount 73 60 66 89 88
Net Income (Loss) $ 683,000,000 $ 270,000,000 $ 944,000,000 $ 830,000,000 $ 808,000,000
Company Selected Measure Amount 2,004,000,000 1,469,000,000 2,223,000,000 1,905,000,000 1,996,000,000
PEO Name Perry A. Sook Perry A. Sook Perry A. Sook Perry A. Sook Perry A. Sook
Adj to Peo and Non-Peo Neo Comp Fn [Text Block] The following is a reconciliation of the “Total” column of SCT and the CAP for the year ended December 31, 2024. In calculating the CAP amounts reflected in these columns, the fair value or change in fair value, as applicable, of the equity award adjustments included in such calculations was computed in accordance with FASB ASC Topic 718. The valuation assumptions used to calculate such fair values did not materially differ from those disclosed at the time of grant.


2024


PEO

Non-PEO NEOs


Summary Compensation Table

$35,873,916

$4,413,675

Less: Grant date fair value of equity awards made during the applicable year and unvested at applicable year end

(27,746,271)

(1,797,215)

Plus: Year-end fair value of equity awards made during the applicable year and unvested at applicable year end

26,798,441

1,809,334

Change in fair value of equity awards made in prior years and unvested at applicable year end

3,698,638

11,071

Change in fair value of equity awards made in prior years and vested during applicable year

5,636,677

131,950

Less: Fair value of equity awards made in prior years that are forfeited during applicable year


Compensation Actually Paid

$44,261,401

$4,568,815

       
Measure:: 1          
Pay vs Performance Disclosure          
Non-GAAP Measure Description

In our assessment, the most important financial performance measures used to link CAP (as calculated in accordance with the SEC rules) to our NEOs in 2024 to our performance were Adjusted EBITDA and Net Revenue.

As described herein, the Company considers a number of other operating metrics in determining performance but Adjusted EBITDA and Net Revenue are the most important performance measures used by us to link CAP to the NEOs to company performance for 2024.

       
PEO | Year-end Fair Value of Equity Awards Granted in Covered Year that are Outstanding and Unvested          
Pay vs Performance Disclosure          
Adjustment to Compensation, Amount $ 26,798,441        
PEO | Year-over-Year Change in Fair Value of Equity Awards Granted in Prior Years That are Outstanding and Unvested          
Pay vs Performance Disclosure          
Adjustment to Compensation, Amount 3,698,638        
PEO | Change in Fair Value as of Vesting Date of Prior Year Equity Awards Vested in Covered Year          
Pay vs Performance Disclosure          
Adjustment to Compensation, Amount 5,636,677        
PEO | Less: Grant Date Fair Value of Equity Awards Made During the Applicable Year and Unvested at Applicable Year End [Member]          
Pay vs Performance Disclosure          
Adjustment to Compensation, Amount (27,746,271)        
Non-PEO NEO | Year-end Fair Value of Equity Awards Granted in Covered Year that are Outstanding and Unvested          
Pay vs Performance Disclosure          
Adjustment to Compensation, Amount 1,809,334        
Non-PEO NEO | Year-over-Year Change in Fair Value of Equity Awards Granted in Prior Years That are Outstanding and Unvested          
Pay vs Performance Disclosure          
Adjustment to Compensation, Amount 11,071        
Non-PEO NEO | Change in Fair Value as of Vesting Date of Prior Year Equity Awards Vested in Covered Year          
Pay vs Performance Disclosure          
Adjustment to Compensation, Amount 131,950        
Non-PEO NEO | Less: Grant Date Fair Value of Equity Awards Made During the Applicable Year and Unvested at Applicable Year End [Member]          
Pay vs Performance Disclosure          
Adjustment to Compensation, Amount $ (1,797,215)