Pay vs Performance Disclosure - USD ($)
Dec. 31, 2024
Dec. 31, 2023
Dec. 31, 2022
PAY VERSUS PERFORMANCE
As required by Section 953(a) of the Dodd-Frank Wall Street
Reform
and Consumer
Protection Act and Item 402(v) of Regulation S-K,
we are providing the following information about the relationship between the SEC-defined
“compensation actually paid” to our named executive officers (“NEOs”) and certain of our financial performance metrics during the fiscal years listed below. For the most recently completed fiscal year, we did not use any “financial performance measures” as defined Item 402(v) of Regulation S-K
to link compensation paid to our NEOs. Accordingly, we have omitted the tabular list of financial performance measures and the table below does not include a column for a “Company-Selected Measure” as defined in Item 402(v) of Regulation S-K.
For further information regarding our compensation philosophy and how we seek to align executive compensation with our performance, refer to “Executive Compensation.” The disclosure included in this section is prescribed by SEC rules and does not necessarily reflect value actually received or realized by the NEOs or how our Compensation Committee evaluates compensation decisions in light of Company or individual performance. Year |
Summary Compensation Table Total for PEO – Ted White ($) (1) |
Compensation actually paid to PEO – Ted White ($) (2) |
Summary Compensation Table Total for PEO – Jayson Rieger ($) (3) |
Compensation actually paid to PEO – Jayson Rieger ($) (4) |
Average Summary Compensation Table Total for NON-PEO NEOs ($) (5) |
Average Compensation actually paid to Non-PEO NEOs ($) (6) |
Value of initial fixed $100 investment based on total shareholder return (TSR) ($) (7) |
Net Loss (in millions) ($) (8) |
||||||||||||||||||||||||
2024 |
2,594,382 | (467,917 | ) | 1,236,225 | 1,061,427 | 1,192,879 | (1,732 | ) | 7.64 | (76.6 | ) | |||||||||||||||||||||
2023 |
3,504,847 | 4,638,908 | — | — | 2,329,573 | 2,806,409 | 79.91 | (67.0 | ) | |||||||||||||||||||||||
2022 |
1,935,833 | (798,654 | ) | — | — | 987,849 | (153,491 | ) | 30.02 | (24.5 | ) | |||||||||||||||||||||
| (1) | The dollar amounts reported are the amounts of total compensation reported for Ted White (our former Chief Executive Officer (“PEO1”)) for each corresponding year in the “Total” column of the Summary Compensation Table. Refer to “Executive Compensation–Summary Compensation Table.” |
| (2) | The dollar amounts reported represent the amount of “compensation actually paid” to Mr. White as computed in accordance with Item 402(v) of Regulation S-K. In accordance with the requirements of Item 402(v) of Regulation S-K, the following adjustments were made to Mr. White’s total compensation for each year to determine the compensation actually paid: |
Year |
Total Compensation from Summary Compensation Table total ($) |
Adjustment for Grant Date Values in the Summary Compensation Table ($) |
Year-End Fair Value of Unvested Awards Granted in the Current Year ($) |
Year-over- Year Difference of Year- End Fair Values for Unvested Awards Granted in Prior Years ($) |
Fair Values at Vest Date for Awards Granted and Vested in Current Year ($) |
Difference in Fair Values between Prior Year-End Fair Values and Vest-Date fair Values for Awards Granted in Prior Years ($) |
Prior year-end fair values for awards granted in prior years that failed to meet vesting conditions ($) |
Total Adjustments for Equity Awards ($) |
Compensation Actually Paid ($) |
|||||||||||||||||||||||||||
2024 |
2,594,382 | (1,395,918 | ) | — | — | — | (639,051 | ) | (1,027,330 | ) | (3,062,299 | ) | (467,917 | ) | ||||||||||||||||||||||
2023 |
3,504,847 | (2,589,968 | ) | 1,736,665 | 884,677 | 327,000 | 775,687 | — | 1,134,061 | 4,638,908 | ||||||||||||||||||||||||||
2022 |
1,935,833 | (1,163,066 | ) | 275,571 | (1,525,788 | ) | — | (321,204 | ) | — | (2,734,487 | ) | (798,654 | ) | ||||||||||||||||||||||
| (3) | The dollar amounts reported are the amounts of total compensation reported for Jayson Rieger (our current Chief Executive Officer (“PEO2”)) for each corresponding year in the “Total” column of the Summary Compensation Table. Refer to “Executive Compensation–Summary Compensation Table.” |
| (4) | The dollar amounts reported represent the amount of “compensation actually paid” to Dr. Rieger as computed in accordance with Item 402(v) of Regulation S-K. In accordance with the requirements of Item 402(v) of Regulation S-K, the following adjustments were made to Dr. Rieger’s total compensation for each year to determine the compensation actually paid: |
Year |
Total Compensation from Summary Compensation Table total ($) |
Adjustment for Grant Date Values in the Summary Compensation Table ($) |
Year-End Fair Value of Unvested Awards Granted in the Current Year ($) |
Year-over- Year Difference of Year-End Fair Values for Unvested Awards Granted in Prior Years ($) |
Fair Values at Vest Date for Awards Granted and Vested in Current Year ($) |
Difference in Fair Values between Prior Year-End Fair Values and Vest-Date fairValues for Awards Granted in Prior Years ($) |
Prior year-end fair values for awards granted in prior years that failed to meet vesting conditions ($) |
Total Adjustments for Equity Awards ($) |
Compensation Actually Paid ($) |
|||||||||||||||||||||||||||
2024 |
1,236,225 | (1,187,744 | ) | 1,012,946 | — | — | — | — | (174,798 | ) | 1,061,427 | |||||||||||||||||||||||||
2023 |
— | — | — | — | — | — | — | — | — | |||||||||||||||||||||||||||
2022 |
— | — | — | — | — | — | — | — | — | |||||||||||||||||||||||||||
| (5) | The dollar amounts reported represent the average of the amounts reported for the NEOs as a group (excluding the PEO) in the “Total” column of the Summary Compensation Table in each applicable year. The NEOs (excluding the PEO) included for purposes of calculating the average amounts are, Christopher Hayes, Joe Bonaccorso and Gary Goldenberg for 2024, Christopher Hayes and Joe Bonaccorso for 2023 and Gary Goldenberg and Joe Bonaccorso for 2022. |
| (6) | The dollar amounts reported in this column represent the average amount of “compensation actually paid” to the NEOs as a group (excluding the PEO), as computed in accordance with Item 402(v) of Regulation S-K. In accordance with the requirements of Item 402(v) of Regulation S-K, the following adjustments were made to average total compensation for the NEOs as a group (excluding the PEO) for each year to determine the compensation actually paid. |
Year |
Total Compensation from Summary Compensation Table total ($) |
Adjustment for Grant Date Values in the Summary Compensation Table ($) |
Year-End Fair Value of Unvested Awards Granted in the Current Year ($) |
Year-over- Year Difference of Year-End Fair Values for Unvested Awards Granted in Prior Years ($) |
Fair Values at Vest Date for Awards Granted and Vested in Current Year ($) |
Difference in Fair Values between Prior Year-End Fair Values and Vest-Date fair Values for Awards Granted in Prior Years ($) |
Prior year-end fair values for awards granted in prior years that failed to meet vesting conditions ($) |
Total Adjustments for Equity Awards ($) |
Compensation Actually Paid ($) |
|||||||||||||||||||||||||||
2024 |
1,192,879 | (559,772 | ) | 46,357 | (165,517 | ) | — | (371,986 | ) | (143,693 | ) | (1,194,611 | ) | (1,732 | ) | |||||||||||||||||||||
2023 |
2,329,573 | (1,708,194 | ) | 1,047,596 | 437,433 | 299,750 | 400,251 | — | 476,836 | 2,806,409 | ||||||||||||||||||||||||||
2022 |
987,849 | (436,149 | ) | 51,669 | (680,104 | ) | — | (76,756 | ) | — | (1,141,340 | ) | (153,491 | ) | ||||||||||||||||||||||
| (7) | Cumulative TSR is calculated by dividing the sum of the cumulative amount of dividends for the measurement period, assuming dividend reinvestment, and the difference between our stock price at the end and the beginning of the measurement period by our stock price at the beginning of the measurement period. |
| (8) | The dollar amounts reported represent the amount of net loss reflected in our audited financial statements for the applicable year. |
| (2) | The dollar amounts reported represent the amount of “compensation actually paid” to Mr. White as computed in accordance with Item 402(v) of Regulation S-K. In accordance with the requirements of Item 402(v) of Regulation S-K, the following adjustments were made to Mr. White’s total compensation for each year to determine the compensation actually paid: |
Year |
Total Compensation from Summary Compensation Table total ($) |
Adjustment for Grant Date Values in the Summary Compensation Table ($) |
Year-End Fair Value of Unvested Awards Granted in the Current Year ($) |
Year-over- Year Difference of Year- End Fair Values for Unvested Awards Granted in Prior Years ($) |
Fair Values at Vest Date for Awards Granted and Vested in Current Year ($) |
Difference in Fair Values between Prior Year-End Fair Values and Vest-Date fair Values for Awards Granted in Prior Years ($) |
Prior year-end fair values for awards granted in prior years that failed to meet vesting conditions ($) |
Total Adjustments for Equity Awards ($) |
Compensation Actually Paid ($) |
|||||||||||||||||||||||||||
2024 |
2,594,382 | (1,395,918 | ) | — | — | — | (639,051 | ) | (1,027,330 | ) | (3,062,299 | ) | (467,917 | ) | ||||||||||||||||||||||
2023 |
3,504,847 | (2,589,968 | ) | 1,736,665 | 884,677 | 327,000 | 775,687 | — | 1,134,061 | 4,638,908 | ||||||||||||||||||||||||||
2022 |
1,935,833 | (1,163,066 | ) | 275,571 | (1,525,788 | ) | — | (321,204 | ) | — | (2,734,487 | ) | (798,654 | ) | ||||||||||||||||||||||
| (3) | The dollar amounts reported are the amounts of total compensation reported for Jayson Rieger (our current Chief Executive Officer (“PEO2”)) for each corresponding year in the “Total” column of the Summary Compensation Table. Refer to “Executive Compensation–Summary Compensation Table.” |
| (4) | The dollar amounts reported represent the amount of “compensation actually paid” to Dr. Rieger as computed in accordance with Item 402(v) of Regulation S-K. In accordance with the requirements of Item 402(v) of Regulation S-K, the following adjustments were made to Dr. Rieger’s total compensation for each year to determine the compensation actually paid: |
Year |
Total Compensation from Summary Compensation Table total ($) |
Adjustment for Grant Date Values in the Summary Compensation Table ($) |
Year-End Fair Value of Unvested Awards Granted in the Current Year ($) |
Year-over- Year Difference of Year-End Fair Values for Unvested Awards Granted in Prior Years ($) |
Fair Values at Vest Date for Awards Granted and Vested in Current Year ($) |
Difference in Fair Values between Prior Year-End Fair Values and Vest-Date fairValues for Awards Granted in Prior Years ($) |
Prior year-end fair values for awards granted in prior years that failed to meet vesting conditions ($) |
Total Adjustments for Equity Awards ($) |
Compensation Actually Paid ($) |
|||||||||||||||||||||||||||
2024 |
1,236,225 | (1,187,744 | ) | 1,012,946 | — | — | — | — | (174,798 | ) | 1,061,427 | |||||||||||||||||||||||||
2023 |
— | — | — | — | — | — | — | — | — | |||||||||||||||||||||||||||
2022 |
— | — | — | — | — | — | — | — | — | |||||||||||||||||||||||||||
| (6) | The dollar amounts reported in this column represent the average amount of “compensation actually paid” to the NEOs as a group (excluding the PEO), as computed in accordance with Item 402(v) of Regulation S-K. In accordance with the requirements of Item 402(v) of Regulation S-K, the following adjustments were made to average total compensation for the NEOs as a group (excluding the PEO) for each year to determine the compensation actually paid. |
Year |
Total Compensation from Summary Compensation Table total ($) |
Adjustment for Grant Date Values in the Summary Compensation Table ($) |
Year-End Fair Value of Unvested Awards Granted in the Current Year ($) |
Year-over- Year Difference of Year-End Fair Values for Unvested Awards Granted in Prior Years ($) |
Fair Values at Vest Date for Awards Granted and Vested in Current Year ($) |
Difference in Fair Values between Prior Year-End Fair Values and Vest-Date fair Values for Awards Granted in Prior Years ($) |
Prior year-end fair values for awards granted in prior years that failed to meet vesting conditions ($) |
Total Adjustments for Equity Awards ($) |
Compensation Actually Paid ($) |
|||||||||||||||||||||||||||
2024 |
1,192,879 | (559,772 | ) | 46,357 | (165,517 | ) | — | (371,986 | ) | (143,693 | ) | (1,194,611 | ) | (1,732 | ) | |||||||||||||||||||||
2023 |
2,329,573 | (1,708,194 | ) | 1,047,596 | 437,433 | 299,750 | 400,251 | — | 476,836 | 2,806,409 | ||||||||||||||||||||||||||
2022 |
987,849 | (436,149 | ) | 51,669 | (680,104 | ) | — | (76,756 | ) | — | (1,141,340 | ) | (153,491 | ) | ||||||||||||||||||||||
Compensation Actually Paid and Cumulative TSR
The chart below shows the relationship between the compensation
actually
paid
to our PEOs and our non-PEO
NEOs, as calculated pursuant to SEC rules, to our cumulative TSR over the three years presented in the Pay Versus Performance table. 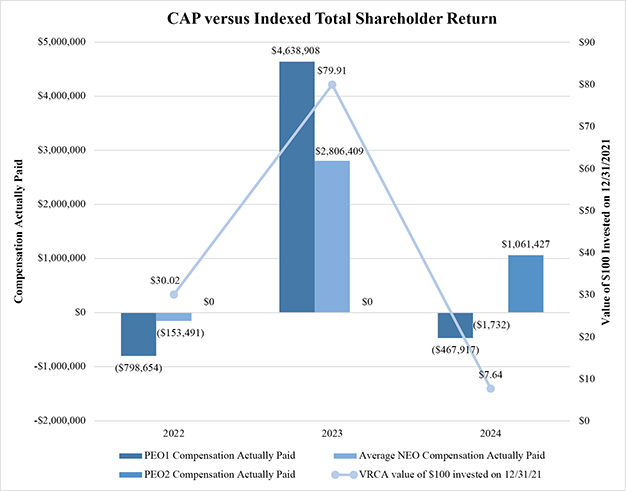
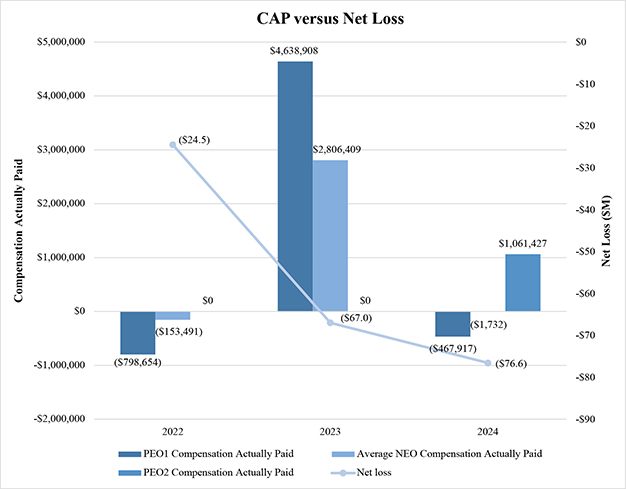
Compensation Actually Paid and Net Loss
YCANTH, our first approved product, was approved by the U.S. Food and Drug Administration in July 2023. Accordingly, we did not generate substantial revenue from YCANTH during the periods presented. Because the majority of the revenue we recognized during the periods presented was associated with upfront and milestone payments under our license agreements, we do not use net loss as a performance measure in our executive compensation program, and we do not believe there is any meaningful relationship between our net loss and compensation actually paid to our NEOs during the periods presented. The chart below illustrates the relationship of the compensation actually paid for our PEOs and
non-PEO
NEOs, as calculated pursuant to SEC rules, to our net loss over the three years presented in the Pay Versus Performance table.