The bar chart and table that follow provide an indication of the risks of investing in the Fund by showing changes in the Fund’s performance from year to year, and by showing how the Fund’s average annual returns for one year, five years, and ten years compared with those of a broad based securities market index. As with all mutual funds, the Fund’s past performance does not predict how the Fund will perform in the future. Updated information on the Fund’s results can be obtained by visiting www.gabelli.com.
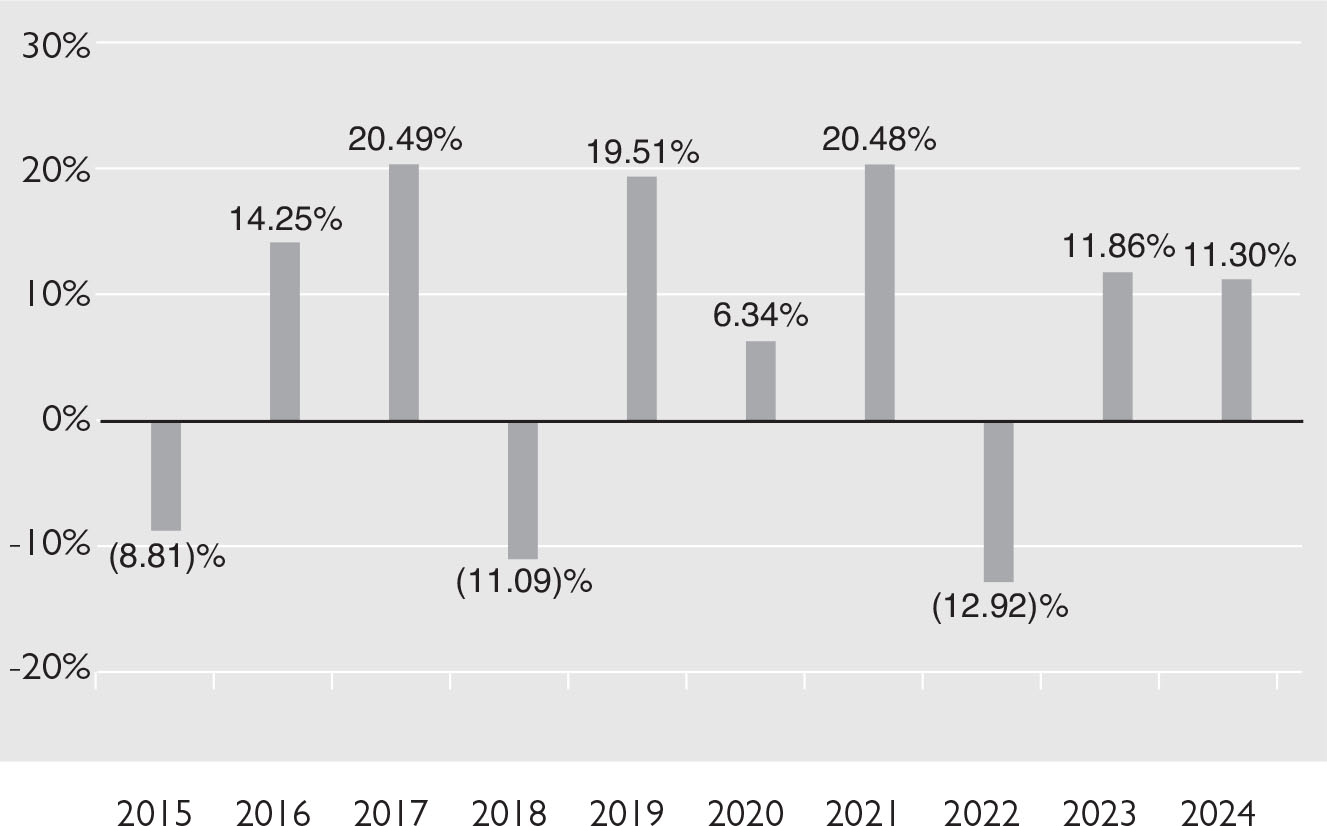
Performance information does not reflect separate account or variable insurance contract fees and charges. If such fees and charges were reflected, the Fund’s returns would be lower than those shown. During the periods shown in the bar chart, the highest return for a quarter was 23.47% (quarter ended December 31, 2020), and the lowest return for a quarter was (29.75)% (quarter ended March 31, 2020).
| Average Annual Total Returns (for the years ended December 31, 2024) |
Past One Year |
Past Five Years |
Past Ten Years |
|||||||||||||||
| Gabelli Capital Asset Fund | 11.30 | % | 6.79 | % | 6.36 | % | ||||||||||||
|
S&P
500 Index |
25.02 | % | 14.53 | % | 13.10 | % | ||||||||||||