The bar chart and table below provide some indication of the risks of investing in the Fund by showing changes in the Fund’s performance year to year and by showing the Fund’s average annual returns for the periods indicated as compared with those of a broad measure of market performance. The Fund’s past performance (before and after taxes) is not necessarily an indication of how the Fund will perform in the future.
Updated performance information for the Fund, including its current net asset value per share, is available by calling toll-free 833-356-0909.
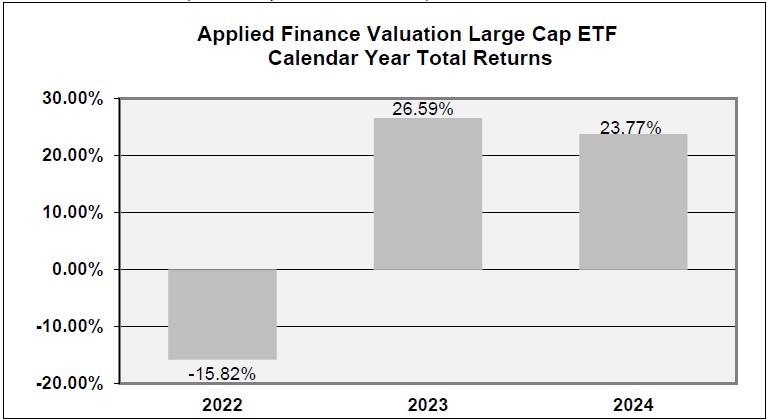
During the period shown, the highest quarterly return was 11.72% (quarter ended 12/31/23) and the lowest quarterly return was -14.26% (quarter ended 6 /30/22).
The table below shows how the Fund’s average annual total returns compare to those of the Fund’s benchmark. The table also presents the impact of taxes on the Fund’s performance. After-tax returns are calculated using the historical highest marginal individual U.S. federal income tax rates and do not reflect the impact of state and local taxes. Actual after-tax returns depend on an investor’s tax situation and may differ from those shown. After-tax returns shown are not relevant to investors who hold their Fund shares through tax-deferred arrangements, such as 401(k) plans or individual retirement accounts.
| One Year | Since Inception(1) | |
| Return Before Taxes | 23.77% | 11.73% |
|
Return After-Taxes on Distributions
|
23.60% | 7.33% |
|
Return After-Taxes on Distributions and Sale of Fund Shares
|
14.20% | 9.20% |
|
Morningstar® US Market Total Return Index (TR) (reflects no deduction for fees, expenses or taxes)(2)
|
24.09% | 9.88% |
| Morningstar® US Large-Mid Cap Index (TR) (reflects no deduction for fees, expenses or taxes) | 25.07% | 10.45% |
| (1) | The Fund commenced operations on April 29, 2021. |
| (2) | In connection with newly adopted SEC regulations applicable to the Fund, the Morningstar® US Market Total Return Index (TR) is the Fund’s new broad-based securities market index. The Fund will continue to show performance for the Morningstar® US Large-Mid Cap Index (TR), the Fund’s previous broad-based securities market index. The Morningstar® US Market Total Return Index (TR) is a rule-based, float-weighted index that tracks the performance of the U.S. stock market, targeting 97% of the investable universe. It includes a broad spectrum of large-, mid-, and small-cap stocks, providing a comprehensive measure of the U.S. equity market. The index is reconstituted semiannually and rebalanced quarterly to ensure it accurately reflects the market’s composition. |