Pay vs Performance Disclosure - USD ($)
Dec. 31, 2024
Dec. 31, 2023
Dec. 31, 2022
Pay Versus Performance
As required by Section 953(a) of the Dodd-Frank Wall Street Reform and Consumer Protection Act, and Item 402(v) of Regulation S-K, we are providing the following information about the relationship between executive compensation actually paid and certain financial performance of the Company. For further information concerning the Company’s variable pay-for-performance philosophy and how the Company’s aligns executive compensation with the Company’s performance, refer to “Executive Compensation – Compensation Discussion and Analysis.”
Year | Summary Compensation Table Total for PEO1 | Compensation Actually Paid to PEO2 | Average Summary Compensation Table Total for Non-PEO named executive officers3 | Average Compensation Actually Paid to Non-PEO named executive officers4 | Value of Initial Fixed $100 Investment Based On: | Net Income (thousands)6 | ||||||||||||
Total Shareholder Return5 | ||||||||||||||||||
(a) | (b) | (c) | (d) | (e) | (f) | (h) | ||||||||||||
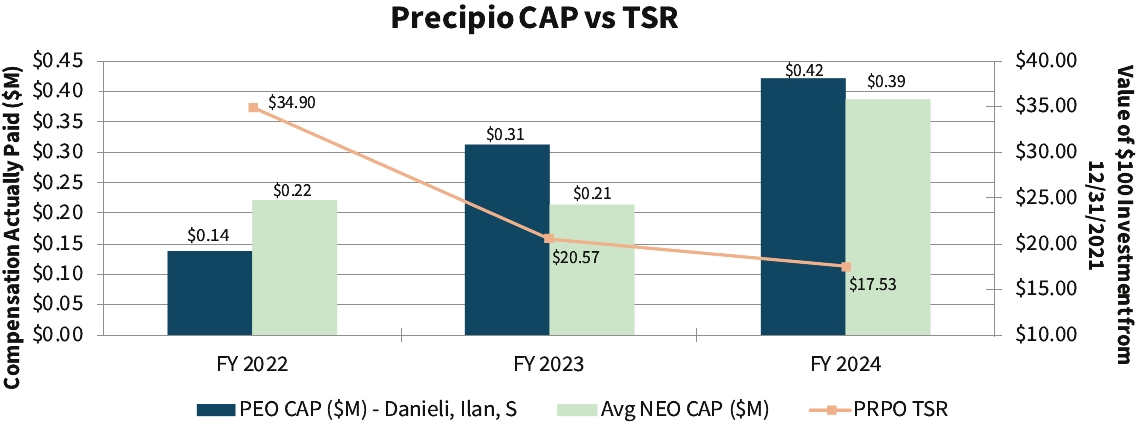
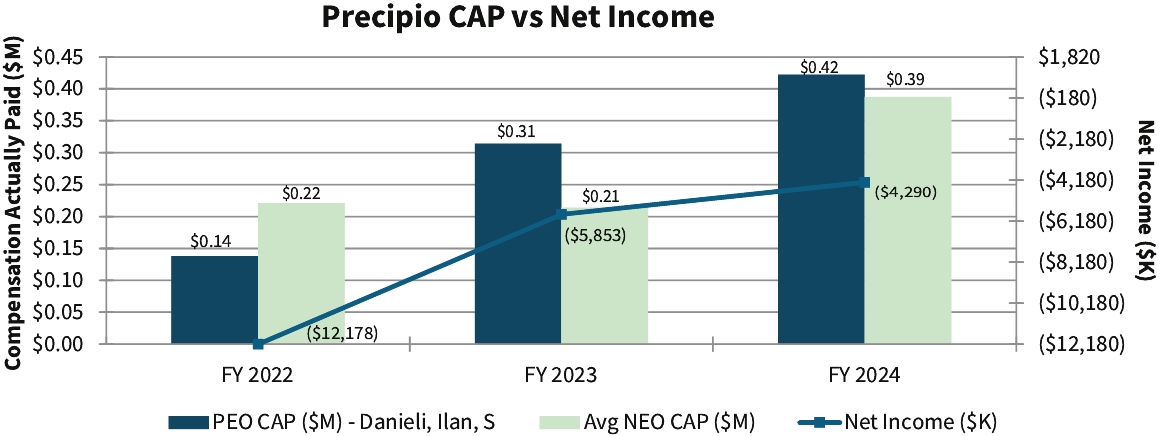
2024 | $462,102 | $422,285 | $401,229 | $387,727 | $17.53 | ($4,290) | ||||||||||||
2023 | $473,440 | $314,071 | $274,916 | $213,857 | $15.70 | ($5,853) | ||||||||||||
2022 | $805,103 | $137,939 | $412,340 | $221,026 | $26.64 | ($12,178) | ||||||||||||
(1) | The dollar amounts reported in column (b) are the amounts of total compensation reported for Mr. Danieli (our Chief Executive Officer) for each corresponding year in the “Total” column of the Summary Compensation Table. Refer to “Executive Compensation – Executive Compensation Tables – Summary Compensation Table.” |
(2) | The dollar amounts reported in column (c) represent the amount of “compensation actually paid” to Mr. Danieli, as computed in accordance with Item 402(v) of Regulation S-K. The dollar amounts do not reflect the actual amount of compensation earned by or paid to Mr. Danieli during the applicable year. In accordance with the requirements of Item 402(v) of Regulation S-K, the following adjustments were made to Mr. Danieli’s total compensation for each year to determine the compensation actually paid: |
Year | Reported Summary Compensation Table Total for PEO | Reported Value of Equity Awards(a) | Equity Award Adjustments(b) | Compensation Actually Paid to PEO | ||||||||
2024 | $462,102 | ($36,240) | ($3,577) | $422,285 | ||||||||
(a) | The grant date fair value of equity awards represents the total of the amounts reported in the “Stock Awards” and “Option Awards” columns in the Summary Compensation Table for the applicable year. |
(b) | The equity award adjustments for each applicable year include the addition (or subtraction, as applicable) of the following: (i) the year-end fair value of any equity awards granted in the applicable year that are outstanding and unvested as of the end of the year; (ii) the amount of change as of the end of the applicable year (from the end of the prior fiscal year) in fair value of any awards granted in prior years that are outstanding and unvested as of the end of the applicable year; (iii) for awards that are granted and vest in same applicable year, the fair value as of the vesting date; (iv) for awards granted in prior years that vest in the applicable year, the amount equal to the change as of the vesting date (from the end of the prior fiscal year) in fair value; (v) for awards granted in prior years that are determined to fail to meet the applicable vesting conditions during the applicable year, a deduction for the amount equal to the fair value at the end of the prior fiscal year; and (vi) the dollar value of any dividends or other earnings paid on stock or option awards in the applicable year prior to the vesting date that are not otherwise reflected in the fair value of such award or included in any other component of total compensation for the applicable year. The valuation assumptions used to calculate fair values did not materially differ from those disclosed at the time of grant. The amounts deducted or added in calculating the equity award adjustments are as follows: |
Year | Year End Fair Value of Equity Awards | Year over Year Change in Fair Value of Outstanding and Unvested Equity Awards | Fair Value as of Vesting Date of Equity Awards Granted and Vested in the Year | Year over Year Change in Fair Value of Equity Awards Granted in Prior Years that Vested in the Year | Fair Value at the End of the Prior Year of Equity Awards that Failed to Meet Vesting Conditions in the Year | Value of Dividends or other Earnings Paid on Stock or Option Awards not Otherwise Reflected in Fair Value or Total Compensation | Total Equity Award Adjustments | ||||||||||||||
2024 | $39,361 | ($30,653) | $0 | $(12,286) | $0 | $0 | ($3,577) | ||||||||||||||
(3) | The dollar amounts reported in column (d) represent the average of the amounts reported for the Company’s named executive officers as a group (excluding Mr. Danieli) in the “Total” column of the Summary Compensation Table in each applicable year. The names of each of the named executive officers (excluding Mr. Danieli) included for purposes of calculating the average amounts in each applicable year are as follows: |
Year | PEO | Non-PEO Named Executive Officers | ||||
2024 | Ilan S. Danieli | Ahmed Zaki Sabet, Ayman Mohamed | ||||
2023 | Ilan S. Danieli | Ahmed Zaki Sabet, Ayman A. Mohamed | ||||
2022 | Ilan S. Danieli | Carl R. Iberger, Ayman A. Mohamed | ||||
(4) | The dollar amounts reported in column (e) represent the average amount of “compensation actually paid” to the named executive officers as a group (excluding Mr. Danieli), as computed in accordance with Item 402(v) of Regulation S-K. The dollar amounts do not reflect the actual average amount of compensation earned by or paid to the named executive officers as a group (excluding Mr. Danieli) during the applicable year. In accordance with the requirements of Item 402(v) of Regulation S-K, the following adjustments were made to average total compensation for the named executive officers as a group (excluding Mr. Danieli) for each year to determine the compensation actually paid, using the same methodology described above in Note 2: |
Year | Average Reported Summary Compensation Table Total for Non-PEO Named Executive Officers | Average Reported Value of Equity Awards | Average Equity Award Adjustments(a) | Average Compensation Actually Paid to Non-PEO Named Executive Officers | ||||||||
2024 | $$401,229 | ($27,180) | $13,678 | $387,727 | ||||||||
(a) | The amounts deducted or added in calculating the total average equity award adjustments are as follows: |
Year | Average Year End Fair Value of Equity Awards | Year over Year Average Change in Fair Value of Outstanding and Unvested Equity Awards | Average Fair Value as of Vesting Date of Equity Awards Granted and Vested in the Year | Year over Year Average Change in Fair Value of Equity Awards Granted in Prior Years that Vested in the Year | Average Fair Value at the End of the Prior Year of Equity Awards that Failed to Meet Vesting Conditions in the Year | Average Value of Dividends or other Earnings Paid on Stock or Option Awards not Otherwise Reflected in Fair Value or Total Compensation | Total Average Equity Award Adjustments | ||||||||||||||
2024 | $29,521 | ($9,881) | $0 | $(5,962) | $0 | $0 | $13,678 | ||||||||||||||
(5) | Cumulative total shareholder return (“TSR”) is calculated by dividing the sum of the cumulative amount of dividends for the measurement period, assuming dividend reinvestment, and the difference between the Company’s share price at the end and the beginning of the measurement period by the Company’s share price at the beginning of the measurement period. |
(6) | The dollar amounts reported represent the amount of net income reflected in the Company’s audited financial statements for the applicable year. |
(1) | The dollar amounts reported in column (b) are the amounts of total compensation reported for Mr. Danieli (our Chief Executive Officer) for each corresponding year in the “Total” column of the Summary Compensation Table. Refer to “Executive Compensation – Executive Compensation Tables – Summary Compensation Table.” |
(3) | The dollar amounts reported in column (d) represent the average of the amounts reported for the Company’s named executive officers as a group (excluding Mr. Danieli) in the “Total” column of the Summary Compensation Table in each applicable year. The names of each of the named executive officers (excluding Mr. Danieli) included for purposes of calculating the average amounts in each applicable year are as follows: |
Year | PEO | Non-PEO Named Executive Officers | ||||
2024 | Ilan S. Danieli | Ahmed Zaki Sabet, Ayman Mohamed | ||||
2023 | Ilan S. Danieli | Ahmed Zaki Sabet, Ayman A. Mohamed | ||||
2022 | Ilan S. Danieli | Carl R. Iberger, Ayman A. Mohamed | ||||
(2) | The dollar amounts reported in column (c) represent the amount of “compensation actually paid” to Mr. Danieli, as computed in accordance with Item 402(v) of Regulation S-K. The dollar amounts do not reflect the actual amount of compensation earned by or paid to Mr. Danieli during the applicable year. In accordance with the requirements of Item 402(v) of Regulation S-K, the following adjustments were made to Mr. Danieli’s total compensation for each year to determine the compensation actually paid: |
Year | Reported Summary Compensation Table Total for PEO | Reported Value of Equity Awards(a) | Equity Award Adjustments(b) | Compensation Actually Paid to PEO | ||||||||
2024 | $462,102 | ($36,240) | ($3,577) | $422,285 | ||||||||
(a) | The grant date fair value of equity awards represents the total of the amounts reported in the “Stock Awards” and “Option Awards” columns in the Summary Compensation Table for the applicable year. |
(b) | The equity award adjustments for each applicable year include the addition (or subtraction, as applicable) of the following: (i) the year-end fair value of any equity awards granted in the applicable year that are outstanding and unvested as of the end of the year; (ii) the amount of change as of the end of the applicable year (from the end of the prior fiscal year) in fair value of any awards granted in prior years that are outstanding and unvested as of the end of the applicable year; (iii) for awards that are granted and vest in same applicable year, the fair value as of the vesting date; (iv) for awards granted in prior years that vest in the applicable year, the amount equal to the change as of the vesting date (from the end of the prior fiscal year) in fair value; (v) for awards granted in prior years that are determined to fail to meet the applicable vesting conditions during the applicable year, a deduction for the amount equal to the fair value at the end of the prior fiscal year; and (vi) the dollar value of any dividends or other earnings paid on stock or option awards in the applicable year prior to the vesting date that are not otherwise reflected in the fair value of such award or included in any other component of total compensation for the applicable year. The valuation assumptions used to calculate fair values did not materially differ from those disclosed at the time of grant. The amounts deducted or added in calculating the equity award adjustments are as follows: |
Year | Year End Fair Value of Equity Awards | Year over Year Change in Fair Value of Outstanding and Unvested Equity Awards | Fair Value as of Vesting Date of Equity Awards Granted and Vested in the Year | Year over Year Change in Fair Value of Equity Awards Granted in Prior Years that Vested in the Year | Fair Value at the End of the Prior Year of Equity Awards that Failed to Meet Vesting Conditions in the Year | Value of Dividends or other Earnings Paid on Stock or Option Awards not Otherwise Reflected in Fair Value or Total Compensation | Total Equity Award Adjustments | ||||||||||||||
2024 | $39,361 | ($30,653) | $0 | $(12,286) | $0 | $0 | ($3,577) | ||||||||||||||
(4) | The dollar amounts reported in column (e) represent the average amount of “compensation actually paid” to the named executive officers as a group (excluding Mr. Danieli), as computed in accordance with Item 402(v) of Regulation S-K. The dollar amounts do not reflect the actual average amount of compensation earned by or paid to the named executive officers as a group (excluding Mr. Danieli) during the applicable year. In accordance with the requirements of Item 402(v) of Regulation S-K, the following adjustments were made to average total compensation for the named executive officers as a group (excluding Mr. Danieli) for each year to determine the compensation actually paid, using the same methodology described above in Note 2: |
Year | Average Reported Summary Compensation Table Total for Non-PEO Named Executive Officers | Average Reported Value of Equity Awards | Average Equity Award Adjustments(a) | Average Compensation Actually Paid to Non-PEO Named Executive Officers | ||||||||
2024 | $$401,229 | ($27,180) | $13,678 | $387,727 | ||||||||
(a) | The amounts deducted or added in calculating the total average equity award adjustments are as follows: |
Year | Average Year End Fair Value of Equity Awards | Year over Year Average Change in Fair Value of Outstanding and Unvested Equity Awards | Average Fair Value as of Vesting Date of Equity Awards Granted and Vested in the Year | Year over Year Average Change in Fair Value of Equity Awards Granted in Prior Years that Vested in the Year | Average Fair Value at the End of the Prior Year of Equity Awards that Failed to Meet Vesting Conditions in the Year | Average Value of Dividends or other Earnings Paid on Stock or Option Awards not Otherwise Reflected in Fair Value or Total Compensation | Total Average Equity Award Adjustments | ||||||||||||||
2024 | $29,521 | ($9,881) | $0 | $(5,962) | $0 | $0 | $13,678 | ||||||||||||||
TSR amounts reported in the graph assume an initial fixed investment of $100, and that all dividends, if any, were reinvested.
(b) | The equity award adjustments for each applicable year include the addition (or subtraction, as applicable) of the following: (i) the year-end fair value of any equity awards granted in the applicable year that are outstanding and unvested as of the end of the year; (ii) the amount of change as of the end of the applicable year (from the end of the prior fiscal year) in fair value of any awards granted in prior years that are outstanding and unvested as of the end of the applicable year; (iii) for awards that are granted and vest in same applicable year, the fair value as of the vesting date; (iv) for awards granted in prior years that vest in the applicable year, the amount equal to the change as of the vesting date (from the end of the prior fiscal year) in fair value; (v) for awards granted in prior years that are determined to fail to meet the applicable vesting conditions during the applicable year, a deduction for the amount equal to the fair value at the end of the prior fiscal year; and (vi) the dollar value of any dividends or other earnings paid on stock or option awards in the applicable year prior to the vesting date that are not otherwise reflected in the fair value of such award or included in any other component of total compensation for the applicable year. The valuation assumptions used to calculate fair values did not materially differ from those disclosed at the time of grant. The amounts deducted or added in calculating the equity award adjustments are as follows: |
Year | Year End Fair Value of Equity Awards | Year over Year Change in Fair Value of Outstanding and Unvested Equity Awards | Fair Value as of Vesting Date of Equity Awards Granted and Vested in the Year | Year over Year Change in Fair Value of Equity Awards Granted in Prior Years that Vested in the Year | Fair Value at the End of the Prior Year of Equity Awards that Failed to Meet Vesting Conditions in the Year | Value of Dividends or other Earnings Paid on Stock or Option Awards not Otherwise Reflected in Fair Value or Total Compensation | Total Equity Award Adjustments | ||||||||||||||
2024 | $39,361 | ($30,653) | $0 | $(12,286) | $0 | $0 | ($3,577) | ||||||||||||||
(a) | The amounts deducted or added in calculating the total average equity award adjustments are as follows: |
Year | Average Year End Fair Value of Equity Awards | Year over Year Average Change in Fair Value of Outstanding and Unvested Equity Awards | Average Fair Value as of Vesting Date of Equity Awards Granted and Vested in the Year | Year over Year Average Change in Fair Value of Equity Awards Granted in Prior Years that Vested in the Year | Average Fair Value at the End of the Prior Year of Equity Awards that Failed to Meet Vesting Conditions in the Year | Average Value of Dividends or other Earnings Paid on Stock or Option Awards not Otherwise Reflected in Fair Value or Total Compensation | Total Average Equity Award Adjustments | ||||||||||||||
2024 | $29,521 | ($9,881) | $0 | $(5,962) | $0 | $0 | $13,678 | ||||||||||||||