The investment objective of the Cromwell Balanced Fund (the “Fund”) is to achieve total return, consisting of current income and long-term capital appreciation.
This table describes the fees and expenses that you may pay if you buy, hold and sell shares of the Fund. You may pay other fees, such as brokerage commissions and other fees to financial intermediaries, which are not reflected in the table and examples below.
Shareholder Fees - Cromwell Sustainable Balanced Fund |
Investor Class |
Institutional Class |
|---|---|---|
| Maximum Sales Charge (Load) Imposed on Purchases (as a percentage of offering price) | none | none |
| Maximum Deferred Sales Charge (Load) (as a percentage of shares redeemed within 12 months of purchase) | none | none |
Annual Fund Operating Expenses - Cromwell Sustainable Balanced Fund |
Investor Class |
Institutional Class |
|
|---|---|---|---|
| Management Fees | 0.85% | 0.85% | |
| Distribution and/or Service (12b-1) Fees | 0.25% | none | |
| Other Expenses | 1.89% | 1.89% | |
| Total Annual Fund Operating Expenses | 2.99% | 2.74% | |
| Less: Fee Waiver and/or Expense Reimbursement | (1.64%) | (1.64%) | |
| Total Annual Fund Operating Expenses After Fee Waiver and/or Expense Reimbursement | [1] | 1.35% | 1.10% |
| [1] | Pursuant to an operating expense limitation agreement, Cromwell Investment Advisors, LLC, the Fund’s investment adviser (the “Adviser”), has agreed to waive its management fees and/or reimburse Fund expenses to ensure that Total Annual Fund Operating Expenses (exclusive of contingent deferred sales loads, taxes, leverage, interest, brokerage commissions, expenses incurred in connection with any merger or reorganization, acquired fund fees and expenses, and extraordinary expenses) do not exceed 1.35% and 1.10% of the Fund’s average daily net assets for Investor Class shares and Institutional Class shares, respectively, through at least April 30, 2026. The operating expense limitation agreement can be terminated only by, or with the consent of, the Trust’s Board of Trustees (the “Board of Trustees”). The Adviser may request recoupment of previously waived fees and paid expenses from the Fund for up to 36 months from the date such fees and expenses were waived or paid, subject to the operating expense limitation agreement, if such reimbursement will not cause the Fund’s expense ratio, after recoupment has been taken into account, to exceed the lesser of: (1) the expense limitation in place at the time of the waiver and/or expense payment; or (2) the expense limitation in place at the time of the recoupment. |
This example is intended to help you compare the costs of investing in the Fund with the cost of investing in other mutual funds. The example assumes that you invest $10,000 in the Fund for the time periods indicated and that you then redeem or hold all of your shares at the end of those periods. The example also assumes that your investment has a 5% return each year and that the Fund’s operating expenses remain the same (taking into account the Expense Cap only in the first year). Although your actual costs may be higher or lower, based on these assumptions, your costs would be:
Expense Example - Cromwell Sustainable Balanced Fund - USD ($) |
One Year |
Three Years |
Five Years |
Ten Years |
|---|---|---|---|---|
| Investor Class | 137 | 770 | 1,428 | 3,192 |
| Institutional Class | 112 | 694 | 1,303 | 2,950 |
The Fund pays transaction costs, such as commissions, when it buys and sells securities (or “turns over” its portfolio). A higher portfolio turnover rate may indicate higher transaction costs and may result in higher taxes when Fund shares are held in a taxable account. These transaction costs and potentially higher taxes, which are not reflected in the Total Annual Fund Operating Expenses or in the example, affect the Fund’s performance. During the fiscal year ended December 31, 2024, the portfolio turnover rate of the Fund was 35% of the average value of its portfolio.
The Adviser has selected two sub-advisers (each, a “Sub-Adviser”) to manage the Fund. Tran Capital Management, L.P. (“Tran”) has been selected to manage the equity portion of the Fund. Aristotle Pacific Capital, LLC (“Aristotle Pacific”) has been selected to manage the debt portion of the Fund. Under normal market conditions, the Fund will invest between 50-70% of its assets in equity securities and 30-50% of its assets in debt securities. The equity securities in which the Fund normally invests are common stocks of approximately 25 to 35 mid- and large-cap U.S. companies with market capitalizations greater than $2 billion. The debt securities in which the Fund primarily invests are a broad range of investment grade debt securities, including corporate bonds, mortgage-related securities, asset-backed securities, debt securities issued by the U.S. government or its related agencies and U.S. dollar-denominated debt securities issued by developed foreign governments and corporations. Investment grade debt instruments are those rated in one of the four highest rating categories (i.e., Baa by Moody’s, BBB by S&P or Fitch or higher) or, if unrated, deemed comparable by Aristotle Pacific. The Fund’s investments in debt securities are expected to maintain a weighted average duration within two years (plus or minus) of the Bloomberg US Aggregate Bond Index, although the debt instruments held by the Fund may have short, intermediate, and long terms to maturity. The Adviser, together with Tran, reviews the Fund’s allocation on a monthly basis and rebalances the portfolio as necessary to ensure to maintain the ranges as indicated above.
Under normal market conditions, the Fund will invest at least 80% of its assets in sustainable equity and debt securities as described above. For this purpose, each sub-adviser employs its own investment processes for determining which securities meet their respective sustainability criteria. Tran defines sustainable equity securities as those that score 3 or higher on its internal 5-point ESG scale based on the evaluation of factors described below. Aristotle Pacific defines sustainable debt securities as investments permitted under its ESG Exclusionary Screens as described below.
In executing its investment strategy, the Fund seeks to:
| • | combine the efforts of two experienced, high-quality managers within their respective investment disciplines; and |
| • | deliver a portfolio that is prudently diversified between equity securities of various sized companies and debt securities of various maturities and investment grade ratings meeting certain sustainability standards. |
Equity Securities. With respect to the equity securities in the Fund, Tran considers both the external impact of a company’s product or service and the company’s internal policies, controls, and interactions with shareholders, employees, and other stakeholders as part of its 5-point ESG scale. External and internal factors are weighted equally. Tran uses an intensive fundamental due diligence process to attempt to identify companies that meet its proprietary investment criteria based on the objective of preserving principal and capital appreciation. Tran identifies mid- and large-cap companies that it believes have a sustainable competitive advantage. Tran then evaluates the resulting universe of companies for those that generally exhibit the characteristics.
In selecting equity securities for the Fund, Tran looks for companies it believes have a competitive advantage and generate consistently high returns on capital. Such companies will, in Tran’s opinion, possess high margins, strong cash flow, zero-to-moderate debt and trade at a price below intrinsic value. Securities in Tran’s allocation of the Fund’s portfolio that score poorly (i.e., 2 or less on Tran’s 5-point scale) with respect to the ESG factors described above will not be counted towards the Fund’s 80% policy. Tran does not employ negative screening and will consider domestic companies with market capitalization of over $2 billion in all industries for the portfolio. Through its investment process, Tran seeks to build an understanding of the competitive advantages, financial drivers, and key risks and uncertainties related to an investment under consideration. Tran believes that its ESG framework can aid in identifying sustainable franchises and may, in its view, better position the Fund to perform over the long term and through market cycles. Tran’s internally-developed ESG framework considers “environmental, social, and governance” risks and value-creation opportunities. Tran obtains information related to the application of its ESG framework through its own research and analysis of publicly available information, including information related to a company’s existing policies and actions related to social responsibility, as determined by its ESG framework. Tran also obtains data and information which is incorporated into its ESG framework through direct engagement with management teams of the Fund’s portfolio companies or potential portfolio companies.
External factors considered include, but are not limited to:
| • | a company’s contribution to climate change and goals for reaching net zero |
| • | impact on natural resources |
| • | promotion of clean, renewable, and green activities |
| • | product safety and responsibility |
| • | interaction with the communities served by the company |
| • | promotion of access to information, healthcare, financing, etc. |
| • | strength of ESG reporting and quality of disclosures and transparency |
Internal factors considered include, but are not limited to:
| • | policies and actions that promote sustainability |
| • | footprint of corporate facilities |
| • | treatment of employees |
| • | diversity & inclusion measures along with goals or policies for improvement |
| • | having and enabling a culture of feedback |
| • | diverse representation on the board of directors and executive team |
| • | management alignment with shareholders |
| • | strong checks and balances |
Debt Securities. In selecting debt securities for the Fund, Aristotle Pacific implements a fundamental research process that combines a bottom-up issuer analysis and top-down market assessment. For its bottom-up issuer analysis, Aristotle Pacific relies on its fundamental research analysis of individual issuers. Aristotle Pacific’s top-down market assessment provides a framework for portfolio risk positioning and sector allocations. Once this is determined, Aristotle Pacific looks for companies that it believes have financially sound competitive positions, strong management teams and the ability to repay or refinance its debt obligations. Aristotle Pacific performs a credit analysis (a process designed to measure an issuer’s ability to repay or refinance its debt obligations) on each potential issuer and a relative value analysis (by analyzing the investment’s attractiveness relative to other investments with similar profiles for risk and liquidity) for each potential investment.
Aristotle Pacific has created two ESG Exclusionary Screens, one of which is applicable to corporate debt issues (“Corporate Debt Screen”) and the other of which is applicable to government debt issues (the “Government Debt Screen”). This information is determined by the internal methodologies and ESG analytics of those providers. The Corporate Debt Screen identifies a universe of corporate bonds, asset-backed securities, and mortgage-related securities, the issuers of which are not directly in:
| • | the extraction of thermal coal, coal power generation, and providing tailor-made products and services that support thermal coal extraction that contribute materially to company revenue; |
| • | the production of tobacco; |
| • | the production or sale of controversial military weapons; |
| • | serious or systematic human rights violations; |
| • | severe environmental damage; or |
| • | gross corruption or other serious financial crime. |
Aristotle Pacific uses a combination of issuer lists and ESG-specific issuer information provided by independent third party ESG data providers, including Morningstar Sustainalytics, MSCI and Norges Bank, to determine which issuers are permitted investments under the Corporate Debt Screen. This information is determined by the internal methodologies and ESG analytics of those providers. Aristotle Pacific uses the Government Debt Screen to identify a universe of sovereign debt issued by government and sovereign issuers that have not received ESG ratings of “high risk” or “severe risk” from the third-party ESG data provider used by Aristotle Pacific.
To evaluate an issuer’s material ESG factors that help inform portfolio management decisions, Aristotle Pacific generally relies upon the assessments of third-party ESG data providers that score the material ESG factors of issuers to determine the issuer’s overall ESG rating(s) (the “Overall ESG Rating(s)”). Overall ESG Rating(s) apply to all debt issues in the third-party ESG data provider(s)’ coverage universe.
The Overall ESG Rating(s) consider, as applicable or relevant, the following factors:
| • | environmental assessments (involving issues such as greenhouse gas emissions, resource efficiency, use of natural resources and/or waste management), |
| • | social assessments (involving issues such as human capital management, labor standards, occupational health and safety records, data security and/or product quality and safety) and/or |
| • | governance assessments (involving issues such as board structure and quality, executive compensation, anti-competitive practices, ownership, shareholder rights, and/or geopolitical risk). |
When determining an issuer’s Overall ESG Rating(s), the providers rate the material ESG factors of each issuer within the providers’ universe and then apply weights to each factor’s score to create an aggregate score. These ratings seek to measure the degree to which an issuer’s economic value is at risk due to ESG factors (e.g., an insurance company that has to cover flood and tornado claims), how well they manage the ESG risks relative to peers, and potential opportunities arising from ESG factors. In the event that third-party ESG metrics are not available for an issuer considered for investment, Aristotle Pacific may rely on its own qualitative research as a substitute (but is not required to perform an analysis of ESG factors on issuers using the same materiality assessment or methodologies of ESG providers). In such instances, Aristotle Pacific may conclude that investments qualify and should be included in the portfolio because of other materiality factors or the results of its own internal qualitative research. Although Overall ESG Ratings(s) help inform portfolio management decisions, it is not an exclusive factor and Aristotle Pacific may elect to invest in an issue based upon its own fundamental research analysis.
The Fund seeks to invest in debt issuers with a lower average carbon intensity than the average carbon intensity of the debt securities within the Bloomberg US Aggregate Bond Index (the Fund’s benchmark index) for which this data is available using the carbon intensity definition and calculation methodology of an independent third-party ESG data provider. Carbon intensity is considered a separate ESG metric than the Overall ESG Rating(s) for debt issuers. Investments in companies possessing higher carbon intensity compared to others within the benchmark can be made as long as the Fund’s overall carbon intensity level remains lower than that of the benchmark.
An investment is generally sold when the fundamentals of the issuer are deteriorating, when the issue has realized its price appreciation target, the issue no longer offers relative value, or an adverse change in corporate or sector fundamentals has occurred. Each Sub-Adviser will re-evaluate the ESG criteria of the portfolio securities periodically to determine which securities should be considered for sale based on whether the portfolio securities continue to meet the ESG criteria. In addition, a company that meets a Sub-Adviser’s ESG criteria at the time of investment may subsequently fail to meet the ESG criteria, either due to the availability of more information or changing circumstances, and the Sub-Adviser is under no obligation to sell the security upon the occurrence of those circumstances or availability of that information.
The bar chart demonstrates the risks of investing in the Fund by showing changes in the Fund’s performance from year to year. The Average Annual Total Returns table also demonstrates these risks by showing how the Fund’s average annual returns for the 1-year, and since inception periods compare with those of a broad measure of market performance. Performance data for the classes varies based on differences in their fee and expense structures.
The Fund’s past performance, before and after taxes, is not necessarily an indication of how the Fund will perform in the future. Updated performance information is available on the Fund’s website at www.thecromwellfunds.com or by calling the Fund at 1-855-625-7333 (toll free).
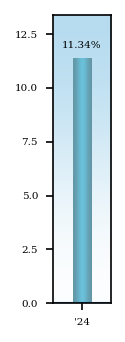
Best Quarter: 6.50% (Quarter ended March 31, 2024)
Worst Quarter: (1.30)% (Quarter ended December 31, 2024)
Average Annual Returns - Cromwell Sustainable Balanced Fund |
1 Year |
Since Inception |
|---|---|---|
| Institutional Class | 11.34% | 11.27% |
| Return After Taxes on Distributions | Institutional Class | 10.82% | 10.76% |
| S&P 500® Total Return Index (reflects no deduction for fees, expenses or taxes) | 25.02% | 24.87% |
| 60% S&P 500 / 40% Bloomberg US Aggregate Bond (reflects no deduction for fees, expenses, or taxes) | 15.04% | 14.96% |
The S&P 500 Total Return Index, an unmanaged index of U.S. stock market performance, is the Fund’s regulatory index. The Fund’s regulatory index is shown in connection with certain regulatory requirements to provide a broad measure of market performance. The blended 60% S&P 500 / 40% Bloomberg US Aggregate Bond is a supplemental index that the Adviser believes is more representative of the Fund’s investment universe.
After-tax returns are calculated using the highest historical individual federal marginal income tax rates and do not reflect the impact of state and local taxes. Actual after-tax returns depend on your tax situation and may differ from those shown. Furthermore, the after-tax returns shown are not relevant to shareholders who hold their shares through tax-deferred or other tax-advantaged arrangements, such as 401(k) plans or individual retirement accounts (“IRAs”). In certain cases, Return After Taxes on Distributions and Sale of Fund Shares may be higher than the other return figures for the same period when a capital loss occurs upon the redemption of Fund shares because there is an assumed tax deduction that benefits the investor.
non-investment grade and lower for debt instruments that are of higher quality. Defaults may potentially reduce the Fund’s income or ability to recover amounts due and may reduce the value of the debt instrument, sometimes dramatically.
•Interest Rate Risk. The value of debt instruments may fall when interest rates rise. Debt instruments with longer durations tend to be more sensitive to changes in interest rates, making them more volatile than debt instruments with shorter durations or floating or adjustable interest rates. During periods when interest rates are low or there are negative interest rates, the Fund’s yield (and total return) also may be low and the Fund may experience low or negative returns. The Fund may be subject to heightened levels of interest rate risk because the Federal Reserve has raised, and may continue to raise, interest rates. As interest rates rise, the value of fixed income investments will generally decrease.•Mortgage-Backed/Asset-Backed Securities Risk. Prepayment risk is associated with mortgage-backed and asset-backed securities. If interest rates fall, the underlying debt may be repaid ahead of schedule, reducing the value of the Fund’s investments. If interest rates rise, there may be fewer prepayments, which would cause the average bond maturity to rise, increasing the potential for the Fund to lose money. The value of these securities may be significantly affected by changes in interest rates, the market’s perception of issuers, and the creditworthiness of the parties involved. The ability of the Fund to successfully utilize these instruments may depend on the ability of the Sub-Adviser to forecast interest rates and other economic factors correctly. These securities may have a structure that makes their reaction to interest rate changes and other factors difficult to predict, making their value highly volatile.