Cromwell Greenspring Mid Cap Fund’s (the “Greenspring Fund” or the “Fund”) investment objective is long-term capital appreciation.
This table describes the fees and expenses that you may pay if you buy, hold and sell shares of the Fund. You may pay other fees, such as brokerage commissions and other fees to financial intermediaries, which are not reflected in the table and examples below.
Shareholder Fees - Cromwell Greenspring Mid Cap Fund - USD ($) |
Investor Class |
Institutional Class |
|---|---|---|
| Shareholder Fee, Other | none | none |
Annual Fund Operating Expenses - Cromwell Greenspring Mid Cap Fund |
Investor Class |
Institutional Class |
|---|---|---|
| Management Fees | 0.75% | 0.75% |
| Distribution and Service (12b-1) Fees | 0.25% | none |
| Other Expenses | 0.29% | 0.29% |
| Total Annual Fund Operating Expenses | 1.29% | 1.04% |
This example is intended to help you compare the costs of investing in the Fund with the cost of investing in other mutual funds. The example assumes that you invest $10,000 in the Fund for the time periods indicated and that you then redeem or hold all of your shares at the end of those periods. The example also assumes that your investment has a 5% return each year and that the Fund’s operating expenses remain the same. Although your actual costs may be higher or lower, based on these assumptions, your costs would be:
Expense Example - Cromwell Greenspring Mid Cap Fund - USD ($) |
One Year |
Three Years |
Five Years |
Ten Years |
|---|---|---|---|---|
| Investor Class | 131 | 409 | 708 | 1,556 |
| Institutional Class | 106 | 331 | 574 | 1,271 |
The Fund pays transaction costs, such as commissions, when it buys and sells securities (or “turns over” its portfolio). A higher portfolio turnover rate may indicate higher transaction costs and may result in higher taxes when Fund shares are held in a taxable account. These transaction costs and potentially higher taxes, which are not reflected in the Total Annual Fund Operating Expenses or in the example, affect the Fund’s performance. During the fiscal year ended December 31, 2024, the portfolio turnover rate of the Fund was 11% of the average value of its portfolio.
The Fund primarily invests in equity securities its investment sub-adviser, Corbyn Investment Management, Inc. (the “Corbyn Sub-Adviser” or “Sub-Adviser”), believes are undervalued at the time of purchase and have the potential to provide capital appreciation, income, or a combination of both. Under normal circumstances, the Fund invests at least 80% of its net assets (plus borrowings for investment purposes) in equity securities of mid-sized capitalization U.S. companies (“mid cap companies”) at time of purchase which, for the purposes of the Fund, are those companies with market capitalizations similar to the market capitalizations of companies listed in the Russell Midcap® Index or the S&P MidCap 400® Index. The Fund’s equity securities investments may include common and preferred stocks of United States companies. As of March 31, 2025, the market capitalization of companies in the Russell Midcap® Index ranged from approximately $0.3 billion to $198 billion and the market capitalization of companies in the S&P MidCap 400® Index ranged from approximately $1.2 billion to $18.5 billion. The companies in which the Fund may invest are those the Corbyn Sub-Adviser believes provide an attractive risk/reward value and are undervalued relative to historical valuations, the company’s peers, or the securities market in general. The Sub-Adviser utilizes a bottom-up, fundamental “value” investing approach. The Sub-Adviser considers several factors, including, but not limited to, a company’s market position, management quality, balance sheet strength, free cash flow generation, and industry or company-specific catalysts. The Fund invests primarily in U.S.-listed companies. The Sub-Adviser may sell a security for a variety of reasons, including, but not limited to, when the Sub-Adviser’s analysis indicates that (1) continued investment in the security no longer represents a favorable risk-reward relationship; (2) a new security is determined to have a more attractive valuation; (3) the current business, future outlook or management of a particular company’s security has deteriorated; or (4) general market conditions favor a sale.
The bar chart demonstrates the risks of investing in the Fund by showing changes in the Fund’s performance from year to year. The Average Annual Total Returns table also demonstrates these risks by showing how the Fund’s average annual returns for the 1-year, 5-year, 10-year, and since inception periods compare with those of a broad measure of market performance. Performance data for the classes varies based on differences in their fee and expense structures.
Effective August 14, 2023, Greenspring Fund, Inc. (the “Predecessor Fund”), reorganized into the Fund (the “Reorganization”). Following the Reorganization, the Fund made certain changes to its principal investment strategies. Accordingly, performance information shown prior to August 14, 2023, is based on the Predecessor Fund’s principal investment strategies, and may not be representative of the Fund’s performance under its current principal investment strategies. Accordingly, the returns for Institutional Class shares in the bar chart and table are the returns of the Predecessor Fund. The Predecessor Fund did not offer Investor Class shares. Returns of the Investor Class shares shown in the table prior to the Reorganization reflect the returns of the Institutional Class shares, adjusted to reflect the expenses of the Investor Class. The performance returns for the Investor Class will be lower than those of the Institutional Class due to the higher expenses.
The Fund has adopted the Financial Statements of the Predecessor Fund. The Predecessor Fund’s past performance, before and after taxes, is not necessarily an indication of how the Fund will perform in the future. Updated performance information is available on the Fund’s website at www.thecromwellfunds.com or by calling the Fund at 1-855-625-7333 (toll free).
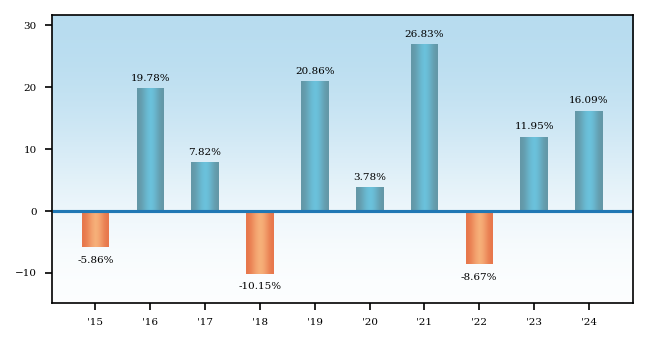
Best Quarter: 16.94% (Quarter ended December 31, 2020)
Worst Quarter: (26.16)% (Quarter ended March 31, 2020)
Average Annual Returns - Cromwell Greenspring Mid Cap Fund |
1 Year |
5 Years |
10 Years |
|---|---|---|---|
| Institutional Class | 16.09% | 9.33% | 7.51% |
| Return After Taxes on Distributions | Institutional Class | 14.33% | 7.71% | 5.67% |
| Return After Taxes on Distributions and Sale of Fund Shares | Institutional Class | 10.90% | 7.15% | 5.57% |
| Russell 3000 Total Return Index (reflects no deduction for fees, expenses, or taxes) | 23.81% | 13.86% | 12.55% |
| Russell Mid Cap Total Return Index (reflects no deduction for fees, expenses, or taxes) | 15.34% | 9.92% | 9.63% |
| Greenspring Custom Blend Index (reflects no deduction for fees, expenses, or taxes) | 11.08% | 6.97% | 6.76% |
The Russell 3000 Total Return Index, a capitalization-weighted stock market index that seeks to be a benchmark of the entire U.S. stock market, is the Fund’s regulatory index. The Fund’s regulatory index is shown in connection with certain regulatory requirements to provide a broad measure of market performance. The Russell Mid Cap Total Return Index is a supplemental index that the Adviser believes is more representative of the Fund’s investment universe. The Fund’s blended benchmark consists of a weighted average comprised of 60% Russell 3000 Value Index, 30% ICE BAML 1-3yr BB Cash Pay High Yield Index, and 10% ICE BAML 3-month T-Bill Index (rebalanced monthly). The Russell 3000 Value Index is composed of those companies among the largest 3000 US-incorporated equities by market capitalization that exhibit value characteristics such as lower price-to-book ratios and lower expected growth rates. This total return market index assumes that all cash distributions are reinvested, in addition to tracking the price movements. The ICE BAML 1-3 year BB Cash Pay High Yield Index, a subset of ICE BAML U.S. Cash Pay High Yield Index, consists of all securities rated BB- through BB+ by S&P with a remaining term to final maturity of 3 years or less. The ICE BAML U.S. 3-month T-Bill Index reflects the performance of purchasing a single T-Bill issue at the beginning of the month and holding it for a full month. An investment cannot be made directly into an index.
After-tax returns are calculated using the highest historical individual federal marginal income tax rates and do not reflect the impact of state and local taxes. Actual after-tax returns depend on your tax situation and may differ from those shown. Furthermore, the after-tax returns shown are not relevant to shareholders who hold their shares through tax-deferred or other tax-advantaged arrangements, such as 401(k) plans or individual retirement accounts (“IRAs”). After-tax returns are shown for the Institutional Class shares only and after-tax returns for the other classes will vary. In certain cases, Return After Taxes on Distributions and Sale of Fund Shares may be higher than the other return figures for the same period when a capital loss occurs upon the redemption of Fund shares because there is an assumed tax deduction that benefits the investor.
in the value of such securities. Such declines may occur quickly and without warning and may negatively impact the value of the Fund and your investment.