Pay vs Performance Disclosure - USD ($)
Dec. 31, 2022
Oct. 02, 2022
Dec. 31, 2024
Dec. 31, 2023
Dec. 31, 2022
Pay Versus Performance
Pay Versus Performance Table
The following table presents, for each of the three most recent fiscal years:
• | total compensation, as calculated in the Summary Compensation Table, for our CEO and an average for our other NEOs; |
• | compensation actually paid (“CAP”) to the NEOs, an SEC prescribed calculation which adjusts total compensation for the items described below and which does not equate to realized compensation; |
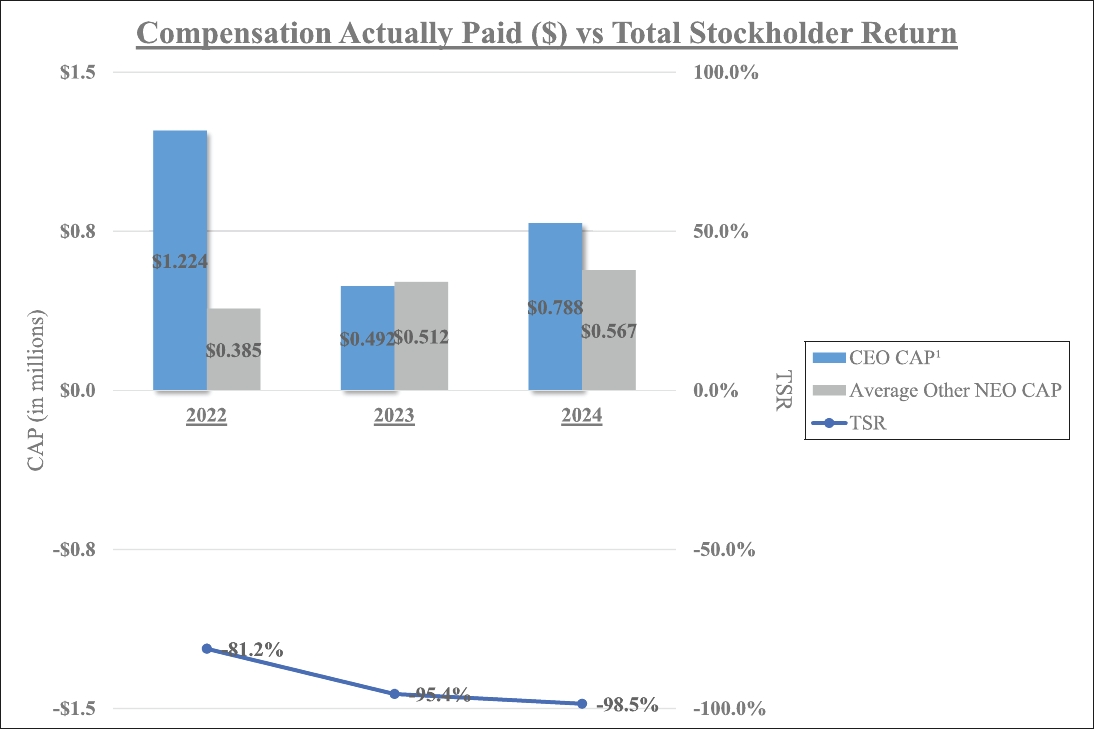
• | our cumulative total stockholder return (“TSR”) since the last trading day before the earliest year presented; and |
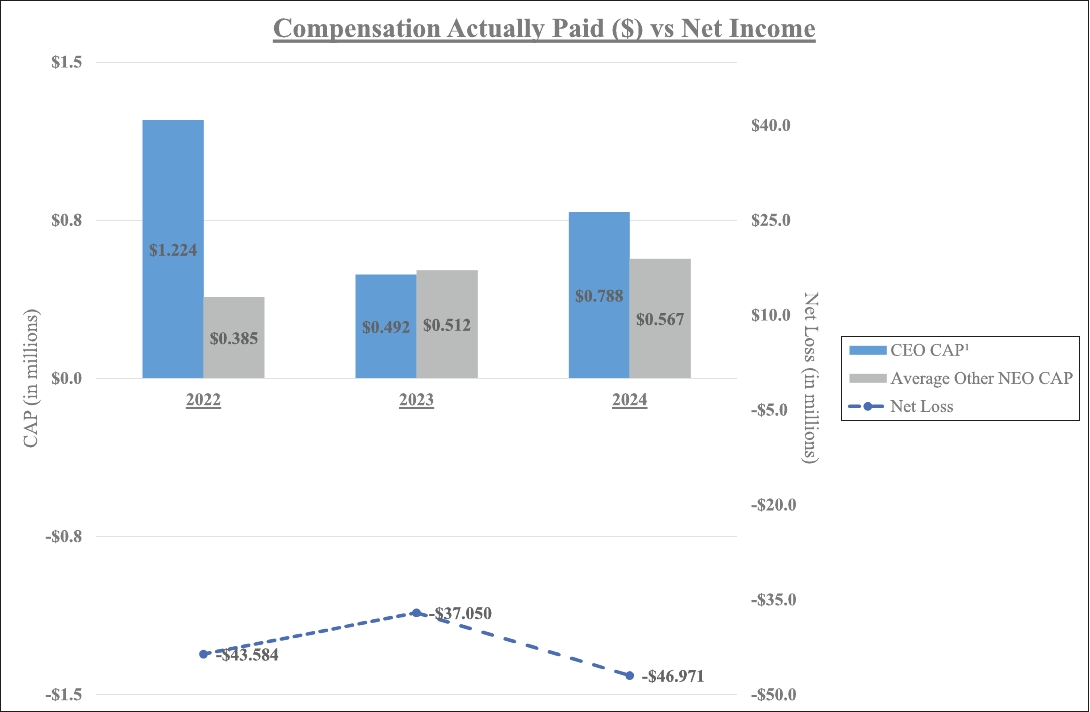
• | our net income. |
This section should be read in conjunction with the Compensation Discussion and Analysis, which includes additional discussion of the objectives of our executive compensation program and how they are aligned with the Company’s financial performance.
Year | Summary Compensation Table Total for Domenic Serafino (Former CEO)(1) | Compensation Actually Paid to Domenic Serafino (Former CEO)(2) | Summary Compensation Table Total for Rajiv De Silva (Current CEO) | Compensation Actually Paid to Rajiv De Silva (Current CEO) | Average Summary Compensation Table Total for Non-CEO NEOs(3) | Average Compensation Actually Paid to Non-CEO NEOs | Value of Initial Fixed $100 Investment Based on Total Stockholder Return(4) | Net Loss | ||||||||||||||||
Dollars in thousands | ||||||||||||||||||||||||
2024 | $842,625 | $788,400 | $580,117 | $566,604 | $1.45 | (46,971) | ||||||||||||||||||
2023 | — | — | $842,625 | $491,718 | $592,336 | $511,688 | $4.50 | (37,050) | ||||||||||||||||
2022 | $765,187 | $513,274 | $898,655 | $710,885 | $586,398 | $384,940 | $18.50 | (43,584) | ||||||||||||||||
(1) | For details regarding Mr. Serafino’s total compensation during 2022 and 2021, please refer to the Summary Compensation Table section and related disclosure contained in the Company’s definitive proxy statement filed with the SEC on April 10, 2023. |
(2) | For details regarding Mr. Serafino’s total compensation during 2022 and 2021, please refer to the Pay Versus Performance section and related disclosure contained in the Company’s definitive proxy statement filed with the SEC on April 10, 2023. |
(3) | The fiscal year 2021 figure is an average of the summary compensation table totals for Domenic Della Penna, Executive Vice President & Chief Financial Officer and Soeren Maor Sinay, former Chief Operations Officer of the Company; the fiscal year 2022 figure is an average of the summary compensation table totals for Domenic Della Penna, Executive Vice President & Chief Financial Officer and Ross Portaro, Executive Vice President & General Manager, Global Sales & Marketing; the fiscal year 2023 figure is an average of the summary compensation table totals for Dr. Hemanth Varghese, President and Chief Operating Officer and Ross Portaro, Executive Vice President & General Manager, Global Sales & Marketing; the fiscal year 2024 figure is an average of the summary compensation table totals for Dr. Hemanth Varghese, former President and Chief Operating Officer and Ross Portaro, Executive Vice President & General Manager, Global Sales & Marketing. |
(4) | Our cumulative TSR is based on a fixed investment of one hundred dollars in our common stock measured from the market close on December 31, 2021 (the last trading day of 2021) through and including the end of the fiscal year for each year reported in the table, and reinvestment of all dividends during such period. |
To calculate CAP to our former and current Chief Executive Officer and the average CAP to the other NEOs, the following amounts were deducted from and added to total compensation, as depicted in the Summary Compensation Table:
Deductions | Additions | |||||||||||
Year | Summary Compensation Total ($) | Amounts Reported in the Summary Compensation Table for Stock Awards and Stock Options Awards ($) | Fair Value of Stock Awards as Determined in Accordance with the SEC’s CAP Methodology ($) | Compensation Actually Paid ($) | ||||||||
Rajiv De Silva | ||||||||||||
2024 | 842,625 | — | -54,225(1) | 788,400 | ||||||||
2023 | 842,625 | — | -350,907(2) | 491,718 | ||||||||
2022 | 898,655 | 684,090 | 496,320(3) | 710,885 | ||||||||
Deductions | Additions | |||||||||||
Year | Summary Compensation Total ($) | Amounts Reported in the Summary Compensation Table for Stock Awards and Stock Options Awards ($) | Fair Value of Stock Awards as Determined in Accordance with the SEC’s CAP Methodology ($) | Compensation Actually Paid ($) | ||||||||
Average for Other NEOs | ||||||||||||
2024 | 580,117 | — | -13,513(4) | 566,604 | ||||||||
2023 | 592,336 | 8,691 | -71,957(5) | 511,688 | ||||||||
2022 | 586,398 | 117,974 | -83,484(6) | 384,940 | ||||||||
(1) | Mr. De Silva’s 2024 add back adjustment is the sum of (i) the fair value of all unvested and outstanding awards granted in 2024 as of December 31, 2024 ($0), (ii) the change in fair value of all unvested and outstanding options issued prior to 2024 with the change measured from December 31, 2023 to December 31, 2024 (-$42,381), (iii) the fair value of awards granted and vested in 2024 ($0), and (iv) the change in fair value of awards vested in 2024 but issued in a prior year with the change measured from December 31, 2023 to the vesting date (-$11,844). |
(2) | Mr. De Silva’s 2023 add back adjustment is the sum of (i) the fair value of all unvested and outstanding awards granted in 2023 as of December 31, 2023 ($0), (ii) the change in fair value of all unvested and outstanding options issued prior to 2023 with the change measured from December 31, 2022 to December 31, 2023 (-$278,784), (iii) the fair value of awards granted and vested in 2023 ($0), and (iv) the change in fair value of awards vested in 2023 but issued in a prior year with the change measured from December 31, 2022 to the vesting date (-$72,123). |
(3) | Mr. De Silva’s 2022 add back adjustment is the sum of (i) the fair value of all unvested and outstanding awards granted in 2022 as of December 31, 2022 ($496,320), (ii) the change in fair value of all unvested and outstanding options issued prior to 2022 with the change measured from December 31, 2021 to December 31, 2022 ($0), (iii) the fair value of awards granted and vested in 2022 ($0), and (iv) the change in fair value of awards vested in 2022 but issued in a prior year with the change measured from December 31, 2021 to the vesting date ($0). |
(4) | The add back adjustment for the 2024 Other NEOs (Mr. Varghese and Mr. Portaro) is the sum of (i) the average fair value of all unvested and outstanding awards granted in 2024 to the 2024 Other NEOs as of December 31, 2024 ($0), (ii) the average change in fair value of all unvested and outstanding options issued to the 2024 Other NEOs prior to 2024 with the change measured from December 31, 2023 to December 31, 2024 (-$10,211), (iii) the average fair value of awards granted to the 2024 Other NEOs and vested in 2024 ($0), and (iv) the average change in fair value of awards vested in 2024 but issued in a prior year to the 2024 Other NEOs with the change measured from December 31, 2023 to the vesting date (-$3,302). |
(5) | The add back adjustment for the 2023 Other NEOs (Mr. Varghese and Mr. Portaro) is the sum of (i) the average fair value of all unvested and outstanding awards granted in 2023 to the 2023 Other NEOs as of December 31, 2023 ($3,067), (ii) the average change in fair value of all unvested and outstanding options issued to the 2023 Other NEOs prior to 2023 with the change measured from December 31, 2022 to December 31, 2023 (-$60,683), (iii) the average fair value of awards granted to the 2023 Other NEOs and vested in 2023 ($1,016), and (iv) the average change in fair value of awards vested in 2023 but issued in a prior year to the 2023 Other NEOs with the change measured from December 31, 2022 to the vesting date (-$15,357). |
(6) | The add back adjustment for the 2022 Other NEOs (Mr. Della Penna and Mr. Portaro) is the sum of (i) the average fair value of all unvested and outstanding awards granted in 2022 to the 2022 Other NEOs as of December 31, 2022 ($47,776), (ii) the average change in fair value of all unvested and outstanding options issued to the 2022 Other NEOs prior to 2022 with the change measured from December 31, 2021 to December 31, 2022 (-$100,108), (iii) the average fair value of awards granted to the 2022 Other NEOs and vested in 2022 ($3,349), and (iv) the average change in fair value of awards vested in 2022 but issued in a prior year to the 2022 Other NEOs with the change measured from December 31, 2021 to the vesting date (-$34,501). |
The fair value of stock awards includes the value of RSU awards. The measurement date fair value of the RSUs was determined based on the market price of the Company’s common stock on the measurement date. The fair value of options granted is calculated in accordance with ASC Topic 718, utilizing the Black-Scholes model for the applicable measurement dates.
(1) | For details regarding Mr. Serafino’s total compensation during 2022 and 2021, please refer to the Summary Compensation Table section and related disclosure contained in the Company’s definitive proxy statement filed with the SEC on April 10, 2023. |
(2) | For details regarding Mr. Serafino’s total compensation during 2022 and 2021, please refer to the Pay Versus Performance section and related disclosure contained in the Company’s definitive proxy statement filed with the SEC on April 10, 2023. |
(3) | The fiscal year 2021 figure is an average of the summary compensation table totals for Domenic Della Penna, Executive Vice President & Chief Financial Officer and Soeren Maor Sinay, former Chief Operations Officer of the Company; the fiscal year 2022 figure is an average of the summary compensation table totals for Domenic Della Penna, Executive Vice President & Chief Financial Officer and Ross Portaro, Executive Vice President & General Manager, Global Sales & Marketing; the fiscal year 2023 figure is an average of the summary compensation table totals for Dr. Hemanth Varghese, President and Chief Operating Officer and Ross Portaro, Executive Vice President & General Manager, Global Sales & Marketing; the fiscal year 2024 figure is an average of the summary compensation table totals for Dr. Hemanth Varghese, former President and Chief Operating Officer and Ross Portaro, Executive Vice President & General Manager, Global Sales & Marketing. |
To calculate CAP to our former and current Chief Executive Officer and the average CAP to the other NEOs, the following amounts were deducted from and added to total compensation, as depicted in the Summary Compensation Table:
Deductions | Additions | |||||||||||
Year | Summary Compensation Total ($) | Amounts Reported in the Summary Compensation Table for Stock Awards and Stock Options Awards ($) | Fair Value of Stock Awards as Determined in Accordance with the SEC’s CAP Methodology ($) | Compensation Actually Paid ($) | ||||||||
Rajiv De Silva | ||||||||||||
2024 | 842,625 | — | -54,225(1) | 788,400 | ||||||||
2023 | 842,625 | — | -350,907(2) | 491,718 | ||||||||
2022 | 898,655 | 684,090 | 496,320(3) | 710,885 | ||||||||
Deductions | Additions | |||||||||||
Year | Summary Compensation Total ($) | Amounts Reported in the Summary Compensation Table for Stock Awards and Stock Options Awards ($) | Fair Value of Stock Awards as Determined in Accordance with the SEC’s CAP Methodology ($) | Compensation Actually Paid ($) | ||||||||
Average for Other NEOs | ||||||||||||
2024 | 580,117 | — | -13,513(4) | 566,604 | ||||||||
2023 | 592,336 | 8,691 | -71,957(5) | 511,688 | ||||||||
2022 | 586,398 | 117,974 | -83,484(6) | 384,940 | ||||||||
(1) | Mr. De Silva’s 2024 add back adjustment is the sum of (i) the fair value of all unvested and outstanding awards granted in 2024 as of December 31, 2024 ($0), (ii) the change in fair value of all unvested and outstanding options issued prior to 2024 with the change measured from December 31, 2023 to December 31, 2024 (-$42,381), (iii) the fair value of awards granted and vested in 2024 ($0), and (iv) the change in fair value of awards vested in 2024 but issued in a prior year with the change measured from December 31, 2023 to the vesting date (-$11,844). |
(2) | Mr. De Silva’s 2023 add back adjustment is the sum of (i) the fair value of all unvested and outstanding awards granted in 2023 as of December 31, 2023 ($0), (ii) the change in fair value of all unvested and outstanding options issued prior to 2023 with the change measured from December 31, 2022 to December 31, 2023 (-$278,784), (iii) the fair value of awards granted and vested in 2023 ($0), and (iv) the change in fair value of awards vested in 2023 but issued in a prior year with the change measured from December 31, 2022 to the vesting date (-$72,123). |
(3) | Mr. De Silva’s 2022 add back adjustment is the sum of (i) the fair value of all unvested and outstanding awards granted in 2022 as of December 31, 2022 ($496,320), (ii) the change in fair value of all unvested and outstanding options issued prior to 2022 with the change measured from December 31, 2021 to December 31, 2022 ($0), (iii) the fair value of awards granted and vested in 2022 ($0), and (iv) the change in fair value of awards vested in 2022 but issued in a prior year with the change measured from December 31, 2021 to the vesting date ($0). |
(4) | The add back adjustment for the 2024 Other NEOs (Mr. Varghese and Mr. Portaro) is the sum of (i) the average fair value of all unvested and outstanding awards granted in 2024 to the 2024 Other NEOs as of December 31, 2024 ($0), (ii) the average change in fair value of all unvested and outstanding options issued to the 2024 Other NEOs prior to 2024 with the change measured from December 31, 2023 to December 31, 2024 (-$10,211), (iii) the average fair value of awards granted to the 2024 Other NEOs and vested in 2024 ($0), and (iv) the average change in fair value of awards vested in 2024 but issued in a prior year to the 2024 Other NEOs with the change measured from December 31, 2023 to the vesting date (-$3,302). |
(5) | The add back adjustment for the 2023 Other NEOs (Mr. Varghese and Mr. Portaro) is the sum of (i) the average fair value of all unvested and outstanding awards granted in 2023 to the 2023 Other NEOs as of December 31, 2023 ($3,067), (ii) the average change in fair value of all unvested and outstanding options issued to the 2023 Other NEOs prior to 2023 with the change measured from December 31, 2022 to December 31, 2023 (-$60,683), (iii) the average fair value of awards granted to the 2023 Other NEOs and vested in 2023 ($1,016), and (iv) the average change in fair value of awards vested in 2023 but issued in a prior year to the 2023 Other NEOs with the change measured from December 31, 2022 to the vesting date (-$15,357). |
(6) | The add back adjustment for the 2022 Other NEOs (Mr. Della Penna and Mr. Portaro) is the sum of (i) the average fair value of all unvested and outstanding awards granted in 2022 to the 2022 Other NEOs as of December 31, 2022 ($47,776), (ii) the average change in fair value of all unvested and outstanding options issued to the 2022 Other NEOs prior to 2022 with the change measured from December 31, 2021 to December 31, 2022 (-$100,108), (iii) the average fair value of awards granted to the 2022 Other NEOs and vested in 2022 ($3,349), and (iv) the average change in fair value of awards vested in 2022 but issued in a prior year to the 2022 Other NEOs with the change measured from December 31, 2021 to the vesting date (-$34,501). |
(1) | Fiscal year 2022 represents an aggregate of CAP to Mr. Serafino and Mr. De Silva, inclusive of certain separation payments made to Mr. Serafino and certain inducements provided to Mr. De Silva as an incentive to accept employment with the Company. |
Over the course of the last three fiscal years, we have experienced a notable decline in the price of our stock as traded publicly on the Nasdaq Capital Market Exchange. While the Company did meet a number of significant commercial milestones during the last three fiscal years and successfully navigated through the COVID-19 pandemic, persisting adverse financing and interest rate environment, inflationary pressure, sector specific headwinds and macroeconomic uncertainty while executing on its transformative restructuring plan, the Company’s overall performance and financial condition has fallen short of expectation over the last three fiscal years. The aggregate CAP to our former and current CEO in 2022 includes certain consideration paid to Mr. Serafino in connection with his separation from the Company, and certain inducements provided to Mr. De Silva as incentive to accepting employment with the Company. Viewed individually, the CAP of Mr. Serafino and Mr. De Silva for fiscal year 2022 were each less than their respective Summary Compensation Table totals in fiscal year 2022.
In fiscal year 2023, the Company was able to achieve numerous milestones while executing on its restructuring plan, which resulted in operational efficiencies, including a significant decrease in operating expense, and a fifteen percent (15%) increase in net income year over year. Despite the achievement of these and other key metrics, the price of our stock continued to decline over the course of fiscal year 2023. The year over year decrease in CEO CAP from fiscal year 2022 to 2023 corresponds to the trends in the Company’s financial performance as measured by our cumulative TSR, as Mr. De Silva’s CAP for fiscal year 2023 is approximately forty two percent (42%) less than his Summary Compensation Table total for fiscal year 2023.
In fiscal year 2024, the Company was again able to achieve numerous milestones while executing on its restructuring plan, which resulted in operational efficiencies, including a fourteen percent (14%) decrease in cash used in operations year over year and a forty seven percent (47%) reduction in outstanding debt. Despite the achievement of these and other key metrics, the price of our stock continued to decline over the course of fiscal year 2024. While CEO CAP increased from fiscal year 2023 to 2024, Mr. De Silva’s Summary Compensation Table total remained flat year-over-year. When considering CEO CAP fiscal year 2024 in relation to the Company’s financial performance as measured by cumulative TSR, the main driver of divergence in trends is the lack of stock and/or options awards in fiscal year 2024, which limited deductions for the year. Mr. De Silva’s CAP for fiscal year 2024 is approximately six and one half percent (6.5%) less than his Summary Compensation Table total for fiscal year 2024 which generally corresponds to the Company’s financial performance as measured by our cumulative TSR. Further, Mr. De Silva’s CEO CAP from fiscal years 2022 and 2024 are relatively flat, which corresponds to trends in the Company’s financial performance as measured by net income for those fiscal years.
(1) | Fiscal year 2022 represents an aggregate of CAP to Mr. Serafino and Mr. De Silva, inclusive of certain separation payments made to Mr. Serafino and certain inducements provided to Mr. De Silva as an incentive to accept employment with the Company. |
While the aggregate CAP to our non-CEO NEOs in fiscal years 2023 and 2024 represent year over year increase, the average Summary Compensation Tables totals paid to non-CEO NEOs remain relatively flat year-over-year and CAP to non-CEO NEOs correlates to trends in net income. When considering aggregate CAP to non-CEO NEOs in fiscal years 2023 and 2024 in relation to the Company’s financial performance as measured by cumulative TSR, the main driver of divergence in trends is the substantial decrease in stock and/or options awards year-over-year (average $117,974 in fiscal year 2022; average $8,691 in fiscal year 2023; average $0 in fiscal year 2024), which limited deductions for the year. Further, TSR decline was substantially less from fiscal year 2022 to fiscal year 2023 and less still from 2023 to 2024. Assuming stock and/or options awards had been granted in amounts similar to those awarded in 2022, CAP to our non-CEO NEOs in fiscal year 2023 and 2024 would be relatively flat year-over-year and more correlated to the trends in the Company’s financial performance as measured by our cumulative TSR.