Pay vs Performance Disclosure - USD ($)
Dec. 31, 2022
Jul. 26, 2022
Dec. 31, 2024
Dec. 31, 2023
Dec. 31, 2022
Dec. 31, 2021
Dec. 31, 2020
| Year | SCT Total | CAP(2) | Average SCT Total for non PEO NEOs ($) | Average CAP(2) to non PEO NEOs ($) | Value of Initial Fixed $100 Investment Based On: | Net Income (Loss) ($) | Adjusted EBITDA ($)(3) | Comp. Adjusted EBITDA ($)(3) | ||||||||||||||||||||||||||||||
Prior PEO ($)(1) | Current PEO ($)(1) | Prior PEO ($)(1) | Current PEO ($)(1) | TSR ($) | Peer Group TSR (S&P Health Care Services Select Industry Index) ($) | |||||||||||||||||||||||||||||||||
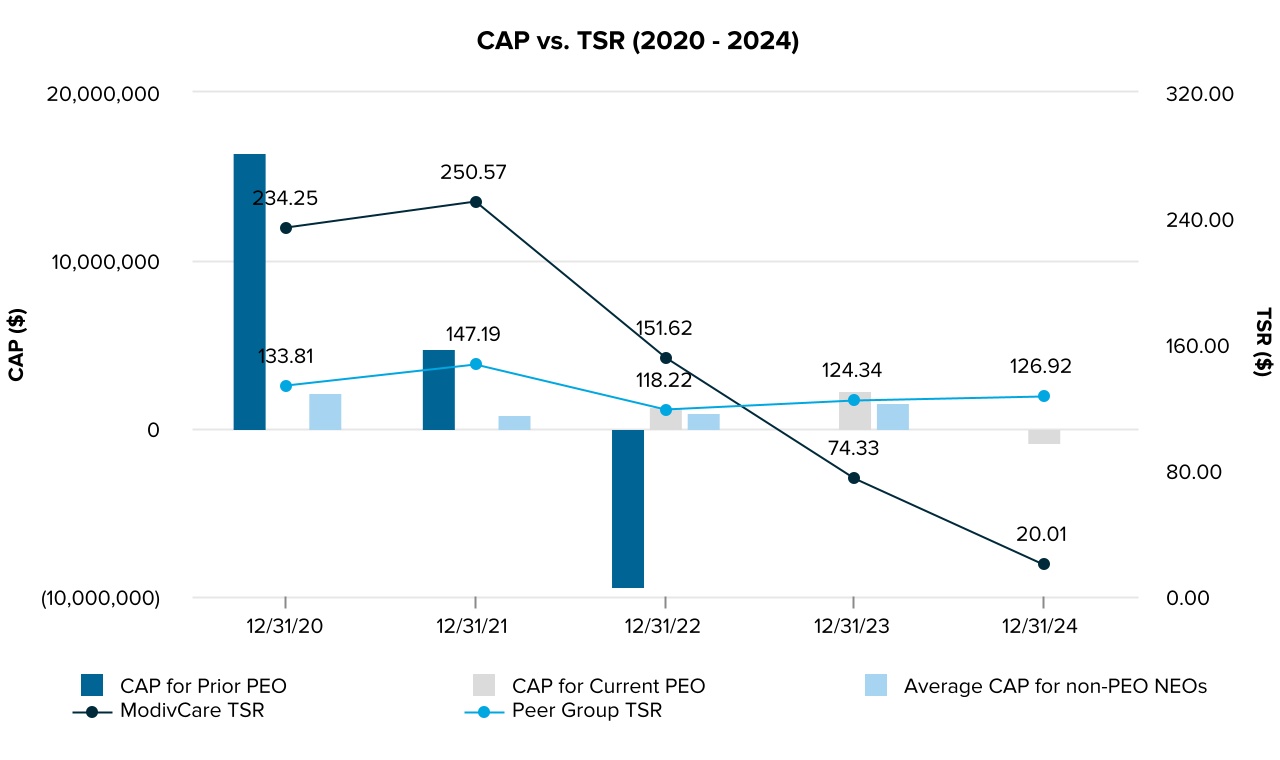
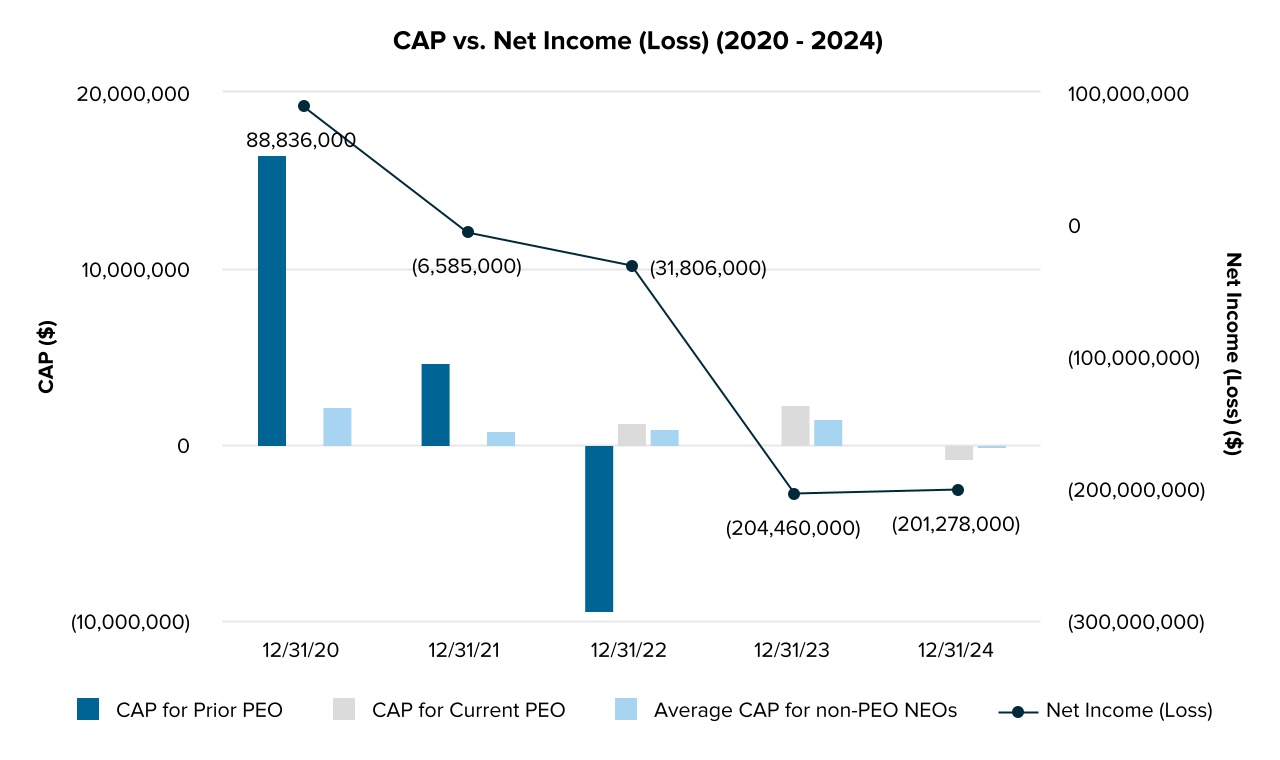
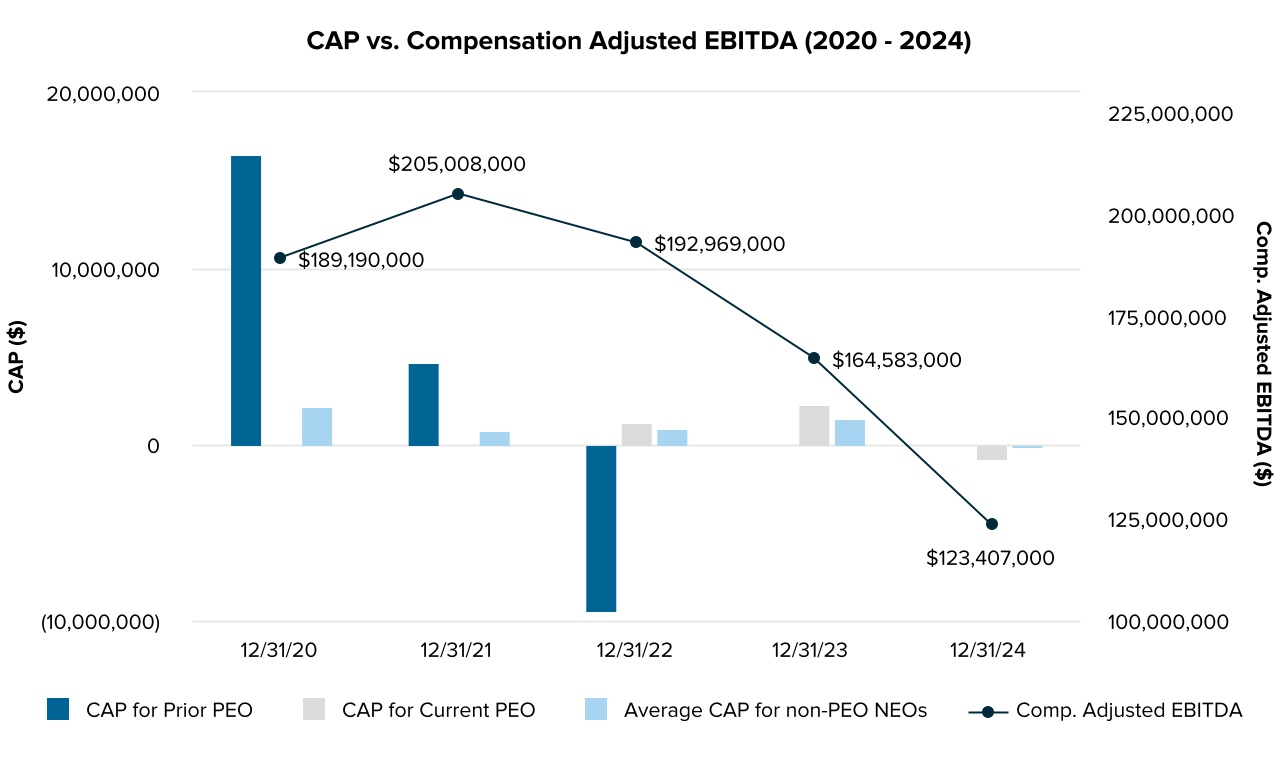
2024(4) | N/A | 2,520,122 | N/A | (829,015) | 1,237,767 | (59,346) | 20.01 | 126.92 | (201,278,000) | 161,134,000 | 123,407,000 | |||||||||||||||||||||||||||
2023(5) | N/A | 2,692,762 | N/A | 2,248,512 | 1,482,510 | 1,529,281 | 74.33 | 124.34 | (204,460,000) | 204,439,000 | 164,583,000 | |||||||||||||||||||||||||||
2022(6) | 5,373,333 | 2,266,785 | (9,416,369) | 1,256,475 | 1,475,719 | 955,828 | 151.62 | 118.22 | (31,806,000) | 221,902,000 | 192,969,000 | |||||||||||||||||||||||||||
2021(7) | 3,637,550 | N/A | 4,708,503 | N/A | 1,092,956 | 802,089 | 250.57 | 147.19 | (6,585,000) | 205,008,000 | 205,008,000 | |||||||||||||||||||||||||||
2020(8) | 4,691,139 | N/A | 16,436,594 | N/A | 925,246 | 2,192,785 | 234.25 | 133.81 | 88,836,000 | 189,190,000 | 189,190,000 | |||||||||||||||||||||||||||
The following reflects adjustments made to total compensation in the Summary Compensation Table (“SCT”), reported in columns (b) and (d) in the table above, to calculate CAP, reported in columns (c) and (e) in the table above, for each fiscal year:
Prior PEO(1) | Current PEO(1) | Average non-PEO NEOs(2) | ||||||||||||||||||||||||||||||||||||||||||
2020 ($) | 2021 ($) | 2022 ($) | 2022 ($) | 2023 ($) | 2024 ($) | 2020 ($) | 2021 ($) | 2022 ($) | 2023 ($) | 2024 ($) | ||||||||||||||||||||||||||||||||||
| Summary Compensation Total | 4,691,139 | 3,637,550 | 5,373,333 | 2,266,785 | 2,692,762 | 2,520,122 | 925,246 | 1,092,956 | 1,475,719 | 1,482,510 | 1,237,767 | |||||||||||||||||||||||||||||||||
(-) Grant Date Fair Value of Option Awards and Stock Awards Granted in Fiscal Year(3) | (1,699,645) | (1,699,947) | (4,762,378) | (1,360,941) | (1,516,933) | (1,685,011) | (149,701) | (420,720) | (850,727) | (990,063) | (687,634) | |||||||||||||||||||||||||||||||||
(+) Fair Value at Fiscal Year-End of Outstanding and Unvested Option Awards and Stock Awards Granted in Fiscal Year(4) | 5,066,337 | 1,291,121 | — | 936,226 | 1,997,762 | 329,417 | 516,965 | 390,666 | 356,906 | 1,113,307 | 98,084 | |||||||||||||||||||||||||||||||||
(+/-) Change in Fair Value of Outstanding and Unvested Option Awards and Stock Awards Granted in Prior Fiscal Years(5) | 6,271,922 | 858,909 | — | (347,599) | (713,297) | (1,355,643) | 668,570 | 40,318 | (11,584) | (63,371) | (290,213) | |||||||||||||||||||||||||||||||||
(+) Fair Value at Vesting of Option Awards and Stock Awards Granted in Fiscal Year That Vested During Fiscal Year(6) | — | — | — | — | — | — | — | — | — | — | — | |||||||||||||||||||||||||||||||||
(+/-) Change in Fair Value as of Vesting Date of Option Awards and Stock Awards Granted in Prior Fiscal Years For Which Applicable Vesting Conditions Were Satisfied During Fiscal Year(7) | 2,106,841 | 620,870 | (825,821) | (237,996) | (211,782) | (637,900) | 269,160 | 24,657 | (14,486) | (13,102) | (86,841) | |||||||||||||||||||||||||||||||||
(-) Fair Value as of Prior Fiscal Year-End of Option Awards and Stock Awards Granted in Prior Fiscal Years That Failed to Meet Applicable Vesting Conditions During Fiscal Year(8) | — | — | (9,201,503) | — | — | — | (37,455) | (325,788) | — | — | (330,509) | |||||||||||||||||||||||||||||||||
| Compensation Actually Paid | 16,436,594 | 4,708,503 | (9,416,369) | 1,256,475 | 2,248,512 | (829,015) | 2,192,785 | 802,089 | 955,828 | 1,529,281 | (59,346) | |||||||||||||||||||||||||||||||||
1.Refer to footnote 1 of the pay versus performance table above for information regarding who served as PEO during fiscal years 2020, 2021 and, partially, 2022, and who served as PEO for the remainder of fiscal year 2022 and all of 2023 and 2024.
2.Refer to footnotes 4, 5, 6, 7 and 8 above for the NEOs included in the average for each of 2024, 2023, 2022, 2021 and 2020, respectively.
3.Represents the grant date fair value of the stock option and stock awards granted during the indicated fiscal year, computed in accordance with the methodology used for financial reporting purposes.
4.Represents the fair value as of the indicated fiscal year-end of the outstanding and unvested option awards and stock awards granted during such fiscal year, computed in accordance with the methodology used for financial reporting purposes.
5.Represents the change in fair value during the indicated fiscal year of each option award and stock award that was granted in a prior fiscal year and that remained outstanding and unvested as of the last day of the indicated fiscal year, computed in accordance with the methodology used for financial reporting purposes and, for awards subject to performance-based vesting conditions, based on the probable outcome of such performance-based vesting conditions as of the last day of the fiscal year.
6.Represents the fair value at vesting of the option awards and stock awards that were granted and vested during the indicated fiscal year, computed in accordance with the methodology used for financial reporting purposes.
7.Represents the change in fair value, measured from the prior fiscal year-end to the vesting date, of each option award and stock award that was granted in a prior fiscal year and which vested during the indicated fiscal year, computed in accordance with the methodology used for financial reporting purposes.
8.Represents the fair value as of the last day of the prior fiscal year of the option award and stock awards that were granted in a prior fiscal year and which failed to meet the applicable vesting conditions in the indicated fiscal year, computed in accordance with the methodology used for financial reporting purposes.
•EBITDA
•Relative Total Shareholder Return (rTSR)
The following disclosure illustrates the relationship between the compensation actually paid to our executive officers and the performance of the Company. The table below presents information for each of the last five fiscal years regarding (i) the total compensation for our principal executive officers serving in that capacity during the applicable fiscal year (each, a “PEO”) and the average total compensation of our other NEOs (excluding the PEO(s)) who were serving in that capacity during the applicable fiscal year as disclosed in the Summary Compensation Table (“SCT”), (ii) total compensation actually paid (“CAP”) to each PEO and the CAP to the other NEOs on average, (iii) total shareholder return (“TSR”) for the Company and its peer group, (iv) the Company’s net income (loss), and (v) the Company’s Compensation Adjusted EBITDA, which is the most important financial measure used by the Company in determining executive compensation.
To calculate compensation actually paid, adjustments were made to the amounts reported in the Summary Compensation Table for the applicable year. A reconciliation of the adjustments for each of the PEOs and for the average of the non-PEO NEOs is set forth following the footnotes to this table.