Pay vs Performance Disclosure - USD ($)
Dec. 31, 2024
Dec. 31, 2023
Dec. 31, 2022
Dec. 31, 2021
Dec. 31, 2020
Pay Versus Performance
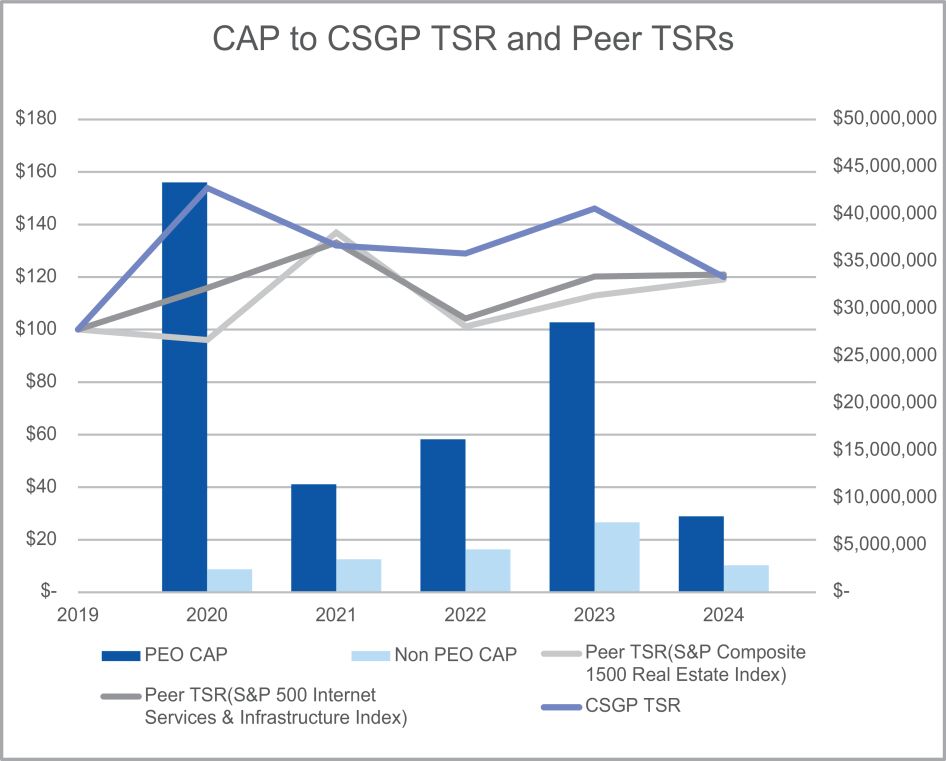
As required by Section 953(a) of the Dodd-Frank Act, we are providing the information below to illustrate the relationship between the
SEC-defined
compensation actually paid (“CAP”) and various measures used to gauge the Company’s financial performance in conformance with Item 402(v) of Regulation S-K.
CAP is calculated in accordance with Item 402(v) of Regulation S-K
and differs from compensation shown in the Summary Compensation Table for the Chief Executive Officer and other NEOs. See below for a reconciliation of the total compensation shown in the Summary Compensation Table to CAP. The Compensation Committee does not utilize CAP as the basis for making compensation decisions. For further information concerning our compensation philosophy and how we align executive compensation with our performance, see the Compensation Discussion and Analysis section beginning on page 37. The following table sets forth information concerning the compensation of our NEOs and our financial performance for each of the five years in the period ended December 31, 2024:
YEAR |
SUMMARY COMPENSATION TABLE TOTAL FOR PEO ($) |
COMPENSATION ACTUALLY PAID TO PEO (1) ($) |
AVERAGE SUMMARY COMPENSATION TABLE TOTAL FOR NON-PEO NEOS ($) |
AVERAGE COMPENSATION ACTUALLY PAID TO NON-PEO (1) NEOS ($) |
VALUE OF INITIAL FIXED $100 INVESTMENT BASED ON: |
NET INCOME ($ IN MILLIONS) |
EBITDA ($ IN MILLIONS) | ||||||||||||||||||||||||||||||||||||||
TOTAL SHAREHOLDER RETURN ($) |
PEER GROUP TOTAL SHAREHOLDER RETURN (2) ($) |
PEER GROUP TOTAL SHAREHOLDER RETURN (3) ($) | |||||||||||||||||||||||||||||||||||||||||||
2024 |
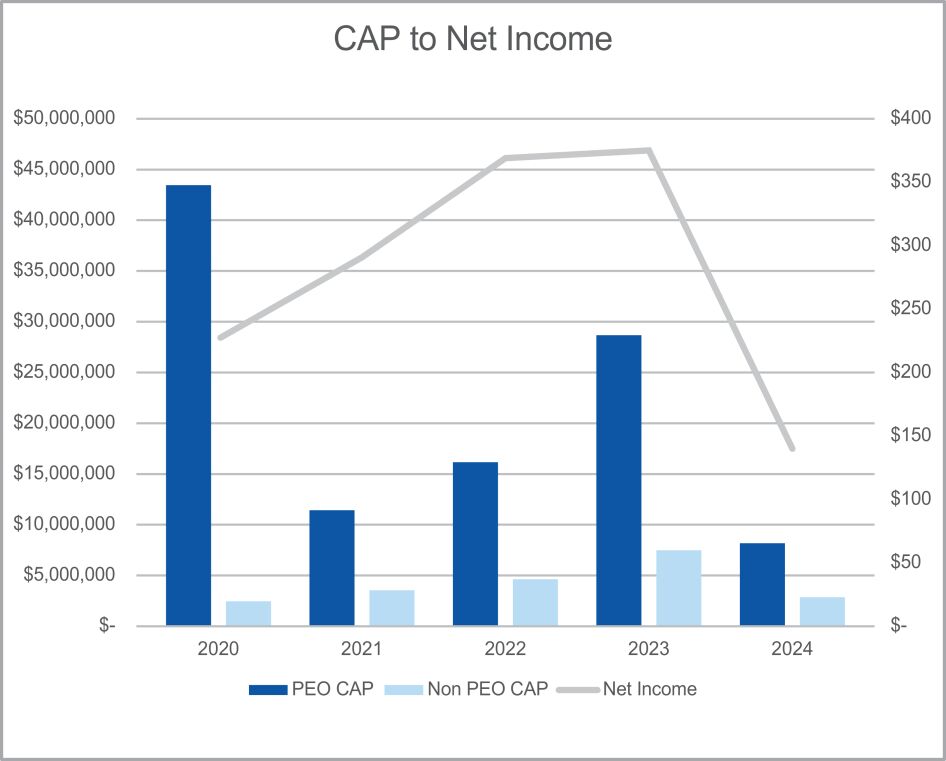
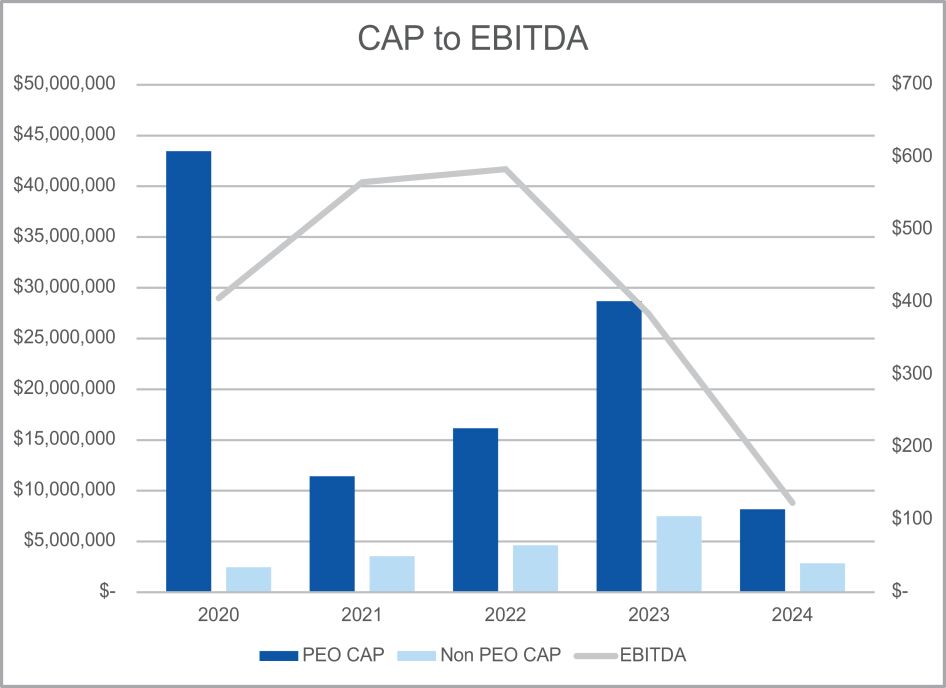
$ | 37,393,960 | $ | 8,220,790 | $ | 8,229,951 | $ | 2,855,473 | $ | 119.66 | $ | 118.76 | $ | 121.05 | $ | 138.7 | $ | 123.0 | |||||||||||||||||||||||||||
2023 |
$ | 29,176,180 | $ | 28,622,960 | $ | 7,289,696 | $ | 7,416,214 | $ | 146.06 | $ | 112.65 | $ | 119.55 | $ | 374.7 | $ | 389.8 | |||||||||||||||||||||||||||
2022 |
$ | 19,420,514 | $ | 16,180,113 | $ | 5,633,566 | $ | 4,583,956 | $ | 129.17 | $ | 101.00 | $ | 102.47 | $ | 369.5 | $ | 582.7 | |||||||||||||||||||||||||||
2021 |
$ | 22,164,341 | $ | 11,430,937 | $ | 6,616,193 | $ | 3,506,869 | $ | 132.09 | $ | 137.09 | $ | 133.08 | $ | 292.6 | $ | 565.0 | |||||||||||||||||||||||||||
2020 |
$ | 21,304,754 | $ | 43,421,540 | $ | 5,349,361 | $ | 2,432,888 | $ | 154.48 | $ | 95.75 | $ | 116.09 | $ | 227.1 | $ | 406.1 | |||||||||||||||||||||||||||
| (1) | The amounts shown represent CAP to our Principal Executive Officer (“PEO”) and the average CAP to our remaining NEOs for the relevant fiscal year, as determined under SEC rules (and described below), which includes the individuals indicated in the table below for each fiscal year: |
YEAR |
PEO |
NON-PEO NEOS | ||
2024 |
Andrew C. Florance | Christian M. Lown, Scott Wheeler, Lisa C. Ruggles, Frederick G. Saint, and Frank A. Simuro | ||
2023 |
Andrew C. Florance | Scott T. Wheeler, Lisa C. Ruggles, Frederick G. Saint, and Frank A. Simuro | ||
2022 |
Andrew C. Florance | Scott T. Wheeler, Lisa C. Ruggles, Frederick G. Saint, and Frank A. Simuro | ||
2021 |
Andrew C. Florance | Scott T. Wheeler, Lisa C. Ruggles, and Frederick G. Saint | ||
2020 |
Andrew C. Florance | Scott T. Wheeler, Lisa C. Ruggles, Frederick G. Saint, and Matthew F.W. Linnington | ||
CAP to our NEOs represents the “Total” compensation
reported
in the Summary Compensation Table for the applicable fiscal year, as adjusted as follows: ADJUSTMENTS |
PEO | ||||||||||||||||||||||||
2024 |
2023 |
2022 |
2021 |
2020 | |||||||||||||||||||||
Deduction for Amounts Reported under the “Stock Awards” and “Option Awards” Columns in the 2024 Summary Compensation Table for Applicable Year |
-$ | 33,192,850 | -$ | 25,345,219 | -$ | 15,526,424 | -$ | 18,710,768 | -$ | 18,492,242 | |||||||||||||||
Increase based on ASC 718 Fair Value of Awards Granted during Applicable Year that Remain Unvested as of Applicable Year End, determined as of Applicable Year End |
$ | 22,403,392 | $ | 24,240,807 | $ | 18,416,210 | $ | 14,435,844 | $ | 20,330,911 | |||||||||||||||
Increase based on ASC 718 Fair Value of Awards Granted during Applicable Year that Vested during Applicable Year, determined as of Vesting Date |
$ | 0 | $ | 0 | $ | 3,551 | $ | 0 | $ | 0 | |||||||||||||||
Increase/deduction for Awards Granted during Prior Year(s) that were Outstanding and Unvested as of Applicable Year End, determined based on change in ASC 718 Fair Value from Prior Year End to Applicable Year End |
-$ | 13,423,536 | $ | 2,965,451 | $ | 756,384 | -$ | 3,584,582 | $ | 18,080,010 | |||||||||||||||
Increase/deduction for Awards Granted during Prior Year(s) that Vested During Applicable Year, determined based on change in ASC 718 Fair Value from Prior Year End to Vesting Date |
-$ | 4,960,176 | -$ | 2,414,259 | -$ | 6,890,122 | -$ | 2,873,898 | $ | 2,198,107 | |||||||||||||||
Total Adjustments |
-$ | 29,173,170 | -$ | 553,220 | -$ | 3,240,401 | -$ | 10,733,404 | $ | 22,116,786 | |||||||||||||||
ADJUSTMENTS |
AVERAGE NON-PEO NEOS | ||||||||||||||||||||||||
2024 |
2023 |
2022 |
2021 |
2020 | |||||||||||||||||||||
Deduction for Amounts Reported under the “Stock Awards” and “Option Awards” Columns in the 2024 Summary Compensation Table for Applicable Year |
-$ | 5,320,293 | -$ | 5,755,090 | -$ | 4,293,321 | -$ | 5,277,307 | -$ | 4,670,083 | |||||||||||||||
Increase based on ASC 718 Fair Value of Awards Granted during Applicable Year that Remain Unvested as of Applicable Year End, determined as of Applicable Year End |
$ | 4,751,991 | $ | 5,567,668 | $ | 4,567,643 | $ | 3,840,076 | $ | 3,667,266 | |||||||||||||||
Increase based on ASC 718 Fair Value of Awards Granted during Applicable Year that Vested during Applicable Year, determined as of Vesting Date |
$ | 0 | $ | 0 | $ | 0 | $ | 301 | $ | 530 | |||||||||||||||
Increase/deduction for Awards Granted during Prior Year(s) that were Outstanding and Unvested as of Applicable Year End, determined based on change in ASC 718 Fair Value from Prior Year End to Applicable Year End |
-$ | 1,899,128 | $ | 738,930 | $ | 183,671 | -$ | 849,736 | $ | 3,382,952 | |||||||||||||||
Increase/deduction for Awards Granted during Prior Year(s) that Vested During Applicable Year, determined based on change in ASC 718 Fair Value from Prior Year End to Vesting Date |
-$ | 463,526 | -$ | 424,990 | -$ | 1,507,603 | -$ | 822,658 | $ | 573,190 | |||||||||||||||
Deduction of ASC 718 Fair Value of Awards Granted during Prior Year(s) that were Forfeited during Applicable Year, determined as of Prior Year End |
-$ | 2,443,522 | $ | 0 | $ | 0 | $ | 0 | -$ | 5,870,328 | |||||||||||||||
Total Adjustments |
-$ | 5,374,478 | $ | 126,518 | -$ | 1,049,610 | -$ | 3,109,324 | -$ | 2,916,473 | |||||||||||||||
| (2) | Pursuant to SEC rules, the TSR amounts assume an initial investment of $100 on December 31, 2019. As permitted by SEC rules, the peer group referenced for purposes of the TSR comparison is the group of companies included in the S&P Composite 1500 Real Estate Index, which is the industry peer group used for purposes of Item 201(e) of Regulation S-K. The Company changed its peer group in its 2024 Form 10-K as it believes the S&P Composite 1500 Real Estate Index provides a more accurate, diverse, and useful measure to the Company’s performance. The separate peer group used by the Compensation Committee for purposes of determining compensation paid to our executive officers is described in the “Determining Executive Compensation” section of this Proxy Statement. |
| (3) | The peer group referenced for purposes of the TSR comparison is the group of companies included in the S&P 500 Internet Services and Infrastructure Index. |
| (1) | The amounts shown represent CAP to our Principal Executive Officer (“PEO”) and the average CAP to our remaining NEOs for the relevant fiscal year, as determined under SEC rules (and described below), which includes the individuals indicated in the table below for each fiscal year: |
YEAR |
PEO |
NON-PEO NEOS | ||
2024 |
Andrew C. Florance | Christian M. Lown, Scott Wheeler, Lisa C. Ruggles, Frederick G. Saint, and Frank A. Simuro | ||
2023 |
Andrew C. Florance | Scott T. Wheeler, Lisa C. Ruggles, Frederick G. Saint, and Frank A. Simuro | ||
2022 |
Andrew C. Florance | Scott T. Wheeler, Lisa C. Ruggles, Frederick G. Saint, and Frank A. Simuro | ||
2021 |
Andrew C. Florance | Scott T. Wheeler, Lisa C. Ruggles, and Frederick G. Saint | ||
2020 |
Andrew C. Florance | Scott T. Wheeler, Lisa C. Ruggles, Frederick G. Saint, and Matthew F.W. Linnington | ||
| (2) | Pursuant to SEC rules, the TSR amounts assume an initial investment of $100 on December 31, 2019. As permitted by SEC rules, the peer group referenced for purposes of the TSR comparison is the group of companies included in the S&P Composite 1500 Real Estate Index, which is the industry peer group used for purposes of Item 201(e) of Regulation S-K. The Company changed its peer group in its 2024 Form 10-K as it believes the S&P Composite 1500 Real Estate Index provides a more accurate, diverse, and useful measure to the Company’s performance. The separate peer group used by the Compensation Committee for purposes of determining compensation paid to our executive officers is described in the “Determining Executive Compensation” section of this Proxy Statement. |
| (3) | The peer group referenced for purposes of the TSR comparison is the group of companies included in the S&P 500 Internet Services and Infrastructure Index. |
ADJUSTMENTS |
PEO | ||||||||||||||||||||||||
2024 |
2023 |
2022 |
2021 |
2020 | |||||||||||||||||||||
Deduction for Amounts Reported under the “Stock Awards” and “Option Awards” Columns in the 2024 Summary Compensation Table for Applicable Year |
-$ | 33,192,850 | -$ | 25,345,219 | -$ | 15,526,424 | -$ | 18,710,768 | -$ | 18,492,242 | |||||||||||||||
Increase based on ASC 718 Fair Value of Awards Granted during Applicable Year that Remain Unvested as of Applicable Year End, determined as of Applicable Year End |
$ | 22,403,392 | $ | 24,240,807 | $ | 18,416,210 | $ | 14,435,844 | $ | 20,330,911 | |||||||||||||||
Increase based on ASC 718 Fair Value of Awards Granted during Applicable Year that Vested during Applicable Year, determined as of Vesting Date |
$ | 0 | $ | 0 | $ | 3,551 | $ | 0 | $ | 0 | |||||||||||||||
Increase/deduction for Awards Granted during Prior Year(s) that were Outstanding and Unvested as of Applicable Year End, determined based on change in ASC 718 Fair Value from Prior Year End to Applicable Year End |
-$ | 13,423,536 | $ | 2,965,451 | $ | 756,384 | -$ | 3,584,582 | $ | 18,080,010 | |||||||||||||||
Increase/deduction for Awards Granted during Prior Year(s) that Vested During Applicable Year, determined based on change in ASC 718 Fair Value from Prior Year End to Vesting Date |
-$ | 4,960,176 | -$ | 2,414,259 | -$ | 6,890,122 | -$ | 2,873,898 | $ | 2,198,107 | |||||||||||||||
Total Adjustments |
-$ | 29,173,170 | -$ | 553,220 | -$ | 3,240,401 | -$ | 10,733,404 | $ | 22,116,786 | |||||||||||||||
ADJUSTMENTS |
AVERAGE NON-PEO NEOS | ||||||||||||||||||||||||
2024 |
2023 |
2022 |
2021 |
2020 | |||||||||||||||||||||
Deduction for Amounts Reported under the “Stock Awards” and “Option Awards” Columns in the 2024 Summary Compensation Table for Applicable Year |
-$ | 5,320,293 | -$ | 5,755,090 | -$ | 4,293,321 | -$ | 5,277,307 | -$ | 4,670,083 | |||||||||||||||
Increase based on ASC 718 Fair Value of Awards Granted during Applicable Year that Remain Unvested as of Applicable Year End, determined as of Applicable Year End |
$ | 4,751,991 | $ | 5,567,668 | $ | 4,567,643 | $ | 3,840,076 | $ | 3,667,266 | |||||||||||||||
Increase based on ASC 718 Fair Value of Awards Granted during Applicable Year that Vested during Applicable Year, determined as of Vesting Date |
$ | 0 | $ | 0 | $ | 0 | $ | 301 | $ | 530 | |||||||||||||||
Increase/deduction for Awards Granted during Prior Year(s) that were Outstanding and Unvested as of Applicable Year End, determined based on change in ASC 718 Fair Value from Prior Year End to Applicable Year End |
-$ | 1,899,128 | $ | 738,930 | $ | 183,671 | -$ | 849,736 | $ | 3,382,952 | |||||||||||||||
Increase/deduction for Awards Granted during Prior Year(s) that Vested During Applicable Year, determined based on change in ASC 718 Fair Value from Prior Year End to Vesting Date |
-$ | 463,526 | -$ | 424,990 | -$ | 1,507,603 | -$ | 822,658 | $ | 573,190 | |||||||||||||||
Deduction of ASC 718 Fair Value of Awards Granted during Prior Year(s) that were Forfeited during Applicable Year, determined as of Prior Year End |
-$ | 2,443,522 | $ | 0 | $ | 0 | $ | 0 | -$ | 5,870,328 | |||||||||||||||
Total Adjustments |
-$ | 5,374,478 | $ | 126,518 | -$ | 1,049,610 | -$ | 3,109,324 | -$ | 2,916,473 | |||||||||||||||
Pay Versus Performance Tabular List
We believe the following performance measures represent the most important financial performance measures used by us to link compensation actually paid to our NEOs for the fiscal year ended December 31, 2024:
| (1) | Revenue; |
| (2) | EBITDA; |
| (3) | Relative TSR; and |
| (4) | Net Income. |