| First Quarter | |||||||||||
| ($ in billions except profit per share) | 2025 | 2024 | |||||||||
| Sales and Revenues | $14.2 | $15.8 | |||||||||
| Profit Per Share | $4.20 | $5.75 | |||||||||
| Adjusted Profit Per Share | $4.25 | $5.60 | |||||||||
Please see a reconciliation of GAAP to non-GAAP financial measures in the appendix on pages 12 and 13. | |||||||||||
| ● | First-quarter 2025 profit per share of $4.20; adjusted profit per share of $4.25 | ||||
| ● | Enterprise operating cash flow was $1.3 billion in the first quarter of 2025 | ||||
| ● | Deployed $4.3 billion of cash for share repurchases and dividends in the first quarter | ||||
| Sales and Revenues by Segment | |||||||||||||||||||||||||||||||||||||||||||||||
| (Millions of dollars) | First Quarter 2024 | Sales Volume | Price Realization | Currency | Inter-Segment / Other | First Quarter 2025 | $ Change | % Change | |||||||||||||||||||||||||||||||||||||||
| Construction Industries | $ | 6,424 | $ | (820) | $ | (355) | $ | (98) | $ | 33 | $ | 5,184 | $ | (1,240) | (19%) | ||||||||||||||||||||||||||||||||
| Resource Industries | 3,193 | (179) | (50) | (46) | (34) | 2,884 | (309) | (10%) | |||||||||||||||||||||||||||||||||||||||
| Energy & Transportation | 6,681 | (175) | 155 | (69) | (24) | 6,568 | (113) | (2%) | |||||||||||||||||||||||||||||||||||||||
| All Other Segment | 109 | (2) | — | (1) | (15) | 91 | (18) | (17%) | |||||||||||||||||||||||||||||||||||||||
| Corporate Items and Eliminations | (1,447) | 66 | — | (8) | 40 | (1,349) | 98 | ||||||||||||||||||||||||||||||||||||||||
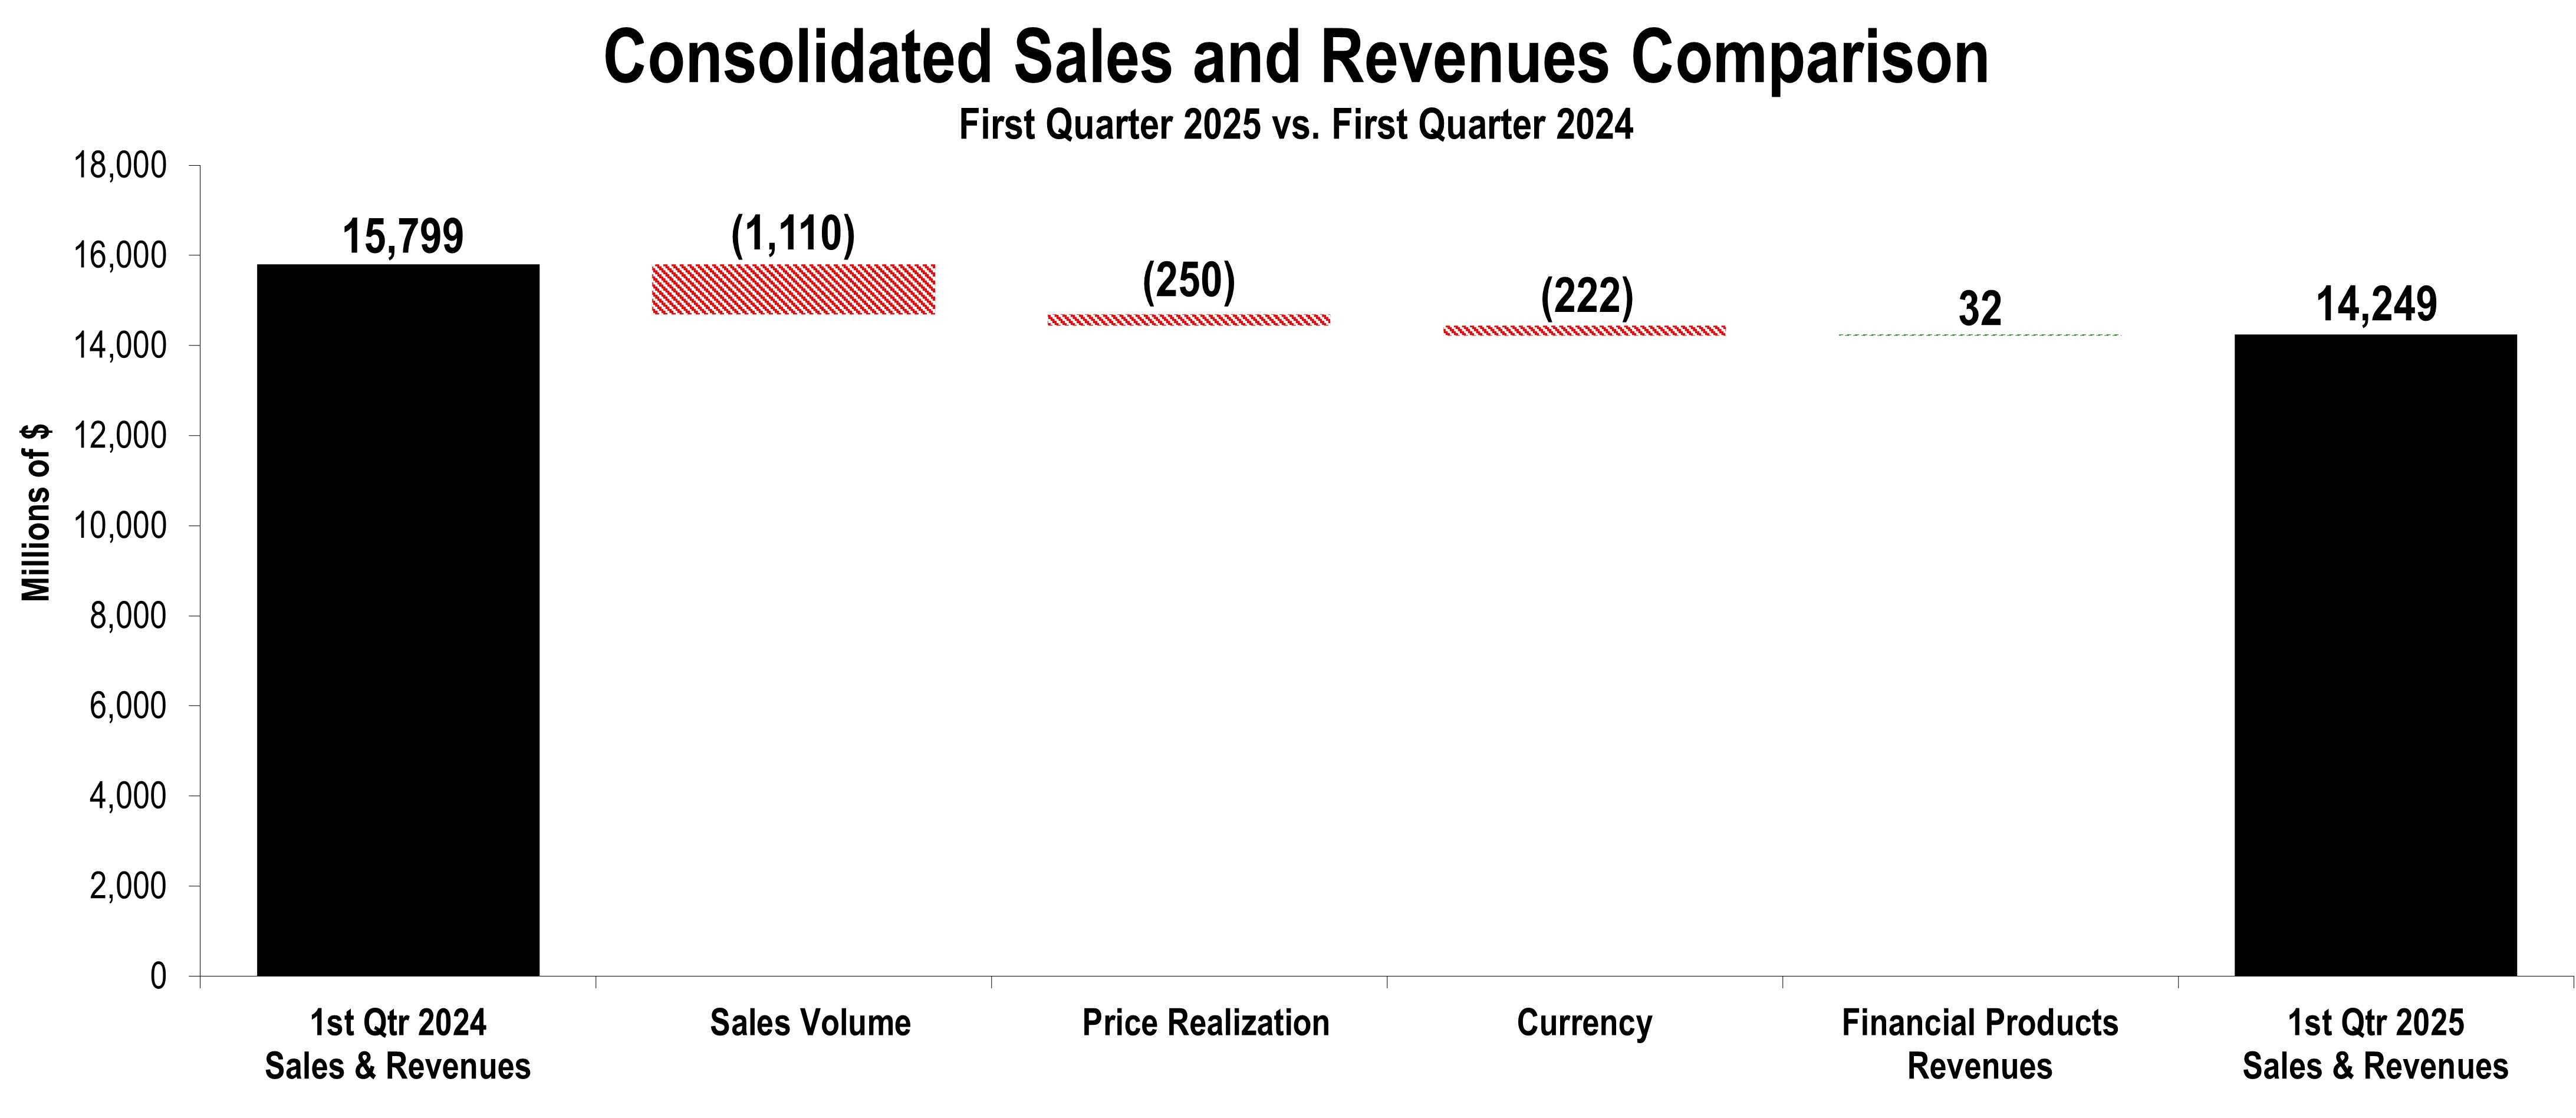
| Machinery, Energy & Transportation | 14,960 | (1,110) | (250) | (222) | — | 13,378 | (1,582) | (11%) | |||||||||||||||||||||||||||||||||||||||
| Financial Products Segment | 991 | — | — | — | 16 | 1,007 | 16 | 2% | |||||||||||||||||||||||||||||||||||||||
| Corporate Items and Eliminations | (152) | — | — | — | 16 | (136) | 16 | ||||||||||||||||||||||||||||||||||||||||
| Financial Products Revenues | 839 | — | — | — | 32 | 871 | 32 | 4% | |||||||||||||||||||||||||||||||||||||||
| Consolidated Sales and Revenues | $ | 15,799 | $ | (1,110) | $ | (250) | $ | (222) | $ | 32 | $ | 14,249 | $ | (1,550) | (10%) | ||||||||||||||||||||||||||||||||
| Sales and Revenues by Geographic Region | |||||||||||||||||||||||||||||||||||||||||||||||||||||||||||||||||||||||||||||||||||
| North America | Latin America | EAME | Asia/Pacific | External Sales and Revenues | Inter-Segment | Total Sales and Revenues | |||||||||||||||||||||||||||||||||||||||||||||||||||||||||||||||||||||||||||||
| (Millions of dollars) | $ | % Chg | $ | % Chg | $ | % Chg | $ | % Chg | $ | % Chg | $ | % Chg | $ | % Chg | |||||||||||||||||||||||||||||||||||||||||||||||||||||||||||||||||||||
| First Quarter 2025 | |||||||||||||||||||||||||||||||||||||||||||||||||||||||||||||||||||||||||||||||||||
| Construction Industries | $ | 2,904 | (24%) | $ | 504 | (15%) | $ | 867 | (13%) | $ | 869 | (12%) | $ | 5,144 | (20%) | $ | 40 | 471% | $ | 5,184 | (19%) | ||||||||||||||||||||||||||||||||||||||||||||||||||||||||||||||
| Resource Industries | 1,084 | (14%) | 561 | 18% | 406 | (13%) | 770 | (14%) | 2,821 | (9%) | 63 | (35%) | 2,884 | (10%) | |||||||||||||||||||||||||||||||||||||||||||||||||||||||||||||||||||||
| Energy & Transportation | 3,142 | 6% | 370 | (9%) | 1,130 | (13%) | 756 | (9%) | 5,398 | (2%) | 1,170 | (2%) | 6,568 | (2%) | |||||||||||||||||||||||||||||||||||||||||||||||||||||||||||||||||||||
| All Other Segment | 17 | (6%) | — | 100% | 2 | (50%) | 12 | (8%) | 31 | (9%) | 60 | (20%) | 91 | (17%) | |||||||||||||||||||||||||||||||||||||||||||||||||||||||||||||||||||||
| Corporate Items and Eliminations | (11) | — | (2) | (3) | (16) | (1,333) | (1,349) | ||||||||||||||||||||||||||||||||||||||||||||||||||||||||||||||||||||||||||||
| Machinery, Energy & Transportation | 7,136 | (11%) | 1,435 | (3%) | 2,403 | (13%) | 2,404 | (12%) | 13,378 | (11%) | — | —% | 13,378 | (11%) | |||||||||||||||||||||||||||||||||||||||||||||||||||||||||||||||||||||
| Financial Products Segment | 682 | 3% | 99 | (2%) | 122 | (1%) | 104 | (4%) | 1,007 | 2% | — | —% | 1,007 | 2% | |||||||||||||||||||||||||||||||||||||||||||||||||||||||||||||||||||||
| Corporate Items and Eliminations | (80) | (19) | (19) | (18) | (136) | — | (136) | ||||||||||||||||||||||||||||||||||||||||||||||||||||||||||||||||||||||||||||
| Financial Products Revenues | 602 | 7% | 80 | (4%) | 103 | (1%) | 86 | (1%) | 871 | 4% | — | —% | 871 | 4% | |||||||||||||||||||||||||||||||||||||||||||||||||||||||||||||||||||||
| Consolidated Sales and Revenues | $ | 7,738 | (10%) | $ | 1,515 | (3%) | $ | 2,506 | (12%) | $ | 2,490 | (12%) | $ | 14,249 | (10%) | $ | — | —% | $ | 14,249 | (10%) | ||||||||||||||||||||||||||||||||||||||||||||||||||||||||||||||
| First Quarter 2024 | |||||||||||||||||||||||||||||||||||||||||||||||||||||||||||||||||||||||||||||||||||
| Construction Industries | $ | 3,833 | $ | 595 | $ | 996 | $ | 993 | $ | 6,417 | $ | 7 | $ | 6,424 | |||||||||||||||||||||||||||||||||||||||||||||||||||||||||||||||||||||
| Resource Industries | 1,264 | 476 | 465 | 891 | 3,096 | 97 | 3,193 | ||||||||||||||||||||||||||||||||||||||||||||||||||||||||||||||||||||||||||||
| Energy & Transportation | 2,951 | 408 | 1,294 | 834 | 5,487 | 1,194 | 6,681 | ||||||||||||||||||||||||||||||||||||||||||||||||||||||||||||||||||||||||||||
| All Other Segment | 18 | (1) | 4 | 13 | 34 | 75 | 109 | ||||||||||||||||||||||||||||||||||||||||||||||||||||||||||||||||||||||||||||
| Corporate Items and Eliminations | (58) | (2) | (11) | (3) | (74) | (1,373) | (1,447) | ||||||||||||||||||||||||||||||||||||||||||||||||||||||||||||||||||||||||||||
| Machinery, Energy & Transportation | 8,008 | 1,476 | 2,748 | 2,728 | 14,960 | — | 14,960 | ||||||||||||||||||||||||||||||||||||||||||||||||||||||||||||||||||||||||||||
| Financial Products Segment | 659 | 101 | 123 | 108 | 991 | — | 991 | ||||||||||||||||||||||||||||||||||||||||||||||||||||||||||||||||||||||||||||
| Corporate Items and Eliminations | (94) | (18) | (19) | (21) | (152) | — | (152) | ||||||||||||||||||||||||||||||||||||||||||||||||||||||||||||||||||||||||||||
| Financial Products Revenues | 565 | 83 | 104 | 87 | 839 | — | 839 | ||||||||||||||||||||||||||||||||||||||||||||||||||||||||||||||||||||||||||||
| Consolidated Sales and Revenues | $ | 8,573 | $ | 1,559 | $ | 2,852 | $ | 2,815 | $ | 15,799 | $ | — | $ | 15,799 | |||||||||||||||||||||||||||||||||||||||||||||||||||||||||||||||||||||
| Profit (Loss) by Segment | |||||||||||||||||||||||
| (Millions of dollars) | First Quarter 2025 | First Quarter 2024 | $ Change | % Change | |||||||||||||||||||
| Construction Industries | $ | 1,024 | $ | 1,764 | $ | (740) | (42 | %) | |||||||||||||||
| Resource Industries | 599 | 730 | (131) | (18 | %) | ||||||||||||||||||
| Energy & Transportation | 1,314 | 1,301 | 13 | 1 | % | ||||||||||||||||||
| All Other Segment | (21) | 24 | (45) | (188 | %) | ||||||||||||||||||
| Corporate Items and Eliminations | (401) | (415) | 14 | ||||||||||||||||||||
| Machinery, Energy & Transportation | 2,515 | 3,404 | (889) | (26 | %) | ||||||||||||||||||
| Financial Products Segment | 215 | 293 | (78) | (27 | %) | ||||||||||||||||||
| Corporate Items and Eliminations | (14) | (25) | 11 | ||||||||||||||||||||
| Financial Products | 201 | 268 | (67) | (25 | %) | ||||||||||||||||||
| Consolidating Adjustments | (137) | (153) | 16 | ||||||||||||||||||||
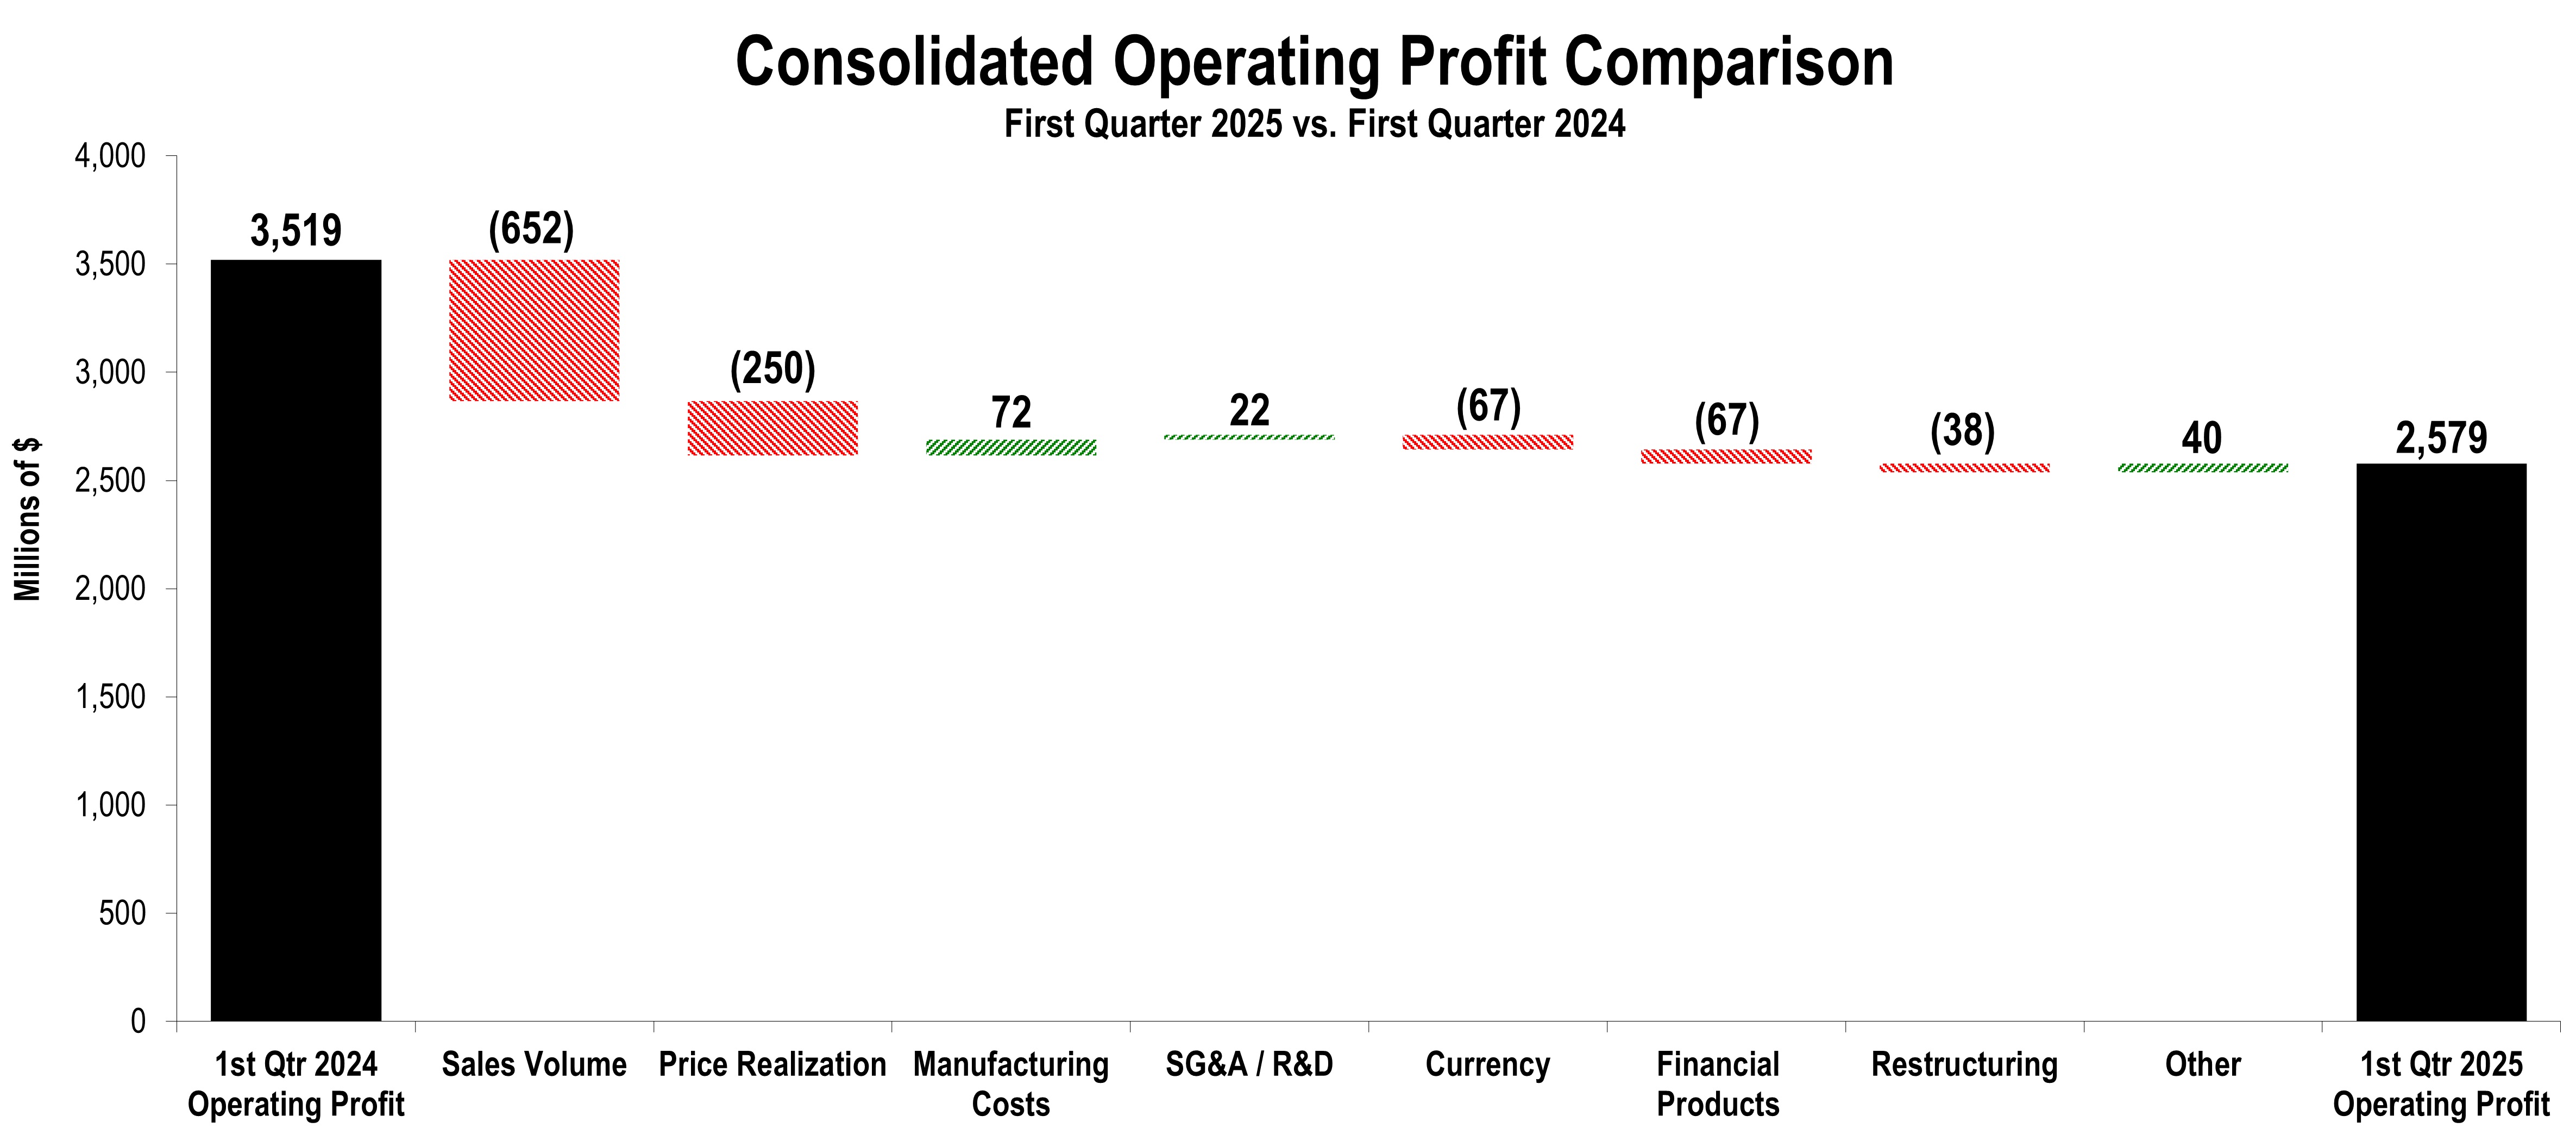
| Consolidated Operating Profit | $ | 2,579 | $ | 3,519 | $ | (940) | (27 | %) | |||||||||||||||
| CONSTRUCTION INDUSTRIES | ||||||||||||||||||||||||||||||||||||||||||||||||||
| (Millions of dollars) | ||||||||||||||||||||||||||||||||||||||||||||||||||
| Segment Sales | ||||||||||||||||||||||||||||||||||||||||||||||||||
| First Quarter 2024 | Sales Volume | Price Realization | Currency | Inter-Segment | First Quarter 2025 | $ Change | % Change | |||||||||||||||||||||||||||||||||||||||||||
| Total Sales | $ | 6,424 | $ | (820) | $ | (355) | $ | (98) | $ | 33 | $ | 5,184 | $ | (1,240) | (19 | %) | ||||||||||||||||||||||||||||||||||
| Sales by Geographic Region | ||||||||||||||||||||||||||||||||||||||||||||||||||
| First Quarter 2025 | First Quarter 2024 | $ Change | % Change | |||||||||||||||||||||||||||||||||||||||||||||||
| North America | $ | 2,904 | $ | 3,833 | $ | (929) | (24 | %) | ||||||||||||||||||||||||||||||||||||||||||
| Latin America | 504 | 595 | (91) | (15 | %) | |||||||||||||||||||||||||||||||||||||||||||||
| EAME | 867 | 996 | (129) | (13 | %) | |||||||||||||||||||||||||||||||||||||||||||||
| Asia/Pacific | 869 | 993 | (124) | (12 | %) | |||||||||||||||||||||||||||||||||||||||||||||
| External Sales | 5,144 | 6,417 | (1,273) | (20 | %) | |||||||||||||||||||||||||||||||||||||||||||||
| Inter-segment | 40 | 7 | 33 | 471 | % | |||||||||||||||||||||||||||||||||||||||||||||
| Total Sales | $ | 5,184 | $ | 6,424 | $ | (1,240) | (19 | %) | ||||||||||||||||||||||||||||||||||||||||||
| Segment Profit | ||||||||||||||||||||||||||||||||||||||||||||||||||
| First Quarter 2025 | First Quarter 2024 | Change | % Change | |||||||||||||||||||||||||||||||||||||||||||||||
| Segment Profit | $ | 1,024 | $ | 1,764 | $ | (740) | (42 | %) | ||||||||||||||||||||||||||||||||||||||||||
| Segment Profit Margin | 19.8 | % | 27.5 | % | (7.7 | pts) | ||||||||||||||||||||||||||||||||||||||||||||
| RESOURCE INDUSTRIES | ||||||||||||||||||||||||||||||||||||||||||||||||||
| (Millions of dollars) | ||||||||||||||||||||||||||||||||||||||||||||||||||
| Segment Sales | ||||||||||||||||||||||||||||||||||||||||||||||||||
| First Quarter 2024 | Sales Volume | Price Realization | Currency | Inter-Segment | First Quarter 2025 | $ Change | % Change | |||||||||||||||||||||||||||||||||||||||||||
| Total Sales | $ | 3,193 | $ | (179) | $ | (50) | $ | (46) | $ | (34) | $ | 2,884 | $ | (309) | (10 | %) | ||||||||||||||||||||||||||||||||||
| Sales by Geographic Region | ||||||||||||||||||||||||||||||||||||||||||||||||||
| First Quarter 2025 | First Quarter 2024 | $ Change | % Change | |||||||||||||||||||||||||||||||||||||||||||||||
| North America | $ | 1,084 | $ | 1,264 | $ | (180) | (14 | %) | ||||||||||||||||||||||||||||||||||||||||||
| Latin America | 561 | 476 | 85 | 18 | % | |||||||||||||||||||||||||||||||||||||||||||||
| EAME | 406 | 465 | (59) | (13 | %) | |||||||||||||||||||||||||||||||||||||||||||||
| Asia/Pacific | 770 | 891 | (121) | (14 | %) | |||||||||||||||||||||||||||||||||||||||||||||
| External Sales | 2,821 | 3,096 | (275) | (9 | %) | |||||||||||||||||||||||||||||||||||||||||||||
| Inter-segment | 63 | 97 | (34) | (35 | %) | |||||||||||||||||||||||||||||||||||||||||||||
| Total Sales | $ | 2,884 | $ | 3,193 | $ | (309) | (10 | %) | ||||||||||||||||||||||||||||||||||||||||||
| Segment Profit | ||||||||||||||||||||||||||||||||||||||||||||||||||
| First Quarter 2025 | First Quarter 2024 | Change | % Change | |||||||||||||||||||||||||||||||||||||||||||||||
| Segment Profit | $ | 599 | $ | 730 | $ | (131) | (18 | %) | ||||||||||||||||||||||||||||||||||||||||||
| Segment Profit Margin | 20.8 | % | 22.9 | % | (2.1 | pts) | ||||||||||||||||||||||||||||||||||||||||||||
| ENERGY & TRANSPORTATION | ||||||||||||||||||||||||||||||||||||||||||||||||||
| (Millions of dollars) | ||||||||||||||||||||||||||||||||||||||||||||||||||
| Segment Sales | ||||||||||||||||||||||||||||||||||||||||||||||||||
| First Quarter 2024 | Sales Volume | Price Realization | Currency | Inter-Segment | First Quarter 2025 | $ Change | % Change | |||||||||||||||||||||||||||||||||||||||||||
| Total Sales | $ | 6,681 | $ | (175) | $ | 155 | $ | (69) | $ | (24) | $ | 6,568 | $ | (113) | (2 | %) | ||||||||||||||||||||||||||||||||||
| Sales by Application | ||||||||||||||||||||||||||||||||||||||||||||||||||
| First Quarter 2025 | First Quarter 2024 | $ Change | % Change | |||||||||||||||||||||||||||||||||||||||||||||||
| Oil and Gas | $ | 1,258 | $ | 1,568 | $ | (310) | (20 | %) | ||||||||||||||||||||||||||||||||||||||||||
| Power Generation | 1,996 | 1,618 | 378 | 23 | % | |||||||||||||||||||||||||||||||||||||||||||||
| Industrial | 967 | 989 | (22) | (2 | %) | |||||||||||||||||||||||||||||||||||||||||||||
| Transportation | 1,177 | 1,312 | (135) | (10 | %) | |||||||||||||||||||||||||||||||||||||||||||||
| External Sales | 5,398 | 5,487 | (89) | (2 | %) | |||||||||||||||||||||||||||||||||||||||||||||
| Inter-segment | 1,170 | 1,194 | (24) | (2 | %) | |||||||||||||||||||||||||||||||||||||||||||||
| Total Sales | $ | 6,568 | $ | 6,681 | $ | (113) | (2 | %) | ||||||||||||||||||||||||||||||||||||||||||
| Segment Profit | ||||||||||||||||||||||||||||||||||||||||||||||||||
| First Quarter 2025 | First Quarter 2024 | Change | % Change | |||||||||||||||||||||||||||||||||||||||||||||||
| Segment Profit | $ | 1,314 | $ | 1,301 | $ | 13 | 1 | % | ||||||||||||||||||||||||||||||||||||||||||
| Segment Profit Margin | 20.0 | % | 19.5 | % | 0.5 | pts | ||||||||||||||||||||||||||||||||||||||||||||
| FINANCIAL PRODUCTS SEGMENT | ||||||||||||||||||||||||||||||||||||||||||||||||||
| (Millions of dollars) | ||||||||||||||||||||||||||||||||||||||||||||||||||
| Revenues by Geographic Region | ||||||||||||||||||||||||||||||||||||||||||||||||||
| First Quarter 2025 | First Quarter 2024 | $ Change | % Change | |||||||||||||||||||||||||||||||||||||||||||||||
| North America | $ | 682 | $ | 659 | $ | 23 | 3 | % | ||||||||||||||||||||||||||||||||||||||||||
| Latin America | 99 | 101 | (2) | (2 | %) | |||||||||||||||||||||||||||||||||||||||||||||
| EAME | 122 | 123 | (1) | (1 | %) | |||||||||||||||||||||||||||||||||||||||||||||
| Asia/Pacific | 104 | 108 | (4) | (4 | %) | |||||||||||||||||||||||||||||||||||||||||||||
| Total Revenues | $ | 1,007 | $ | 991 | $ | 16 | 2 | % | ||||||||||||||||||||||||||||||||||||||||||
| Segment Profit | ||||||||||||||||||||||||||||||||||||||||||||||||||
| First Quarter 2025 | First Quarter 2024 | Change | % Change | |||||||||||||||||||||||||||||||||||||||||||||||
| Segment Profit | $ | 215 | $ | 293 | $ | (78) | (27 | %) | ||||||||||||||||||||||||||||||||||||||||||
| (Dollars in millions except per share data) | Operating Profit | Operating Profit Margin | Profit Before Taxes | Provision (Benefit) for Income Taxes | Profit | Profit per Share | |||||||||||||||||||||||||||||||||||
Three Months Ended March 31, 2025 - U.S. GAAP | $ | 2,579 | 18.1 | % | $ | 2,570 | $ | 574 | $ | 2,003 | $ | 4.20 | |||||||||||||||||||||||||||||
| Other restructuring (income) costs | 32 | 0.2 | % | 33 | 8 | 25 | 0.05 | ||||||||||||||||||||||||||||||||||
Three Months Ended March 31, 2025 - Adjusted | $ | 2,611 | 18.3 | % | $ | 2,603 | $ | 582 | $ | 2,028 | $ | 4.25 | |||||||||||||||||||||||||||||
Three Months Ended March 31, 2024 - U.S. GAAP | $ | 3,519 | 22.3 | % | $ | 3,532 | $ | 688 | $ | 2,856 | $ | 5.75 | |||||||||||||||||||||||||||||
| Restructuring (income) - non-US mining entity divestiture | (64) | (0.5) | % | (64) | 54 | (118) | (0.24) | ||||||||||||||||||||||||||||||||||
| Other restructuring (income) costs | 58 | 0.4 | % | 58 | 14 | 44 | 0.09 | ||||||||||||||||||||||||||||||||||
Three Months Ended March 31, 2024 - Adjusted | $ | 3,513 | 22.2 | % | $ | 3,526 | $ | 756 | $ | 2,782 | $ | 5.60 | |||||||||||||||||||||||||||||
| (Dollars in millions) | Profit Before Taxes | Provision (Benefit) for Income Taxes | Effective Tax Rate | |||||||||||||||||
Three Months Ended March 31, 2025 - U.S. GAAP | $ | 2,570 | $ | 574 | 22.3 | % | ||||||||||||||
| Excess stock-based compensation | — | 17 | ||||||||||||||||||
| Annual effective tax rate, excluding discrete items | $ | 2,570 | $ | 591 | 23.0 | % | ||||||||||||||
| Excess stock-based compensation | — | (17) | ||||||||||||||||||
| Other restructuring (income) costs | 33 | 8 | ||||||||||||||||||
Three Months Ended March 31, 2025 - Adjusted | $ | 2,603 | $ | 582 | ||||||||||||||||
Three Months Ended March 31, 2024 - U.S. GAAP | $ | 3,532 | $ | 688 | 19.5 | % | ||||||||||||||
| Restructuring (income) - non-US mining entity divestiture | (64) | 54 | ||||||||||||||||||
| Excess stock-based compensation | — | 38 | ||||||||||||||||||
| Annual effective tax rate, excluding discrete items | $ | 3,468 | $ | 780 | 22.5 | % | ||||||||||||||
| Excess stock-based compensation | — | (38) | ||||||||||||||||||
| Other restructuring (income) costs | 58 | 14 | ||||||||||||||||||
Three Months Ended March 31, 2024 - Adjusted | $ | 3,526 | $ | 756 | ||||||||||||||||
| Three Months Ended March 31, | |||||||||||
| 2025 | 2024 | ||||||||||
| Sales and revenues: | |||||||||||
| Sales of Machinery, Energy & Transportation | $ | 13,378 | $ | 14,960 | |||||||
| Revenues of Financial Products | 871 | 839 | |||||||||
| Total sales and revenues | 14,249 | 15,799 | |||||||||
| Operating costs: | |||||||||||
| Cost of goods sold | 8,965 | 9,662 | |||||||||
| Selling, general and administrative expenses | 1,593 | 1,577 | |||||||||
| Research and development expenses | 480 | 520 | |||||||||
| Interest expense of Financial Products | 326 | 298 | |||||||||
| Other operating (income) expenses | 306 | 223 | |||||||||
| Total operating costs | 11,670 | 12,280 | |||||||||
| Operating profit | 2,579 | 3,519 | |||||||||
| Interest expense excluding Financial Products | 116 | 143 | |||||||||
| Other income (expense) | 107 | 156 | |||||||||
| Consolidated profit before taxes | 2,570 | 3,532 | |||||||||
| Provision (benefit) for income taxes | 574 | 688 | |||||||||
| Profit of consolidated companies | 1,996 | 2,844 | |||||||||
| Equity in profit (loss) of unconsolidated affiliated companies | 7 | 10 | |||||||||
| Profit of consolidated and affiliated companies | 2,003 | 2,854 | |||||||||
| Less: Profit (loss) attributable to noncontrolling interests | — | (2) | |||||||||
Profit 1 | $ | 2,003 | $ | 2,856 | |||||||
| Profit per common share | $ | 4.22 | $ | 5.78 | |||||||
Profit per common share — diluted 2 | $ | 4.20 | $ | 5.75 | |||||||
| Weighted-average common shares outstanding (millions) | |||||||||||
| – Basic | 474.9 | 493.9 | |||||||||
– Diluted 2 | 477.1 | 496.9 | |||||||||
| 1 | Profit attributable to common shareholders. | ||||
| 2 | Diluted by assumed exercise of stock-based compensation awards using the treasury stock method. | ||||
| March 31, 2025 | December 31, 2024 | ||||||||||
| Assets | |||||||||||
| Current assets: | |||||||||||
| Cash and cash equivalents | $ | 3,562 | $ | 6,889 | |||||||
| Receivables – trade and other | 9,116 | 9,282 | |||||||||
| Receivables – finance | 9,655 | 9,565 | |||||||||
| Prepaid expenses and other current assets | 2,824 | 3,119 | |||||||||
| Inventories | 17,862 | 16,827 | |||||||||
| Total current assets | 43,019 | 45,682 | |||||||||
| Property, plant and equipment – net | 13,432 | 13,361 | |||||||||
| Long-term receivables – trade and other | 1,261 | 1,225 | |||||||||
| Long-term receivables – finance | 13,452 | 13,242 | |||||||||
| Noncurrent deferred and refundable income taxes | 3,334 | 3,312 | |||||||||
| Intangible assets | 361 | 399 | |||||||||
| Goodwill | 5,270 | 5,241 | |||||||||
| Other assets | 4,845 | 5,302 | |||||||||
| Total assets | $ | 84,974 | $ | 87,764 | |||||||
| Liabilities | |||||||||||
| Current liabilities: | |||||||||||
| Short-term borrowings: | |||||||||||
| -- Financial Products | $ | 3,454 | $ | 4,393 | |||||||
| Accounts payable | 7,792 | 7,675 | |||||||||
| Accrued expenses | 4,990 | 5,243 | |||||||||
| Accrued wages, salaries and employee benefits | 1,259 | 2,391 | |||||||||
| Customer advances | 2,951 | 2,322 | |||||||||
| Dividends payable | — | 674 | |||||||||
| Other current liabilities | 2,834 | 2,909 | |||||||||
| Long-term debt due within one year: | |||||||||||
| -- Machinery, Energy & Transportation | 29 | 46 | |||||||||
| -- Financial Products | 9,286 | 6,619 | |||||||||
| Total current liabilities | 32,595 | 32,272 | |||||||||
| Long-term debt due after one year: | |||||||||||
| -- Machinery, Energy & Transportation | 8,618 | 8,564 | |||||||||
| -- Financial Products | 17,201 | 18,787 | |||||||||
| Liability for postemployment benefits | 3,575 | 3,757 | |||||||||
| Other liabilities | 4,915 | 4,890 | |||||||||
| Total liabilities | 66,904 | 68,270 | |||||||||
| Shareholders’ equity | |||||||||||
| Common stock | 6,043 | 6,941 | |||||||||
| Treasury stock | (47,127) | (44,331) | |||||||||
| Profit employed in the business | 61,356 | 59,352 | |||||||||
| Accumulated other comprehensive income (loss) | (2,205) | (2,471) | |||||||||
| Noncontrolling interests | 3 | 3 | |||||||||
| Total shareholders’ equity | 18,070 | 19,494 | |||||||||
| Total liabilities and shareholders’ equity | $ | 84,974 | $ | 87,764 | |||||||
| Three Months Ended March 31, | |||||||||||
| 2025 | 2024 | ||||||||||
| Cash flow from operating activities: | |||||||||||
| Profit of consolidated and affiliated companies | $ | 2,003 | $ | 2,854 | |||||||
| Adjustments to reconcile profit to net cash provided by operating activities: | |||||||||||
| Depreciation and amortization | 540 | 524 | |||||||||
| Provision (benefit) for deferred income taxes | (38) | (54) | |||||||||
| (Gain) loss on divestiture | — | (64) | |||||||||
| Other | 78 | (5) | |||||||||
| Changes in assets and liabilities, net of acquisitions and divestitures: | |||||||||||
| Receivables – trade and other | 155 | (81) | |||||||||
| Inventories | (990) | (439) | |||||||||
| Accounts payable | 401 | 203 | |||||||||
| Accrued expenses | (198) | (38) | |||||||||
| Accrued wages, salaries and employee benefits | (1,144) | (1,454) | |||||||||
| Customer advances | 713 | 279 | |||||||||
| Other assets – net | 69 | 60 | |||||||||
| Other liabilities – net | (300) | 267 | |||||||||
| Net cash provided by (used for) operating activities | 1,289 | 2,052 | |||||||||
| Cash flow from investing activities: | |||||||||||
| Capital expenditures – excluding equipment leased to others | (710) | (500) | |||||||||
| Expenditures for equipment leased to others | (208) | (236) | |||||||||
| Proceeds from disposals of leased assets and property, plant and equipment | 149 | 155 | |||||||||
| Additions to finance receivables | (3,209) | (3,256) | |||||||||
| Collections of finance receivables | 3,049 | 3,140 | |||||||||
| Proceeds from sale of finance receivables | 7 | 13 | |||||||||
| Investments and acquisitions (net of cash acquired) | (2) | — | |||||||||
| Proceeds from sale of businesses and investments (net of cash sold) | 12 | 42 | |||||||||
| Proceeds from maturities and sale of securities | 923 | 1,867 | |||||||||
| Investments in securities | (177) | (275) | |||||||||
| Other – net | (9) | 8 | |||||||||
| Net cash provided by (used for) investing activities | (175) | 958 | |||||||||
| Cash flow from financing activities: | |||||||||||
| Dividends paid | (674) | (648) | |||||||||
| Common stock issued, including treasury shares reissued | (64) | (8) | |||||||||
| Payments to purchase common stock | (3,660) | (4,455) | |||||||||
| Proceeds from debt issued (original maturities greater than three months) | 2,633 | 2,731 | |||||||||
| Payments on debt (original maturities greater than three months) | (1,797) | (1,570) | |||||||||
| Short-term borrowings – net (original maturities three months or less) | (934) | (1,050) | |||||||||
| Net cash provided by (used for) financing activities | (4,496) | (5,000) | |||||||||
| Effect of exchange rate changes on cash | 54 | (30) | |||||||||
| Increase (decrease) in cash, cash equivalents and restricted cash | (3,328) | (2,020) | |||||||||
| Cash, cash equivalents and restricted cash at beginning of period | 6,896 | 6,985 | |||||||||
| Cash, cash equivalents and restricted cash at end of period | $ | 3,568 | $ | 4,965 | |||||||
Cash equivalents primarily represent short-term, highly liquid investments with original maturities of generally three months or less. | ||
| Supplemental Consolidating Data | ||||||||||||||||||||||||||
| Consolidated | Machinery, Energy & Transportation | Financial Products | Consolidating Adjustments | |||||||||||||||||||||||
| Sales and revenues: | ||||||||||||||||||||||||||
| Sales of Machinery, Energy & Transportation | $ | 13,378 | $ | 13,378 | $ | — | $ | — | ||||||||||||||||||
| Revenues of Financial Products | 871 | — | 1,048 | (177) | 1 | |||||||||||||||||||||
| Total sales and revenues | 14,249 | 13,378 | 1,048 | (177) | ||||||||||||||||||||||
| Operating costs: | ||||||||||||||||||||||||||
| Cost of goods sold | 8,965 | 8,967 | — | (2) | 2 | |||||||||||||||||||||
| Selling, general and administrative expenses | 1,593 | 1,408 | 196 | (11) | 2 | |||||||||||||||||||||
| Research and development expenses | 480 | 480 | — | — | ||||||||||||||||||||||
| Interest expense of Financial Products | 326 | — | 326 | — | ||||||||||||||||||||||
| Other operating (income) expenses | 306 | 8 | 325 | (27) | 2 | |||||||||||||||||||||
| Total operating costs | 11,670 | 10,863 | 847 | (40) | ||||||||||||||||||||||
| Operating profit | 2,579 | 2,515 | 201 | (137) | ||||||||||||||||||||||
| Interest expense excluding Financial Products | 116 | 119 | — | (3) | 3 | |||||||||||||||||||||
| Other income (expense) | 107 | (45) | 18 | 134 | 4 | |||||||||||||||||||||
| Consolidated profit before taxes | 2,570 | 2,351 | 219 | — | ||||||||||||||||||||||
| Provision (benefit) for income taxes | 574 | 520 | 54 | — | ||||||||||||||||||||||
| Profit of consolidated companies | 1,996 | 1,831 | 165 | — | ||||||||||||||||||||||
| Equity in profit (loss) of unconsolidated affiliated companies | 7 | 7 | — | — | ||||||||||||||||||||||
| Profit of consolidated and affiliated companies | 2,003 | 1,838 | 165 | — | ||||||||||||||||||||||
Profit 5 | $ | 2,003 | $ | 1,838 | $ | 165 | $ | — | ||||||||||||||||||
| 1 | Elimination of Financial Products’ revenues earned from ME&T. | ||||
| 2 | Elimination of net expenses recorded between ME&T and Financial Products. | ||||
| 3 | Elimination of interest expense recorded between Financial Products and ME&T. | ||||
| 4 | Elimination of discount recorded by ME&T on receivables sold to Financial Products and of interest earned between ME&T and Financial Products as well as dividends paid by Financial Products to ME&T. | ||||
| 5 | Profit attributable to common shareholders. | ||||
| Supplemental Consolidating Data | ||||||||||||||||||||||||||
| Consolidated | Machinery, Energy & Transportation | Financial Products | Consolidating Adjustments | |||||||||||||||||||||||
| Sales and revenues: | ||||||||||||||||||||||||||
| Sales of Machinery, Energy & Transportation | $ | 14,960 | $ | 14,960 | $ | — | $ | — | ||||||||||||||||||
| Revenues of Financial Products | 839 | — | 1,029 | (190) | 1 | |||||||||||||||||||||
| Total sales and revenues | 15,799 | 14,960 | 1,029 | (190) | ||||||||||||||||||||||
| Operating costs: | ||||||||||||||||||||||||||
| Cost of goods sold | 9,662 | 9,664 | — | (2) | 2 | |||||||||||||||||||||
| Selling, general and administrative expenses | 1,577 | 1,413 | 178 | (14) | 2 | |||||||||||||||||||||
| Research and development expenses | 520 | 520 | — | — | ||||||||||||||||||||||
| Interest expense of Financial Products | 298 | — | 298 | — | ||||||||||||||||||||||
| Other operating (income) expenses | 223 | (41) | 285 | (21) | 2 | |||||||||||||||||||||
| Total operating costs | 12,280 | 11,556 | 761 | (37) | ||||||||||||||||||||||
| Operating profit | 3,519 | 3,404 | 268 | (153) | ||||||||||||||||||||||
| Interest expense excluding Financial Products | 143 | 143 | — | — | ||||||||||||||||||||||
| Other income (expense) | 156 | (20) | 23 | 153 | 3 | |||||||||||||||||||||
| Consolidated profit before taxes | 3,532 | 3,241 | 291 | — | ||||||||||||||||||||||
| Provision (benefit) for income taxes | 688 | 615 | 73 | — | ||||||||||||||||||||||
| Profit of consolidated companies | 2,844 | 2,626 | 218 | — | ||||||||||||||||||||||
| Equity in profit (loss) of unconsolidated affiliated companies | 10 | 10 | — | — | ||||||||||||||||||||||
| Profit of consolidated and affiliated companies | 2,854 | 2,636 | 218 | — | ||||||||||||||||||||||
| Less: Profit (loss) attributable to noncontrolling interests | (2) | (3) | 1 | — | ||||||||||||||||||||||
Profit 4 | $ | 2,856 | $ | 2,639 | $ | 217 | $ | — | ||||||||||||||||||
| 1 | Elimination of Financial Products’ revenues earned from ME&T. | ||||
| 2 | Elimination of net expenses recorded between ME&T and Financial Products. | ||||
| 3 | Elimination of discount recorded by ME&T on receivables sold to Financial Products and of interest earned between ME&T and Financial Products as well as dividends paid by Financial Products to ME&T. | ||||
| 4 | Profit attributable to common shareholders. | ||||
| Supplemental Consolidating Data | ||||||||||||||||||||||||||
| Consolidated | Machinery, Energy & Transportation | Financial Products | Consolidating Adjustments | |||||||||||||||||||||||
| Assets | ||||||||||||||||||||||||||
| Current assets: | ||||||||||||||||||||||||||
| Cash and cash equivalents | $ | 3,562 | $ | 2,741 | $ | 821 | $ | — | ||||||||||||||||||
| Receivables – trade and other | 9,116 | 3,321 | 551 | 5,244 | 1,2 | |||||||||||||||||||||
| Receivables – finance | 9,655 | — | 15,168 | (5,513) | 2 | |||||||||||||||||||||
| Prepaid expenses and other current assets | 2,824 | 2,413 | 448 | (37) | 3 | |||||||||||||||||||||
| Inventories | 17,862 | 17,862 | — | — | ||||||||||||||||||||||
| Total current assets | 43,019 | 26,337 | 16,988 | (306) | ||||||||||||||||||||||
| Property, plant and equipment – net | 13,432 | 9,655 | 3,777 | — | ||||||||||||||||||||||
| Long-term receivables – trade and other | 1,261 | 532 | 94 | 635 | 1,2 | |||||||||||||||||||||
| Long-term receivables – finance | 13,452 | — | 14,274 | (822) | 2 | |||||||||||||||||||||
| Noncurrent deferred and refundable income taxes | 3,334 | 3,614 | 119 | (399) | 4 | |||||||||||||||||||||
| Intangible assets | 361 | 361 | — | — | ||||||||||||||||||||||
| Goodwill | 5,270 | 5,270 | — | — | ||||||||||||||||||||||
| Other assets | 4,845 | 3,567 | 2,299 | (1,021) | 5 | |||||||||||||||||||||
| Total assets | $ | 84,974 | $ | 49,336 | $ | 37,551 | $ | (1,913) | ||||||||||||||||||
| Liabilities | ||||||||||||||||||||||||||
| Current liabilities: | ||||||||||||||||||||||||||
| Short-term borrowings | $ | 3,454 | $ | — | $ | 3,454 | $ | — | ||||||||||||||||||
| Accounts payable | 7,792 | 7,726 | 345 | (279) | 6,7 | |||||||||||||||||||||
| Accrued expenses | 4,990 | 4,304 | 686 | — | ||||||||||||||||||||||
| Accrued wages, salaries and employee benefits | 1,259 | 1,230 | 29 | — | ||||||||||||||||||||||
| Customer advances | 2,951 | 2,932 | 3 | 16 | 7 | |||||||||||||||||||||
| Other current liabilities | 2,834 | 2,162 | 733 | (61) | 4,5,8 | |||||||||||||||||||||
| Long-term debt due within one year | 9,315 | 29 | 9,286 | — | ||||||||||||||||||||||
| Total current liabilities | 32,595 | 18,383 | 14,536 | (324) | ||||||||||||||||||||||
| Long-term debt due after one year | 25,819 | 8,811 | 17,201 | (193) | 9 | |||||||||||||||||||||
| Liability for postemployment benefits | 3,575 | 3,575 | — | — | ||||||||||||||||||||||
| Other liabilities | 4,915 | 4,033 | 1,306 | (424) | 4,5 | |||||||||||||||||||||
| Total liabilities | 66,904 | 34,802 | 33,043 | (941) | ||||||||||||||||||||||
| Shareholders’ equity | ||||||||||||||||||||||||||
| Common stock | 6,043 | 6,043 | 905 | (905) | 10 | |||||||||||||||||||||
| Treasury stock | (47,127) | (47,127) | — | — | ||||||||||||||||||||||
| Profit employed in the business | 61,356 | 56,626 | 4,720 | 10 | 10 | |||||||||||||||||||||
| Accumulated other comprehensive income (loss) | (2,205) | (1,013) | (1,192) | — | ||||||||||||||||||||||
| Noncontrolling interests | 3 | 5 | 75 | (77) | 10 | |||||||||||||||||||||
| Total shareholders’ equity | 18,070 | 14,534 | 4,508 | (972) | ||||||||||||||||||||||
| Total liabilities and shareholders’ equity | $ | 84,974 | $ | 49,336 | $ | 37,551 | $ | (1,913) | ||||||||||||||||||
| 1 | Elimination of receivables between ME&T and Financial Products. | ||||
| 2 | Reclassification of ME&T’s trade receivables purchased by Financial Products and Financial Products’ wholesale inventory receivables. | ||||
| 3 | Elimination of ME&T's insurance premiums that are prepaid to Financial Products. | ||||
| 4 | Reclassification reflecting required netting of deferred tax assets/liabilities by taxing jurisdiction. | ||||
| 5 | Elimination of other intercompany assets and liabilities between ME&T and Financial Products. | ||||
| 6 | Elimination of payables between ME&T and Financial Products. | ||||
| 7 | Reclassification of Financial Products' payables to customer advances. | ||||
| 8 | Elimination of prepaid insurance in Financial Products’ other liabilities. | ||||
| 9 | Elimination of debt between ME&T and Financial Products. | ||||
| 10 | Eliminations associated with ME&T’s investments in Financial Products’ subsidiaries. | ||||
| Supplemental Consolidating Data | ||||||||||||||||||||||||||
| Consolidated | Machinery, Energy & Transportation | Financial Products | Consolidating Adjustments | |||||||||||||||||||||||
| Assets | ||||||||||||||||||||||||||
| Current assets: | ||||||||||||||||||||||||||
| Cash and cash equivalents | $ | 6,889 | $ | 6,165 | $ | 724 | $ | — | ||||||||||||||||||
| Receivables – trade and other | 9,282 | 3,463 | 688 | 5,131 | 1,2 | |||||||||||||||||||||
| Receivables – finance | 9,565 | — | 14,957 | (5,392) | 2 | |||||||||||||||||||||
| Prepaid expenses and other current assets | 3,119 | 2,872 | 401 | (154) | 3 | |||||||||||||||||||||
| Inventories | 16,827 | 16,827 | — | — | ||||||||||||||||||||||
| Total current assets | 45,682 | 29,327 | 16,770 | (415) | ||||||||||||||||||||||
| Property, plant and equipment – net | 13,361 | 9,531 | 3,830 | — | ||||||||||||||||||||||
| Long-term receivables – trade and other | 1,225 | 500 | 86 | 639 | 1,2 | |||||||||||||||||||||
| Long-term receivables – finance | 13,242 | — | 14,048 | (806) | 2 | |||||||||||||||||||||
| Noncurrent deferred and refundable income taxes | 3,312 | 3,594 | 118 | (400) | 4 | |||||||||||||||||||||
| Intangible assets | 399 | 399 | — | — | ||||||||||||||||||||||
| Goodwill | 5,241 | 5,241 | — | — | ||||||||||||||||||||||
| Other assets | 5,302 | 4,050 | 2,277 | (1,025) | 5 | |||||||||||||||||||||
| Total assets | $ | 87,764 | $ | 52,642 | $ | 37,129 | $ | (2,007) | ||||||||||||||||||
| Liabilities | ||||||||||||||||||||||||||
| Current liabilities: | ||||||||||||||||||||||||||
| Short-term borrowings | $ | 4,393 | $ | — | $ | 4,393 | $ | — | ||||||||||||||||||
| Accounts payable | 7,675 | 7,619 | 331 | (275) | 6,7 | |||||||||||||||||||||
| Accrued expenses | 5,243 | 4,589 | 654 | — | ||||||||||||||||||||||
| Accrued wages, salaries and employee benefits | 2,391 | 2,335 | 56 | — | ||||||||||||||||||||||
| Customer advances | 2,322 | 2,305 | 3 | 14 | 7 | |||||||||||||||||||||
| Dividends payable | 674 | 674 | — | — | ||||||||||||||||||||||
| Other current liabilities | 2,909 | 2,388 | 696 | (175) | 4,8 | |||||||||||||||||||||
| Long-term debt due within one year | 6,665 | 46 | 6,619 | — | ||||||||||||||||||||||
| Total current liabilities | 32,272 | 19,956 | 12,752 | (436) | ||||||||||||||||||||||
| Long-term debt due after one year | 27,351 | 8,731 | 18,787 | (167) | 9 | |||||||||||||||||||||
| Liability for postemployment benefits | 3,757 | 3,757 | — | — | ||||||||||||||||||||||
| Other liabilities | 4,890 | 3,977 | 1,344 | (431) | 4 | |||||||||||||||||||||
| Total liabilities | 68,270 | 36,421 | 32,883 | (1,034) | ||||||||||||||||||||||
| Shareholders’ equity | ||||||||||||||||||||||||||
| Common stock | 6,941 | 6,941 | 905 | (905) | 10 | |||||||||||||||||||||
| Treasury stock | (44,331) | (44,331) | — | — | ||||||||||||||||||||||
| Profit employed in the business | 59,352 | 54,787 | 4,555 | 10 | 10 | |||||||||||||||||||||
| Accumulated other comprehensive income (loss) | (2,471) | (1,182) | (1,289) | — | ||||||||||||||||||||||
| Noncontrolling interests | 3 | 6 | 75 | (78) | 10 | |||||||||||||||||||||
| Total shareholders’ equity | 19,494 | 16,221 | 4,246 | (973) | ||||||||||||||||||||||
| Total liabilities and shareholders’ equity | $ | 87,764 | $ | 52,642 | $ | 37,129 | $ | (2,007) | ||||||||||||||||||
| 1 | Elimination of receivables between ME&T and Financial Products. | ||||
| 2 | Reclassification of ME&T’s trade receivables purchased by Financial Products and Financial Products’ wholesale inventory receivables. | ||||
| 3 | Elimination of ME&T’s insurance premiums that are prepaid to Financial Products. | ||||
| 4 | Reclassification reflecting required netting of deferred tax assets/liabilities by taxing jurisdiction. | ||||
| 5 | Elimination of other intercompany assets and liabilities between ME&T and Financial Products. | ||||
| 6 | Elimination of payables between ME&T and Financial Products. | ||||
| 7 | Reclassification of Financial Products' payables to customer advances. | ||||
| 8 | Elimination of prepaid insurance in Financial Products’ other liabilities. | ||||
| 9 | Elimination of debt between ME&T and Financial Products. | ||||
| 10 | Eliminations associated with ME&T’s investments in Financial Products’ subsidiaries. | ||||
| Supplemental Consolidating Data | ||||||||||||||||||||||||||
| Consolidated | Machinery, Energy & Transportation | Financial Products | Consolidating Adjustments | |||||||||||||||||||||||
| Cash flow from operating activities: | ||||||||||||||||||||||||||
| Profit of consolidated and affiliated companies | $ | 2,003 | $ | 1,838 | $ | 165 | $ | — | ||||||||||||||||||
| Adjustments to reconcile profit to net cash provided by operating activities: | ||||||||||||||||||||||||||
| Depreciation and amortization | 540 | 351 | 189 | — | ||||||||||||||||||||||
| Provision (benefit) for deferred income taxes | (38) | (34) | (4) | — | ||||||||||||||||||||||
| Other | 78 | 76 | (123) | 125 | 1 | |||||||||||||||||||||
| Changes in assets and liabilities, net of acquisitions and divestitures: | ||||||||||||||||||||||||||
| Receivables – trade and other | 155 | 215 | (19) | (41) | 1,2 | |||||||||||||||||||||
| Inventories | (990) | (990) | — | — | ||||||||||||||||||||||
| Accounts payable | 401 | 343 | 60 | (2) | 1 | |||||||||||||||||||||
| Accrued expenses | (198) | (211) | 13 | — | ||||||||||||||||||||||
| Accrued wages, salaries and employee benefits | (1,144) | (1,117) | (27) | — | ||||||||||||||||||||||
| Customer advances | 713 | 713 | — | — | ||||||||||||||||||||||
| Other assets – net | 69 | 224 | (12) | (143) | 1 | |||||||||||||||||||||
| Other liabilities – net | (300) | (482) | 55 | 127 | 1 | |||||||||||||||||||||
| Net cash provided by (used for) operating activities | 1,289 | 926 | 297 | 66 | ||||||||||||||||||||||
| Cash flow from investing activities: | ||||||||||||||||||||||||||
| Capital expenditures – excluding equipment leased to others | (710) | (700) | (11) | 1 | 1 | |||||||||||||||||||||
| Expenditures for equipment leased to others | (208) | (4) | (205) | 1 | 1 | |||||||||||||||||||||
| Proceeds from disposals of leased assets and property, plant and equipment | 149 | 14 | 137 | (2) | 1 | |||||||||||||||||||||
| Additions to finance receivables | (3,209) | — | (3,549) | 340 | 2 | |||||||||||||||||||||
| Collections of finance receivables | 3,049 | — | 3,458 | (409) | 2 | |||||||||||||||||||||
| Net intercompany purchased receivables | — | — | (3) | 3 | 2 | |||||||||||||||||||||
| Proceeds from sale of finance receivables | 7 | — | 7 | — | ||||||||||||||||||||||
| Net intercompany borrowings | — | — | 7 | (7) | 3 | |||||||||||||||||||||
| Investments and acquisitions (net of cash acquired) | (2) | (2) | — | — | ||||||||||||||||||||||
| Proceeds from sale of businesses and investments (net of cash sold) | 12 | 12 | — | — | ||||||||||||||||||||||
| Proceeds from maturities and sale of securities | 923 | 782 | 141 | — | ||||||||||||||||||||||
| Investments in securities | (177) | (28) | (149) | — | ||||||||||||||||||||||
| Other – net | (9) | (44) | 35 | — | ||||||||||||||||||||||
| Net cash provided by (used for) investing activities | (175) | 30 | (132) | (73) | ||||||||||||||||||||||
| Cash flow from financing activities: | ||||||||||||||||||||||||||
| Dividends paid | (674) | (674) | — | — | ||||||||||||||||||||||
| Common stock issued, including treasury shares reissued | (64) | (64) | — | — | ||||||||||||||||||||||
| Payments to purchase common stock | (3,660) | (3,660) | — | — | ||||||||||||||||||||||
| Net intercompany borrowings | — | (7) | — | 7 | 3 | |||||||||||||||||||||
| Proceeds from debt issued (original maturities greater than three months) | 2,633 | — | 2,633 | — | ||||||||||||||||||||||
| Payments on debt (original maturities greater than three months) | (1,797) | (27) | (1,770) | — | ||||||||||||||||||||||
| Short-term borrowings – net (original maturities three months or less) | (934) | — | (934) | — | ||||||||||||||||||||||
| Net cash provided by (used for) financing activities | (4,496) | (4,432) | (71) | 7 | ||||||||||||||||||||||
| Effect of exchange rate changes on cash | 54 | 49 | 5 | — | ||||||||||||||||||||||
| Increase (decrease) in cash, cash equivalents and restricted cash | (3,328) | (3,427) | 99 | — | ||||||||||||||||||||||
| Cash, cash equivalents and restricted cash at beginning of period | 6,896 | 6,170 | 726 | — | ||||||||||||||||||||||
| Cash, cash equivalents and restricted cash at end of period | $ | 3,568 | $ | 2,743 | $ | 825 | $ | — | ||||||||||||||||||
| 1 | Elimination of non-cash adjustments and changes in assets and liabilities related to consolidated reporting. | ||||
| 2 | Reclassification of Financial Products’ cash flow activity from investing to operating for receivables that arose from the sale of inventory. | ||||
| 3 | Elimination of net proceeds and payments to/from ME&T and Financial Products. | ||||
| Supplemental Consolidating Data | ||||||||||||||||||||||||||
| Consolidated | Machinery, Energy & Transportation | Financial Products | Consolidating Adjustments | |||||||||||||||||||||||
| Cash flow from operating activities: | ||||||||||||||||||||||||||
| Profit of consolidated and affiliated companies | $ | 2,854 | $ | 2,636 | $ | 218 | $ | — | ||||||||||||||||||
| Adjustments to reconcile profit to net cash provided by operating activities: | ||||||||||||||||||||||||||
| Depreciation and amortization | 524 | 328 | 196 | — | ||||||||||||||||||||||
| Provision (benefit) for deferred income taxes | (54) | (23) | (31) | — | ||||||||||||||||||||||
| (Gain) loss on divestiture | (64) | (64) | — | — | ||||||||||||||||||||||
| Other | (5) | (16) | (120) | 131 | 1 | |||||||||||||||||||||
| Changes in assets and liabilities, net of acquisitions and divestitures: | ||||||||||||||||||||||||||
| Receivables – trade and other | (81) | 111 | (40) | (152) | 1,2 | |||||||||||||||||||||
| Inventories | (439) | (434) | — | (5) | 1 | |||||||||||||||||||||
| Accounts payable | 203 | 179 | 30 | (6) | 1 | |||||||||||||||||||||
| Accrued expenses | (38) | (47) | 9 | — | ||||||||||||||||||||||
| Accrued wages, salaries and employee benefits | (1,454) | (1,422) | (32) | — | ||||||||||||||||||||||
| Customer advances | 279 | 279 | — | — | ||||||||||||||||||||||
| Other assets – net | 60 | 102 | 3 | (45) | 1 | |||||||||||||||||||||
| Other liabilities – net | 267 | 142 | 75 | 50 | 1 | |||||||||||||||||||||
| Net cash provided by (used for) operating activities | 2,052 | 1,771 | 308 | (27) | ||||||||||||||||||||||
| Cash flow from investing activities: | ||||||||||||||||||||||||||
| Capital expenditures – excluding equipment leased to others | (500) | (493) | (8) | 1 | 1 | |||||||||||||||||||||
| Expenditures for equipment leased to others | (236) | (9) | (233) | 6 | 1 | |||||||||||||||||||||
| Proceeds from disposals of leased assets and property, plant and equipment | 155 | 5 | 152 | (2) | 1 | |||||||||||||||||||||
| Additions to finance receivables | (3,256) | — | (3,573) | 317 | 2 | |||||||||||||||||||||
| Collections of finance receivables | 3,140 | — | 3,572 | (432) | 2 | |||||||||||||||||||||
| Net intercompany purchased receivables | — | — | (137) | 137 | 2 | |||||||||||||||||||||
| Proceeds from sale of finance receivables | 13 | — | 13 | — | ||||||||||||||||||||||
| Net intercompany borrowings | — | — | 3 | (3) | 3 | |||||||||||||||||||||
| Proceeds from sale of businesses and investments (net of cash sold) | 42 | 42 | — | — | ||||||||||||||||||||||
| Proceeds from maturities and sale of securities | 1,867 | 1,797 | 70 | — | ||||||||||||||||||||||
| Investments in securities | (275) | (148) | (127) | — | ||||||||||||||||||||||
| Other – net | 8 | 31 | (23) | — | ||||||||||||||||||||||
| Net cash provided by (used for) investing activities | 958 | 1,225 | (291) | 24 | ||||||||||||||||||||||
| Cash flow from financing activities: | ||||||||||||||||||||||||||
| Dividends paid | (648) | (648) | — | — | ||||||||||||||||||||||
| Common stock issued, including treasury shares reissued | (8) | (8) | — | — | ||||||||||||||||||||||
| Payments to purchase common stock | (4,455) | (4,455) | — | — | ||||||||||||||||||||||
| Net intercompany borrowings | — | (3) | — | 3 | 3 | |||||||||||||||||||||
| Proceeds from debt issued (original maturities greater than three months) | 2,731 | — | 2,731 | — | ||||||||||||||||||||||
| Payments on debt (original maturities greater than three months) | (1,570) | (6) | (1,564) | — | ||||||||||||||||||||||
| Short-term borrowings – net (original maturities three months or less) | (1,050) | — | (1,050) | — | ||||||||||||||||||||||
| Net cash provided by (used for) financing activities | (5,000) | (5,120) | 117 | 3 | ||||||||||||||||||||||
| Effect of exchange rate changes on cash | (30) | (20) | (10) | — | ||||||||||||||||||||||
| Increase (decrease) in cash, cash equivalents and restricted cash | (2,020) | (2,144) | 124 | — | ||||||||||||||||||||||
| Cash, cash equivalents and restricted cash at beginning of period | 6,985 | 6,111 | 874 | — | ||||||||||||||||||||||
| Cash, cash equivalents and restricted cash at end of period | $ | 4,965 | $ | 3,967 | $ | 998 | $ | — | ||||||||||||||||||
| 1 | Elimination of non-cash adjustments and changes in assets and liabilities related to consolidated reporting. | ||||
| 2 | Reclassification of Financial Products’ cash flow activity from investing to operating for receivables that arose from the sale of inventory. | ||||
| 3 | Elimination of net proceeds and payments to/from ME&T and Financial Products. | ||||