Pay vs Performance Disclosure
number in Thousands |
12 Months Ended |
|
Dec. 31, 2024
USD ($)
|
Dec. 31, 2023
USD ($)
|
Dec. 31, 2022
USD ($)
|
Dec. 31, 2021
USD ($)
|
Dec. 31, 2020
USD ($)
|
| Pay vs Performance Disclosure |
|
|
|
|
|
| Pay vs Performance Disclosure, Table |
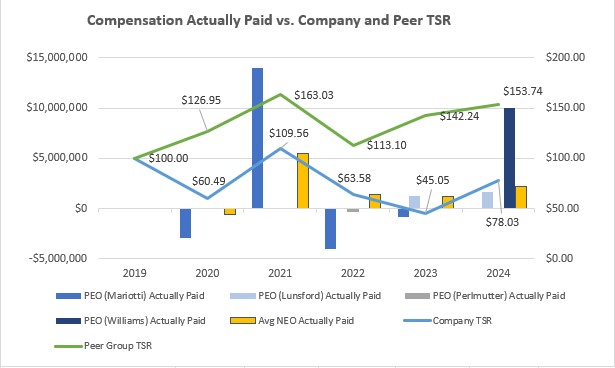
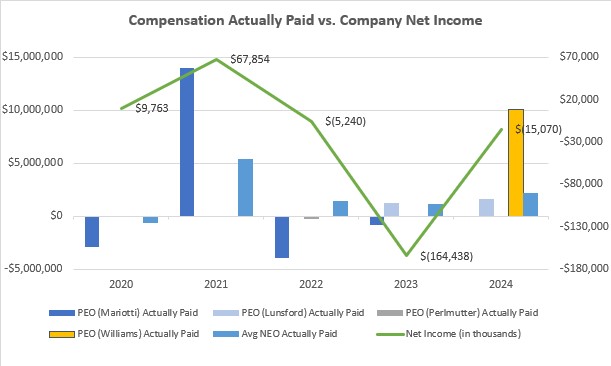
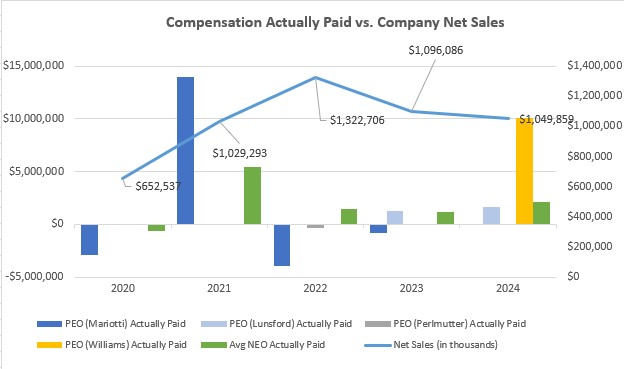
| | | | | | | | | | | | | | | | | | | | | | | | | | | | | | | | | | | | | | | | | | | | | | Year | Summary Compensation Table Total for PEO (Mariotti) ($)(4) | Compensation Actually Paid to PEO (Mariotti) ($)(1)(4) | Summary Compensation Table Total for PEO (Perlmutter) ($)(5) | Compensation Actually Paid to PEO (Perlmutter) ($)(1)(5) | Summary Compensation Table Total for PEO (Lunsford) ($)(6) | Compensation Actually Paid to PEO (Lunsford) ($)(1)(6) | Summary Compensation Table Total for PEO (Williams) ($)(7) | Compensation Actually Paid to PEO (Williams) ($)(1)(7) | Average Summary Compensation Table Total for Non-PEO NEOs ($) | Average Compensation Actually Paid to Non-PEO NEOs ($) (1) | Value of Initial Fixed $100 Investment Based on: | Net Income ($) (in thousands) | Net Sales(3) ($) (in thousands) | | Total Shareholder Return ($) | Peer Group Total Shareholder Return ($) (2) | | 2024 | — | | — | | — | | — | | 827,698 | | 1,637,588 | | 6,590,561 | | 10,157,314 | | 1,703,370 | | 2,167,141 | | 78.03 | | 153.74 | | (15,070) | | 1,049,850 | | | 2023 | 2,247,043 | | (823,086) | | — | | — | | 1,335,897 | | 1,257,263 | | — | | — | | 1,665,765 | | 1,185,547 | | 45.05 | | 142.24 | | (164,438) | | 1,096,086 | | | 2022 | 3,130,262 | | (3,979,745) | | 4,214,325 | | (298,106) | | — | | — | | — | | — | | 2,562,172 | | 1,448,176 | | 63.58 | | 113.10 | | (5,240) | | 1,322,706 | | | 2021 | 5,439,651 | | 13,984,354 | | — | | — | | — | | — | | — | | — | | 2,362,586 | | 5,430,853 | | 109.56 | | 163.03 | | 67,854 | | 1,029,293 | | | 2020 | 2,627,245 | | (2,902,267) | | — | | — | | — | | — | | — | | — | | 1,357,551 | | (625,704) | | 60.49 | | 126.95 | | 9,763 | | 652,537 | |
|
|
|
|
|
| Company Selected Measure Name |
Net Sales
|
|
|
|
|
| Named Executive Officers, Footnote |
Amounts represent compensation actually paid to our PEO and the average compensation actually paid to our remaining NEOs for the relevant fiscal year, as determined under SEC rules (and described below), which includes the individuals indicated in the table below for each fiscal year: | | | | | | | | | | | | | Year | PEO | Non-PEO NEOs | | 2024 | Michael Lunsford and Cynthia Williams | Yves Le Pendeven, Andrew Oddie, Tracy Daw, Steve Nave and Andrew Perlmutter | | 2023 | Brian Mariotti and Michael Lunsford | Steve Nave, Andrew Perlmutter, Andrew Oddie, Tracy Daw, and Scott Yessner | | 2022 | Brian Mariotti and Andrew Perlmutter | Scott Yessner, Andrew Oddie, Tracy Daw, and Jennifer Fall Jung | | 2021 | Brian Mariotti | Andrew Perlmutter and Jennifer Fall Jung | | 2020 | Brian Mariotti | Andrew Perlmutter and Jennifer Fall Jung |
Effective March 15, 2024, Mr. Nave ceased serving as our Chief Financial Officer and Chief Operating Officer, and Mr. Le Pendeven commenced serving as our Acting Chief Financial Officer. Mr. Le Pendeven was subsequently appointed Chief Financial Officer effective August 8, 2024. Effective May 20, 2025, Ms. Williams succeeded Mr. Lunsford (who had been serving as the Company's Interim Chief Executive Officer) as Chief Executive Officer.
|
|
|
|
|
| Peer Group Issuers, Footnote |
For the relevant fiscal year, represents the cumulative TSR (the “Peer Group TSR”) of the Russell 2000 Consumer Discretionary Index (the “Peer Group”).I
|
|
|
|
|
| Adjustment To PEO Compensation, Footnote |
Compensation actually paid to our NEOs represents the “Total” compensation reported in the Summary Compensation Table for the applicable fiscal year, as adjusted as follows: | | | | | | | | | | | | | | | | | | | | | 2024 | | | Adjustments | PEO (Lunsford) | PEO (Williams) | Average Non-PEO NEOs | | | Deduction for Amounts Reported under the “Stock Awards” and “Option Awards” Columns in the Summary Compensation Table for Applicable FY | (146,370) | | (5,550,513) | | (594,341) | | | | Increase based on ASC 718 Fair Value of Awards Granted during Applicable FY that Remain Unvested as of Applicable FY End, determined as of Applicable FY End | — | | 9,117,266 | | 1,089,570 | | | | Increase based on ASC 718 Fair Value of Awards Granted during Applicable FY that Vested during Applicable FY, determined as of Vesting Date | 207,740 | | — | | 11,160 | | | | Increase/deduction for Awards Granted during Prior FY that were Outstanding and Unvested as of Applicable FY End, determined based on change in ASC 718 Fair Value from Prior FY End to Applicable FY End | — | | — | | 381,928 | | | | Increase/deduction for Awards Granted during Prior FY that Vested During Applicable FY, determined based on change in ASC 718 Fair Value from Prior FY End to Vesting Date | 880,672 | | — | | (234,019) | | | | Deduction of ASC 718 Fair Value of Awards Granted during Prior FY that were Forfeited during Applicable FY, determined as of Prior FY End | (132,152) | | — | | 190,527 | | | | TOTAL ADJUSTMENTS | 809,890 | | 3,566,753 | | 844,825 | |
|
|
|
|
|
| Non-PEO NEO Average Total Compensation Amount |
$ 1,703,370
|
$ 1,665,765
|
$ 2,562,172
|
$ 2,362,586
|
$ 1,357,551
|
| Non-PEO NEO Average Compensation Actually Paid Amount |
$ 2,167,141
|
1,185,547
|
1,448,176
|
5,430,853
|
(625,704)
|
| Adjustment to Non-PEO NEO Compensation Footnote |
Compensation actually paid to our NEOs represents the “Total” compensation reported in the Summary Compensation Table for the applicable fiscal year, as adjusted as follows: | | | | | | | | | | | | | | | | | | | | | 2024 | | | Adjustments | PEO (Lunsford) | PEO (Williams) | Average Non-PEO NEOs | | | Deduction for Amounts Reported under the “Stock Awards” and “Option Awards” Columns in the Summary Compensation Table for Applicable FY | (146,370) | | (5,550,513) | | (594,341) | | | | Increase based on ASC 718 Fair Value of Awards Granted during Applicable FY that Remain Unvested as of Applicable FY End, determined as of Applicable FY End | — | | 9,117,266 | | 1,089,570 | | | | Increase based on ASC 718 Fair Value of Awards Granted during Applicable FY that Vested during Applicable FY, determined as of Vesting Date | 207,740 | | — | | 11,160 | | | | Increase/deduction for Awards Granted during Prior FY that were Outstanding and Unvested as of Applicable FY End, determined based on change in ASC 718 Fair Value from Prior FY End to Applicable FY End | — | | — | | 381,928 | | | | Increase/deduction for Awards Granted during Prior FY that Vested During Applicable FY, determined based on change in ASC 718 Fair Value from Prior FY End to Vesting Date | 880,672 | | — | | (234,019) | | | | Deduction of ASC 718 Fair Value of Awards Granted during Prior FY that were Forfeited during Applicable FY, determined as of Prior FY End | (132,152) | | — | | 190,527 | | | | TOTAL ADJUSTMENTS | 809,890 | | 3,566,753 | | 844,825 | |
|
|
|
|
|
| Compensation Actually Paid vs. Total Shareholder Return |
|
|
|
|
|
| Compensation Actually Paid vs. Net Income |
|
|
|
|
|
| Compensation Actually Paid vs. Company Selected Measure |
|
|
|
|
|
| Total Shareholder Return Vs Peer Group |
|
|
|
|
|
| Total Shareholder Return Amount |
$ 78.03
|
45.05
|
63.58
|
109.56
|
60.49
|
| Peer Group Total Shareholder Return Amount |
153.74
|
142.24
|
113.10
|
163.03
|
126.95
|
| Net Income (Loss) |
$ (15,070,000)
|
$ (164,438,000)
|
$ (5,240,000)
|
$ 67,854,000
|
$ 9,763,000
|
| Company Selected Measure Amount |
1,049,850
|
1,096,086
|
1,322,706
|
1,029,293
|
652,537
|
| Additional 402(v) Disclosure |
Net Sales is a GAAP measure. The Company selected Net Sales as the Company-Selected Measure due to it being an important financial performance measure that helps link compensation actually paid to the Company’s NEOs to the Company’s performance for the most recently completed fiscal year. Specifically, Net Sales is used to evaluate performance under the Executive Incentive Plan, a short-term cash incentive plan under which participating executives are eligible to earn cash bonuses based on the Company’s achievement of Net Sales as well as several other Company performance goals. Net Sales is also used as a performance metric in our long-term equity incentive program for our PSUs, which are eligible to be earned over a three-year performance period based on achievement of Net Sales and Adjusted EBITDA Margin targets.Represent summary compensation and compensation actually paid to Mr. Mariotti, who reassumed the role of Chief Executive Officer effective December 5, 2022 until June 13, 2023. (5)Represents summary compensation and compensation actually paid to Mr. Perlmutter, who served as Chief Executive Officer from January 3, 2022 until December 5, 2022. (6)Represents summary compensation and compensation actually paid to Mr. Lunsford, who served as Interim Chief Executive Officer from June 13, 2023 until May 20, 2024. (7)Represents summary compensation and compensation actually paid to Ms. Williams, who assumed the role of Chief Executive Officer effective May 20, 2024.
|
|
|
|
|
| Measure:: 1 |
|
|
|
|
|
| Pay vs Performance Disclosure |
|
|
|
|
|
| Name |
•Net Sales
|
|
|
|
|
| Measure:: 2 |
|
|
|
|
|
| Pay vs Performance Disclosure |
|
|
|
|
|
| Name |
•Adjusted EBITDA
|
|
|
|
|
| Measure:: 3 |
|
|
|
|
|
| Pay vs Performance Disclosure |
|
|
|
|
|
| Name |
Adjusted EBITDA Margin; and •Stock price
|
|
|
|
|
| Michael Lunsford [Member] |
|
|
|
|
|
| Pay vs Performance Disclosure |
|
|
|
|
|
| PEO Total Compensation Amount |
$ 827,698
|
$ 1,335,897
|
|
|
|
| PEO Actually Paid Compensation Amount |
$ 1,637,588
|
$ 1,257,263
|
|
|
|
| PEO Name |
Mr. Lunsford
|
Mr. Lunsford
|
|
|
|
| Cynthia Williams [Member] |
|
|
|
|
|
| Pay vs Performance Disclosure |
|
|
|
|
|
| PEO Total Compensation Amount |
$ 6,590,561
|
|
|
|
|
| PEO Actually Paid Compensation Amount |
$ 10,157,314
|
|
|
|
|
| PEO Name |
Ms. Williams
|
Brian Mariotti
|
Brian Mariotti
|
Brian Mariotti
|
Brian Mariotti
|
| Brian Mariotti [Member] |
|
|
|
|
|
| Pay vs Performance Disclosure |
|
|
|
|
|
| PEO Total Compensation Amount |
|
$ 2,247,043
|
$ 3,130,262
|
$ 5,439,651
|
$ 2,627,245
|
| PEO Actually Paid Compensation Amount |
|
(823,086)
|
(3,979,745)
|
$ 13,984,354
|
$ (2,902,267)
|
| Andrew Perlmutter [Member] |
|
|
|
|
|
| Pay vs Performance Disclosure |
|
|
|
|
|
| PEO Total Compensation Amount |
|
|
4,214,325
|
|
|
| PEO Actually Paid Compensation Amount |
|
|
$ (298,106)
|
|
|
| PEO | Michael Lunsford [Member] | Equity Awards Adjustments |
|
|
|
|
|
| Pay vs Performance Disclosure |
|
|
|
|
|
| Adjustment to Compensation, Amount |
$ 809,890
|
|
|
|
|
| PEO | Michael Lunsford [Member] | Aggregate Grant Date Fair Value of Equity Award Amounts Reported in Summary Compensation Table |
|
|
|
|
|
| Pay vs Performance Disclosure |
|
|
|
|
|
| Adjustment to Compensation, Amount |
(146,370)
|
|
|
|
|
| PEO | Michael Lunsford [Member] | Year-end Fair Value of Equity Awards Granted in Covered Year that are Outstanding and Unvested |
|
|
|
|
|
| Pay vs Performance Disclosure |
|
|
|
|
|
| Adjustment to Compensation, Amount |
0
|
|
|
|
|
| PEO | Michael Lunsford [Member] | Year-over-Year Change in Fair Value of Equity Awards Granted in Prior Years That are Outstanding and Unvested |
|
|
|
|
|
| Pay vs Performance Disclosure |
|
|
|
|
|
| Adjustment to Compensation, Amount |
0
|
|
|
|
|
| PEO | Michael Lunsford [Member] | Vesting Date Fair Value of Equity Awards Granted and Vested in Covered Year |
|
|
|
|
|
| Pay vs Performance Disclosure |
|
|
|
|
|
| Adjustment to Compensation, Amount |
207,740
|
|
|
|
|
| PEO | Michael Lunsford [Member] | Change in Fair Value as of Vesting Date of Prior Year Equity Awards Vested in Covered Year |
|
|
|
|
|
| Pay vs Performance Disclosure |
|
|
|
|
|
| Adjustment to Compensation, Amount |
880,672
|
|
|
|
|
| PEO | Michael Lunsford [Member] | Prior Year End Fair Value of Equity Awards Granted in Any Prior Year that Fail to Meet Applicable Vesting Conditions During Covered Year |
|
|
|
|
|
| Pay vs Performance Disclosure |
|
|
|
|
|
| Adjustment to Compensation, Amount |
(132,152)
|
|
|
|
|
| PEO | Cynthia Williams [Member] | Equity Awards Adjustments |
|
|
|
|
|
| Pay vs Performance Disclosure |
|
|
|
|
|
| Adjustment to Compensation, Amount |
|
3,566,753
|
|
|
|
| PEO | Cynthia Williams [Member] | Aggregate Grant Date Fair Value of Equity Award Amounts Reported in Summary Compensation Table |
|
|
|
|
|
| Pay vs Performance Disclosure |
|
|
|
|
|
| Adjustment to Compensation, Amount |
|
(5,550,513)
|
|
|
|
| PEO | Cynthia Williams [Member] | Year-end Fair Value of Equity Awards Granted in Covered Year that are Outstanding and Unvested |
|
|
|
|
|
| Pay vs Performance Disclosure |
|
|
|
|
|
| Adjustment to Compensation, Amount |
|
9,117,266
|
|
|
|
| PEO | Cynthia Williams [Member] | Year-over-Year Change in Fair Value of Equity Awards Granted in Prior Years That are Outstanding and Unvested |
|
|
|
|
|
| Pay vs Performance Disclosure |
|
|
|
|
|
| Adjustment to Compensation, Amount |
|
0
|
|
|
|
| PEO | Cynthia Williams [Member] | Vesting Date Fair Value of Equity Awards Granted and Vested in Covered Year |
|
|
|
|
|
| Pay vs Performance Disclosure |
|
|
|
|
|
| Adjustment to Compensation, Amount |
|
0
|
|
|
|
| PEO | Cynthia Williams [Member] | Change in Fair Value as of Vesting Date of Prior Year Equity Awards Vested in Covered Year |
|
|
|
|
|
| Pay vs Performance Disclosure |
|
|
|
|
|
| Adjustment to Compensation, Amount |
|
0
|
|
|
|
| PEO | Cynthia Williams [Member] | Prior Year End Fair Value of Equity Awards Granted in Any Prior Year that Fail to Meet Applicable Vesting Conditions During Covered Year |
|
|
|
|
|
| Pay vs Performance Disclosure |
|
|
|
|
|
| Adjustment to Compensation, Amount |
|
$ 0
|
|
|
|
| Non-PEO NEO | Equity Awards Adjustments |
|
|
|
|
|
| Pay vs Performance Disclosure |
|
|
|
|
|
| Adjustment to Compensation, Amount |
844,825
|
|
|
|
|
| Non-PEO NEO | Aggregate Grant Date Fair Value of Equity Award Amounts Reported in Summary Compensation Table |
|
|
|
|
|
| Pay vs Performance Disclosure |
|
|
|
|
|
| Adjustment to Compensation, Amount |
(594,341)
|
|
|
|
|
| Non-PEO NEO | Year-end Fair Value of Equity Awards Granted in Covered Year that are Outstanding and Unvested |
|
|
|
|
|
| Pay vs Performance Disclosure |
|
|
|
|
|
| Adjustment to Compensation, Amount |
1,089,570
|
|
|
|
|
| Non-PEO NEO | Year-over-Year Change in Fair Value of Equity Awards Granted in Prior Years That are Outstanding and Unvested |
|
|
|
|
|
| Pay vs Performance Disclosure |
|
|
|
|
|
| Adjustment to Compensation, Amount |
381,928
|
|
|
|
|
| Non-PEO NEO | Vesting Date Fair Value of Equity Awards Granted and Vested in Covered Year |
|
|
|
|
|
| Pay vs Performance Disclosure |
|
|
|
|
|
| Adjustment to Compensation, Amount |
11,160
|
|
|
|
|
| Non-PEO NEO | Change in Fair Value as of Vesting Date of Prior Year Equity Awards Vested in Covered Year |
|
|
|
|
|
| Pay vs Performance Disclosure |
|
|
|
|
|
| Adjustment to Compensation, Amount |
(234,019)
|
|
|
|
|
| Non-PEO NEO | Prior Year End Fair Value of Equity Awards Granted in Any Prior Year that Fail to Meet Applicable Vesting Conditions During Covered Year |
|
|
|
|
|
| Pay vs Performance Disclosure |
|
|
|
|
|
| Adjustment to Compensation, Amount |
$ 190,527
|
|
|
|
|