Pay vs Performance Disclosure - USD ($)
Jun. 11, 2024
Dec. 31, 2024
Dec. 31, 2024
Dec. 31, 2023
Dec. 31, 2022
Dec. 31, 2021
Dec. 31, 2020
Pay Versus Performance |
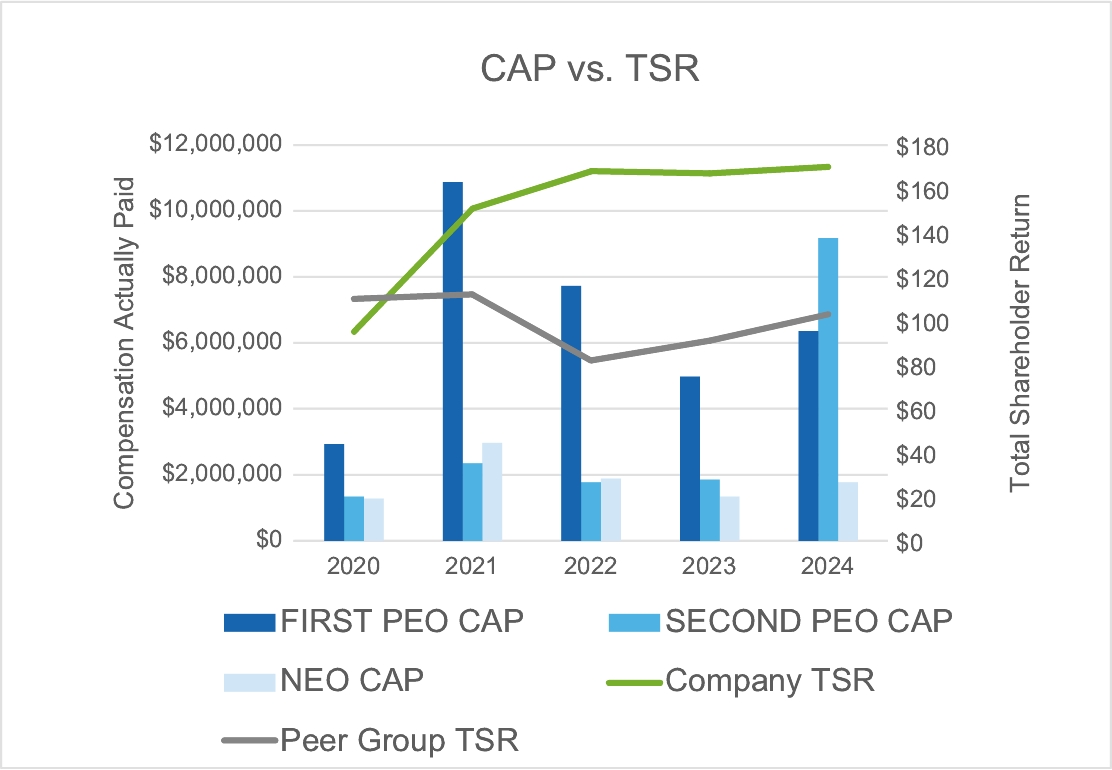
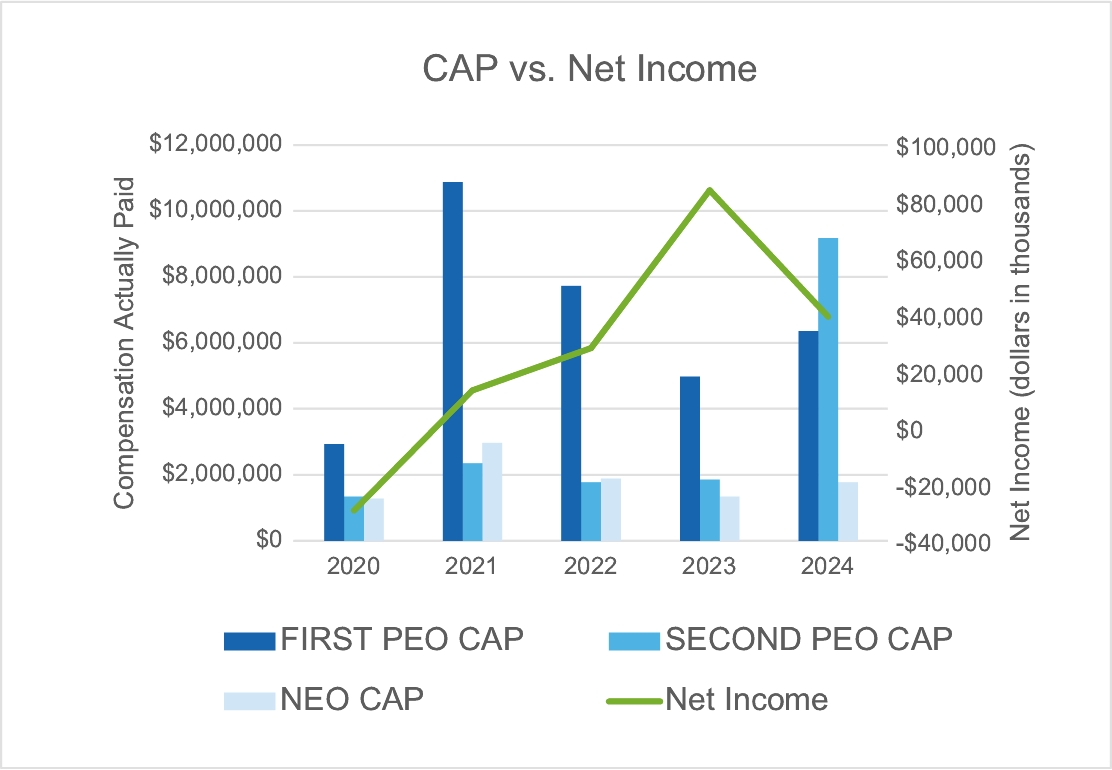
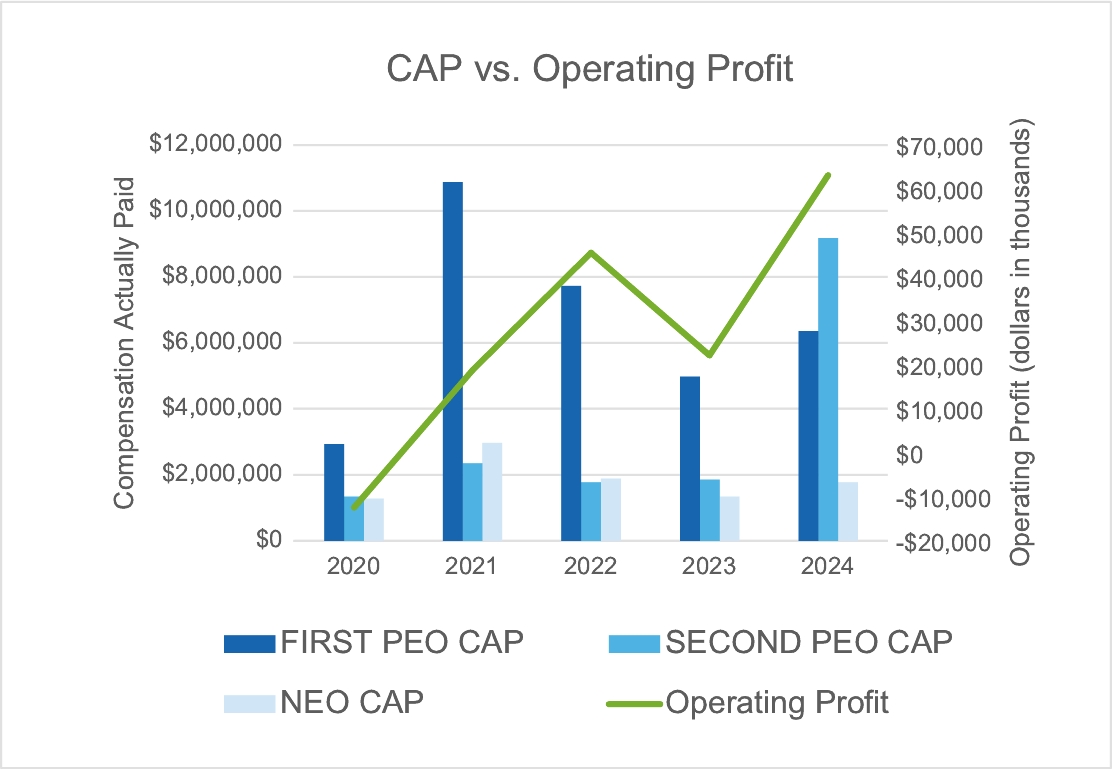
Pursuant to Section 953(a) of the Dodd-Frank Wall Street Reform and Consumer Protection Act, and Item 402(v) of Regulation S-K, we are providing the following information regarding the relationship between “compensation actually paid” (or “CAP”) to our principal executive officer (“PEO”) and other NEOs (“non-PEO NEOs”) and certain measures of our financial performance for each of the last five completed fiscal years. In determining the CAP to our NEOs, we make various adjustments to amounts reported in the Summary Compensation Table (“SCT”), as the SEC’s valuation methods for this section differ from those required in the SCT. Note that for our non-PEO NEOs, the CAP for each year is reported as an average of the CAP for such non-PEO NEOs for that year. It is important to note that CAP does not represent the actual amount of pay that has been fully earned or realized, either in the fiscal year set forth in the table or at all. For a description of our executive compensation program and the alignment of executive compensation and performance for our PEO and our non-PEO NEOs, please refer to the Compensation Discussion and Analysis section of this Proxy Statement.
Year | Summary Compensation Table for First PEO(1)(2) | Summary Compensation Table for Second PEO(1)(2) | Compensation Actually Paid to First PEO(1)(3) | Compensation Actually Paid to Second PEO(1)(3) | Average Summary Compensation Table Total for Non-PEO NEOs(4) | Average Compensation Actually Paid to Non-PEO NEOs(3) | Value of Initial Fixed$100 Investment Based On: | Net Income (GAAP, in thousands)(7) | Operating Profit (GAAP, in thousands)(8) | |||||||||||||||||||||||
Total Shareholder Return(5) | Peer Group Total Shareholder Return(6) | |||||||||||||||||||||||||||||||
2024 | $6,977,354 | $8,431,528 | $6,356,458 | $9,170,834 | $2,080,150 | $1,773,505 | $169.62 | $103.21 | $39,217 | $63,136 | ||||||||||||||||||||||
2023 | $5,100,604 | $1,889,569 | $4,973,390 | $1,855,876 | $1,446,954 | $1,336,943 | $167.18 | $90.96 | $83,994 | $22,172 | ||||||||||||||||||||||
2022 | $4,831,571 | $1,534,449 | $7,726,443 | $1,771,355 | $1,580,011 | $1,887,872 | $167.95 | $82.21 | $28,182 | $45,519 | ||||||||||||||||||||||
2021 | $4,628,135 | $1,583,143 | $10,868,485 | $2,348,267 | $2,056,418 | $2,966,573 | $150.77 | $112.44 | $13,254 | $18,809 | ||||||||||||||||||||||
2020 | $3,498,333 | $1,427,398 | $2,928,232 | $1,340,471 | $1,280,848 | $1,275,324 | $94.74 | $110.08 | ($29,271) | ($12,449) | ||||||||||||||||||||||
(1) | The First PEO is our former Chief Executive Officer Patrick Harshman, who resigned in June 2024. Our Second PEO is Nimrod Ben-Natan, who was appointed President and Chief Executive Officer in June 2024 after Mr. Harshman’s departure. |
(2) | Represents the total compensation paid to our PEOs in each listed year, as shown in the SCT of this Proxy Statement for 2022–2024 and in the SCT of prior year proxy statements for 2020 and 2021. |
(3) | The CAP does not mean that our PEO was actually paid those amounts in the listed year, or that our non-PEO NEOs were actually paid those amounts averaged and shown in the listed year, but these are dollar amounts derived from the starting point of SCT total compensation under the methodology prescribed under the relevant SEC rules as shown in the adjustment table below. For non-PEO NEOs, the indicated figures in the table show an average of each such figure for all such non-PEO NEOs in each listed year. The methodologies used for determining the fair values shown in the adjustment table below, including use of a Monte-Carlo methodology to determine fair value of TSR awards, are materially consistent with those used to determine the fair values disclosed as of the grant date of such awards. Note that we have not reported any amounts in our SCT with respect to “Change in Pension and Nonqualified Deferred Compensation,” and we do not maintain any defined benefit or actuarial pension plans for our NEO’s. Accordingly, the adjustments with respect to such items prescribed by the pay-versus-performance rules are not relevant to our analysis and no adjustments have been made. |
First PEO | Second PEO | Non-PEO NEOs (average) | |||||||||||||||||||||||||||||||||||||||||||||
2020 | 2021 | 2022 | 2023 | 2024 | 2020 | 2021 | 2022 | 2023 | 2024 | 2020 | 2021 | 2022 | 2023 | 2024 | |||||||||||||||||||||||||||||||||
Summary Compensation Table Total | $3,498,333 | $4,628,135 | $4,831,571 | $5,100,604 | $6,977,354 | $ 1,427,398 | $ 1,583,143 | $ 1,534,449 | $1,889,569 | $8,431,528 | $ 1,280,848 | $2,056,418 | $ 1,580,011 | $1,446,954 | $2,080,150 | ||||||||||||||||||||||||||||||||
Subtract Grant Date Fair Value of Stock Awards Granted in Fiscal Year | $ (2,270,749) | $(3,069,282) | $ (3,116,592) | $ (3,994,583) | $ (6,627,517) | $(775,619) | $(820,691) | $(766,796) | $ (1,404,668) | $ (7,408,105) | $(653,820) | $ (1,271,651) | $(751,151) | $ (1,039,094) | $ (1,406,740) | ||||||||||||||||||||||||||||||||
Add Fair Value at Fiscal Year-End of Outstanding and Unvested Stock Awards Granted in Fiscal Year | $2,475,519 | $5,343,927 | $5,003,296 | $3,690,647 | $6,052,658 | $926,484 | $ 1,276,630 | $ 1,068,619 | $1,231,477 | $8,189,677 | $828,308 | $1,876,882 | $ 1,072,004 | $886,411 | $1,128,760 | ||||||||||||||||||||||||||||||||
Adjust for Change in Fair Value of Outstanding and Unvested Stock Awards Granted in Prior Fiscal Years | $(401,000) | $3,778,266 | $1,957,765 | $9,981 | $(232,840) | $(21,183) | $198,153 | $70,527 | $(2,582) | $(43,057) | $(18,963) | $206,713 | $132,497 | $10,791 | $(16,387) | ||||||||||||||||||||||||||||||||
Adjust for Fair Value at Vesting of Stock Awards Granted in Fiscal Year That Vested During Fiscal Year | $— | $— | $— | $— | $— | $— | $— | $— | $108,012 | $— | $— | $— | $— | $18,002 | $— | ||||||||||||||||||||||||||||||||
Adjust for Change in Fair Value as of Vesting Date of Stock Awards Granted in Prior Fiscal Years For Which Applicable Vesting Conditions Were Satisfied During Fiscal Year | $(278,321) | $187,439 | $(949,597) | $166,741 | $186,802 | $(175,658) | $111,032 | $(135,444) | $34,069 | $791 | $(136,451) | $98,210 | $(145,489) | $13,880 | $(12,277) | ||||||||||||||||||||||||||||||||
Subtract Fair Value as of Prior Fiscal Year-End of Stock Awards Granted in Prior Fiscal Years That Failed to Meet Applicable Vesting Conditions During Fiscal Year | $(95,550) | $— | $— | $— | $— | $(40,950) | $— | $— | $— | $— | $(24,598) | $— | $— | $— | $— | ||||||||||||||||||||||||||||||||
Compensation Actually Paid | $2,928,232 | $ 10,868,485 | $7,726,443 | $4,973,390 | $6,356,458 | $1,340,471 | $ 2,348,267 | $ 1,771,355 | $1,855,876 | $9,170,834 | $ 1,275,324 | $2,966,573 | $ 1,887,872 | $1,336,943 | $1,773,505 | ||||||||||||||||||||||||||||||||
(4) | This figure is the average of the total compensation paid to our non-PEO NEOs in each listed year, as shown in the SCT of this Proxy Statement and prior year proxy statements for such listed year. The non-PEO NEOs for 2020 to 2022 were Sanjay Kalra, Nimrod Ben-Natan, Neven Haltmayer and Ian Graham;the non-PEO NEOs for 2023 were Walter Jankovic, Nimrod Ben-Natan, Neven Haltmayer, Ian Graham, Sanjay Kalra and Jeremy Rosenberg; and the non-PEO NEOs for 2024 were Timothy Chu, Neven Haltmayer, Walter Jankovic and Ian Graham. |
(5) | Total shareholder return (“TSR”) is calculated by assuming that a $100 investment was made on the last trading day prior to the first fiscal year reported in the table and reinvesting all dividends, if any, until the last day of each listed year. |
(6) | The peer group used is the Nasdaq Telecommunications Index, as used in the Company’s performance graph in our annual report on Form 10-K. Total shareholder return is calculated by assuming that a $100 investment was made on the day prior to the first fiscal year reported in the table and reinvesting all dividends, if any, until the last day of each listed year. |
(7) | The dollar amounts reported are the Company’s net income reflected in the Company’s audited financial statements. |
(8) | In the Company’s assessment, operating profit as reflected in the Company’s audited financial statements is the financial performance measure that is the most important financial performance measure (other than total shareholder return and net income) used by the Company in each of the listed years to link compensation actually paid to performance. Operating profit is determined by subtracting operating expense from gross profit, and gross profit is determined by subtracting cost of revenue from net revenue. |
(1) | The First PEO is our former Chief Executive Officer Patrick Harshman, who resigned in June 2024. Our Second PEO is Nimrod Ben-Natan, who was appointed President and Chief Executive Officer in June 2024 after Mr. Harshman’s departure. |
(4) | This figure is the average of the total compensation paid to our non-PEO NEOs in each listed year, as shown in the SCT of this Proxy Statement and prior year proxy statements for such listed year. The non-PEO NEOs for 2020 to 2022 were Sanjay Kalra, Nimrod Ben-Natan, Neven Haltmayer and Ian Graham;the non-PEO NEOs for 2023 were Walter Jankovic, Nimrod Ben-Natan, Neven Haltmayer, Ian Graham, Sanjay Kalra and Jeremy Rosenberg; and the non-PEO NEOs for 2024 were Timothy Chu, Neven Haltmayer, Walter Jankovic and Ian Graham. |
(6) | The peer group used is the Nasdaq Telecommunications Index, as used in the Company’s performance graph in our annual report on Form 10-K. Total shareholder return is calculated by assuming that a $100 investment was made on the day prior to the first fiscal year reported in the table and reinvesting all dividends, if any, until the last day of each listed year. |
(3) | The CAP does not mean that our PEO was actually paid those amounts in the listed year, or that our non-PEO NEOs were actually paid those amounts averaged and shown in the listed year, but these are dollar amounts derived from the starting point of SCT total compensation under the methodology prescribed under the relevant SEC rules as shown in the adjustment table below. For non-PEO NEOs, the indicated figures in the table show an average of each such figure for all such non-PEO NEOs in each listed year. The methodologies used for determining the fair values shown in the adjustment table below, including use of a Monte-Carlo methodology to determine fair value of TSR awards, are materially consistent with those used to determine the fair values disclosed as of the grant date of such awards. Note that we have not reported any amounts in our SCT with respect to “Change in Pension and Nonqualified Deferred Compensation,” and we do not maintain any defined benefit or actuarial pension plans for our NEO’s. Accordingly, the adjustments with respect to such items prescribed by the pay-versus-performance rules are not relevant to our analysis and no adjustments have been made. |
First PEO | Second PEO | Non-PEO NEOs (average) | |||||||||||||||||||||||||||||||||||||||||||||
2020 | 2021 | 2022 | 2023 | 2024 | 2020 | 2021 | 2022 | 2023 | 2024 | 2020 | 2021 | 2022 | 2023 | 2024 | |||||||||||||||||||||||||||||||||
Summary Compensation Table Total | $3,498,333 | $4,628,135 | $4,831,571 | $5,100,604 | $6,977,354 | $ 1,427,398 | $ 1,583,143 | $ 1,534,449 | $1,889,569 | $8,431,528 | $ 1,280,848 | $2,056,418 | $ 1,580,011 | $1,446,954 | $2,080,150 | ||||||||||||||||||||||||||||||||
Subtract Grant Date Fair Value of Stock Awards Granted in Fiscal Year | $ (2,270,749) | $(3,069,282) | $ (3,116,592) | $ (3,994,583) | $ (6,627,517) | $(775,619) | $(820,691) | $(766,796) | $ (1,404,668) | $ (7,408,105) | $(653,820) | $ (1,271,651) | $(751,151) | $ (1,039,094) | $ (1,406,740) | ||||||||||||||||||||||||||||||||
Add Fair Value at Fiscal Year-End of Outstanding and Unvested Stock Awards Granted in Fiscal Year | $2,475,519 | $5,343,927 | $5,003,296 | $3,690,647 | $6,052,658 | $926,484 | $ 1,276,630 | $ 1,068,619 | $1,231,477 | $8,189,677 | $828,308 | $1,876,882 | $ 1,072,004 | $886,411 | $1,128,760 | ||||||||||||||||||||||||||||||||
Adjust for Change in Fair Value of Outstanding and Unvested Stock Awards Granted in Prior Fiscal Years | $(401,000) | $3,778,266 | $1,957,765 | $9,981 | $(232,840) | $(21,183) | $198,153 | $70,527 | $(2,582) | $(43,057) | $(18,963) | $206,713 | $132,497 | $10,791 | $(16,387) | ||||||||||||||||||||||||||||||||
Adjust for Fair Value at Vesting of Stock Awards Granted in Fiscal Year That Vested During Fiscal Year | $— | $— | $— | $— | $— | $— | $— | $— | $108,012 | $— | $— | $— | $— | $18,002 | $— | ||||||||||||||||||||||||||||||||
Adjust for Change in Fair Value as of Vesting Date of Stock Awards Granted in Prior Fiscal Years For Which Applicable Vesting Conditions Were Satisfied During Fiscal Year | $(278,321) | $187,439 | $(949,597) | $166,741 | $186,802 | $(175,658) | $111,032 | $(135,444) | $34,069 | $791 | $(136,451) | $98,210 | $(145,489) | $13,880 | $(12,277) | ||||||||||||||||||||||||||||||||
Subtract Fair Value as of Prior Fiscal Year-End of Stock Awards Granted in Prior Fiscal Years That Failed to Meet Applicable Vesting Conditions During Fiscal Year | $(95,550) | $— | $— | $— | $— | $(40,950) | $— | $— | $— | $— | $(24,598) | $— | $— | $— | $— | ||||||||||||||||||||||||||||||||
Compensation Actually Paid | $2,928,232 | $ 10,868,485 | $7,726,443 | $4,973,390 | $6,356,458 | $1,340,471 | $ 2,348,267 | $ 1,771,355 | $1,855,876 | $9,170,834 | $ 1,275,324 | $2,966,573 | $ 1,887,872 | $1,336,943 | $1,773,505 | ||||||||||||||||||||||||||||||||
Important Performance Measures
The list below includes financial and certain other performance measures that in our assessment represent the most important performance measures used to link the compensation of our PEO and non-PEO NEOs, for 2024, to Company performance. The performance measures included in this table are not ranked by relative importance. Adjusted EBITDA is a non-GAAP financial measure whereby segment operating income (which excludes stock-based compensation, restructuring and related charges, lease-related and other charges, asset impairment charges and taxes) has been adjusted to exclude depreciation and non-operating expenses.
Most Important Performance Measures | ||
Operating Profit | ||
Broadband Business Adjusted EBITDA | ||
Broadband Business Fiber-to-the-Home (FTTH) revenue | ||
Video Business Adjusted EBITDA | ||
Relative TSR vs. Nasdaq Telecommunications Index | ||