| BANKING ● PRIVATE WEALTH MANAGEMENT ● TRUST SERVICES April 30, 2025 INVESTOR PRESENTATION | FIRST QUARTER 2025 |
| Copyright © 2023 First Foundation Inc. All Rights Reserved 1 Safe Harbor Statement This report includes forward-looking statements within the meaning of the “Safe-Harbor” provisions of the Private Securities Litigation Reform Act of 1995, including forward-looking statements regarding our expectations and beliefs about our future financial performance and financial condition, potential loan sales, as well as trends in our business and markets. Forward-looking statements often include words such as "believe," "expect," "anticipate," "intend," "plan," "estimate," "project," "outlook," or words of similar meaning, or future or conditional verbs such as "will," "would," "should," "could," or "may." The forward-looking statements in this report are based on current information and on assumptions that we make about future events and circumstances that are subject to a number of risks and uncertainties that are often difficult to predict and beyond our control. As a result of those risks and uncertainties, our actual financial results in the future could differ, possibly materially, from those expressed in or implied by the forward-looking statements contained in this report and could cause us to make changes to our future plans. Those risks and uncertainties include, but are not limited to, changes in our capital management and balance sheet strategies and our ability to successfully implement such strategies; changes in our strategic plan, and our ability to successfully implement such plan; recent turnover in our Board of Directors and our executive management team; the risk of incurring credit losses, which is an inherent risk of the banking business; the quality and quantity of our deposits; adverse developments in the financial services industry generally such as bank failures and any related impact on depositor behavior or investor sentiment; risks related to the sufficiency of liquidity; the risk that we will not be able to maintain growth at historic rates or at all; the risk that we will not be able to access the securitization market or otherwise sell loans on favorable terms or at all; the risk that we may not be able to fully utilize our deferred tax asset, and could be required to establish a full or partial valuation allowance, which would result in a charge to operating income; changes in general economic conditions, either nationally or locally in the areas in which we conduct or will conduct our business; risks associated with changes in interest rates, which could adversely affect our interest income, interest rate margins, and the value of our interest-earning assets, and therefore, our future operating results; the risk that the performance of our investment management business or of the equity and bond markets could lead clients to move their funds from or close their investment accounts with us, which would reduce our assets under management and adversely affect our operating results; negative impacts of news or analyst reports about us or the financial services industry; the impacts of inflation on us and our customers; the impacts of tariffs and trade policies of the U.S. and its global trading partners and uncertainty regarding the same; results of examinations by regulatory authorities and the possibility that such regulatory authorities may, among other things, limit our business activities or our ability to pay dividends, or impose fines, penalties or sanctions; the risk that we may be unable or that our board of directors may determine that it is inadvisable to resume the payment of dividends; risks associated with changes in income tax laws and regulations; and risks associated with seeking new client relationships and maintaining existing client relationships. Additional information regarding these and other risks and uncertainties to which our business and future financial performance are subject is contained in our Annual Report on Form 10-K for the fiscal year ended December 31, 2024, and other documents we file with the SEC from time to time. We urge readers of this report to review those reports and other documents we file with the SEC from time to time. Also, our actual financial results in the future may differ from those currently expected due to additional risks and uncertainties of which we are not currently aware or which we do not currently view as, but in the future may become, material to our business or operating results. Due to these and other possible uncertainties and risks, readers are cautioned not to place undue reliance on the forward-looking statements contained in this report, which speak only as of today's date, or to make predictions based solely on historical financial performance. We also disclaim any obligation to update forward-looking statements contained in this report or in the above-referenced reports, whether as a result of new information, future events or otherwise, except as may be required by law or NYSE rules. Non-GAAP Financial Measures This presentation contains both financial measures based on GAAP and non-GAAP based financial measures, which are used when management believes them to be helpful in understanding the Company's results of operations or financial position. These disclosures should not be viewed as a substitute for operating results determined in accordance with GAAP, nor are they necessarily comparable to non-GAAP performance measures that may be presented by other companies. |
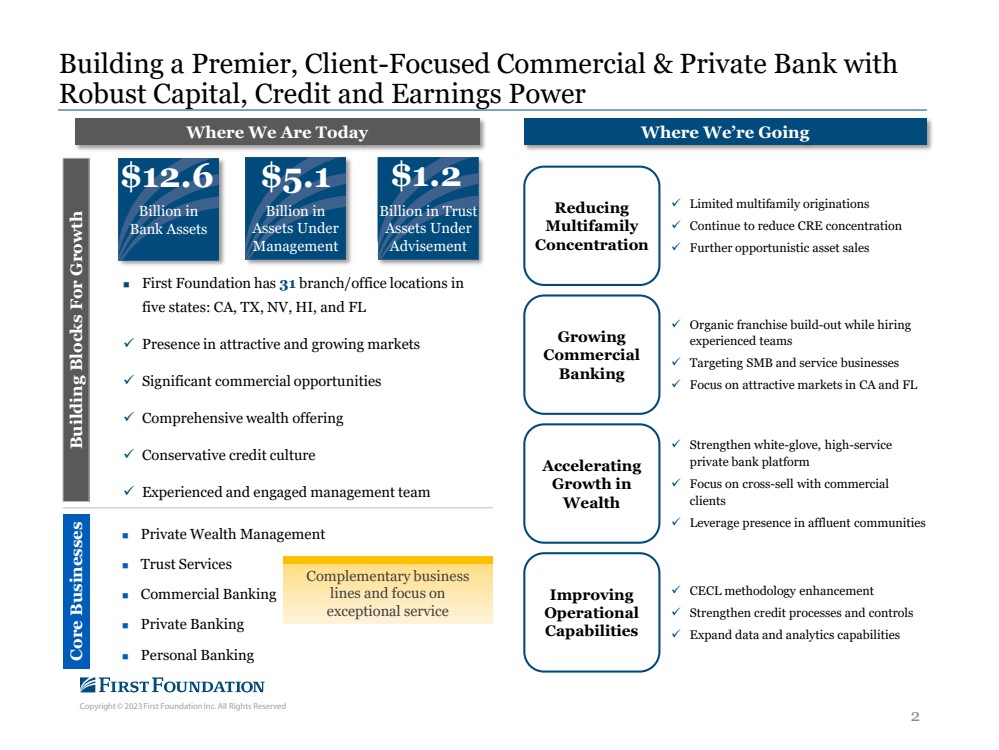
| Copyright © 2023 First Foundation Inc. All Rights Reserved 2 Building a Premier, Client-Focused Commercial & Private Bank with Robust Capital, Credit and Earnings Power Where We Are Today Where We’re Going $5.1 Billion in Assets Under Management $12.6 Billion in Bank Assets $1.2 Billion in Trust Assets Under Advisement Building Blocks For Growth First Foundation has 31 branch/office locations in five states: CA, TX, NV, HI, and FL Presence in attractive and growing markets Significant commercial opportunities Comprehensive wealth offering Conservative credit culture Experienced and engaged management team Reducing Multifamily Concentration Growing Commercial Banking Accelerating Growth in Wealth Improving Operational Capabilities Limited multifamily originations Continue to reduce CRE concentration Further opportunistic asset sales Organic franchise build-out while hiring experienced teams Targeting SMB and service businesses Focus on attractive markets in CA and FL Strengthen white-glove, high-service private bank platform Focus on cross-sell with commercial clients Leverage presence in affluent communities CECL methodology enhancement Strengthen credit processes and controls Expand data and analytics capabilities Core Businesses Private Wealth Management Trust Services Commercial Banking Private Banking Personal Banking Complementary business lines and focus on exceptional service |
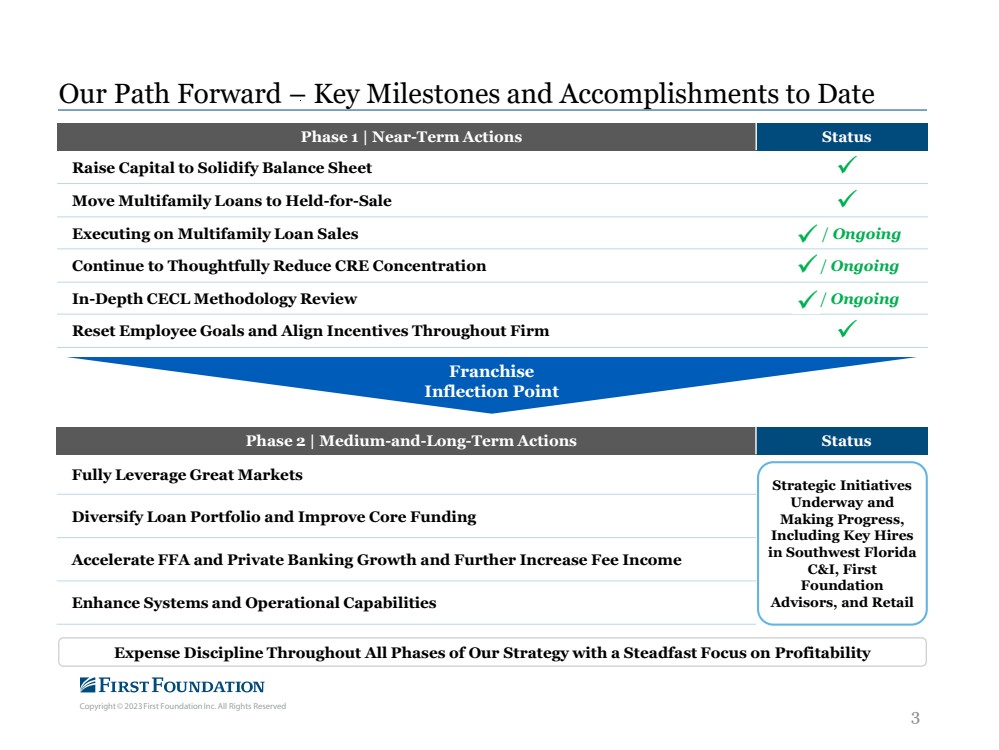
| Copyright © 2023 First Foundation Inc. All Rights Reserved 3 Our Path Forward – Key Milestones and Accomplishments to Date Phase 2 | Medium-and-Long-Term Actions Status Fully Leverage Great Markets Diversify Loan Portfolio and Improve Core Funding Accelerate FFA and Private Banking Growth and Further Increase Fee Income Enhance Systems and Operational Capabilities Phase 1 | Near-Term Actions Status Raise Capital to Solidify Balance Sheet Move Multifamily Loans to Held-for-Sale Executing on Multifamily Loan Sales / Ongoing Continue to Thoughtfully Reduce CRE Concentration / Ongoing In-Depth CECL Methodology Review / Ongoing Reset Employee Goals and Align Incentives Throughout Firm Franchise Inflection Point Strategic Initiatives Underway and Making Progress, Including Key Hires in Southwest Florida C&I, First Foundation Advisors, and Retail Expense Discipline Throughout All Phases of Our Strategy with a Steadfast Focus on Profitability |
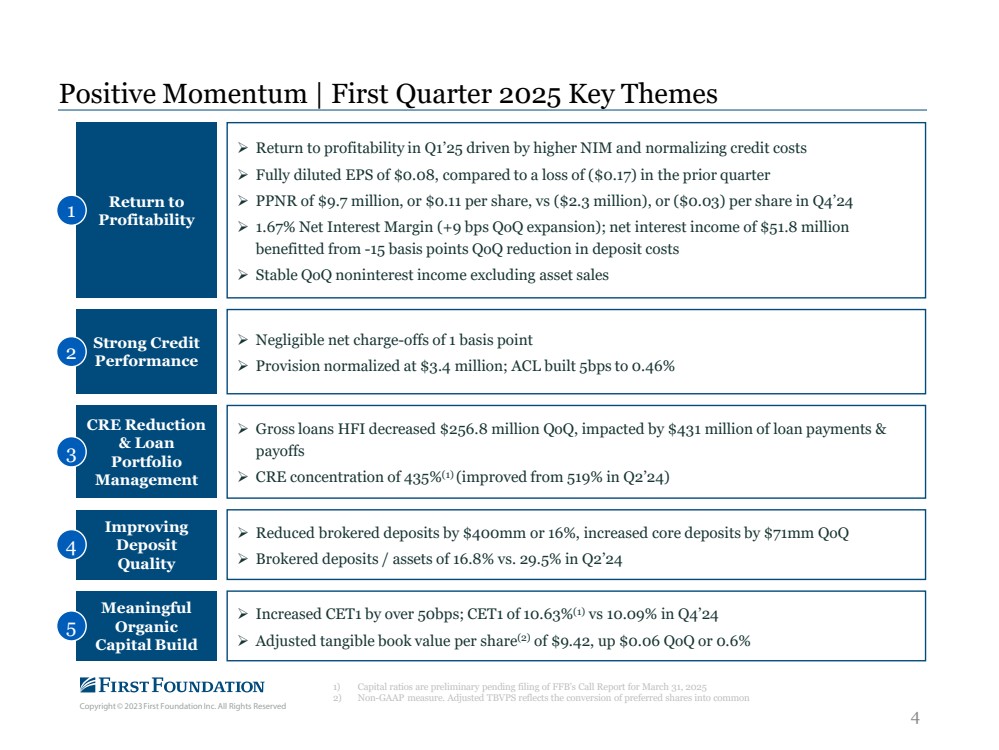
| Copyright © 2023 First Foundation Inc. All Rights Reserved 4 Positive Momentum | First Quarter 2025 Key Themes 1) Capital ratios are preliminary pending filing of FFB’s Call Report for March 31, 2025 2) Non-GAAP measure. Adjusted TBVPS reflects the conversion of preferred shares into common Return to Profitability Return to profitability in Q1’25 driven by higher NIM and normalizing credit costs Fully diluted EPS of $0.08, compared to a loss of ($0.17) in the prior quarter PPNR of $9.7 million, or $0.11 per share, vs ($2.3 million), or ($0.03) per share in Q4’24 1.67% Net Interest Margin (+9 bps QoQ expansion); net interest income of $51.8 million benefitted from -15 basis points QoQ reduction in deposit costs Stable QoQ noninterest income excluding asset sales 1 CRE Reduction & Loan Portfolio Management Gross loans HFI decreased $256.8 million QoQ, impacted by $431 million of loan payments & payoffs CRE concentration of 435%(1) (improved from 519% in Q2’24) 3 Improving Deposit Quality Reduced brokered deposits by $400mm or 16%, increased core deposits by $71mm QoQ Brokered deposits / assets of 16.8% vs. 29.5% in Q2’24 4 Meaningful Organic Capital Build Increased CET1 by over 50bps; CET1 of 10.63%(1) vs 10.09% in Q4’24 Adjusted tangible book value per share(2) of $9.42, up $0.06 QoQ or 0.6% 5 Strong Credit Performance Negligible net charge-offs of 1 basis point Provision normalized at $3.4 million; ACL built 5bps to 0.46% 2 |
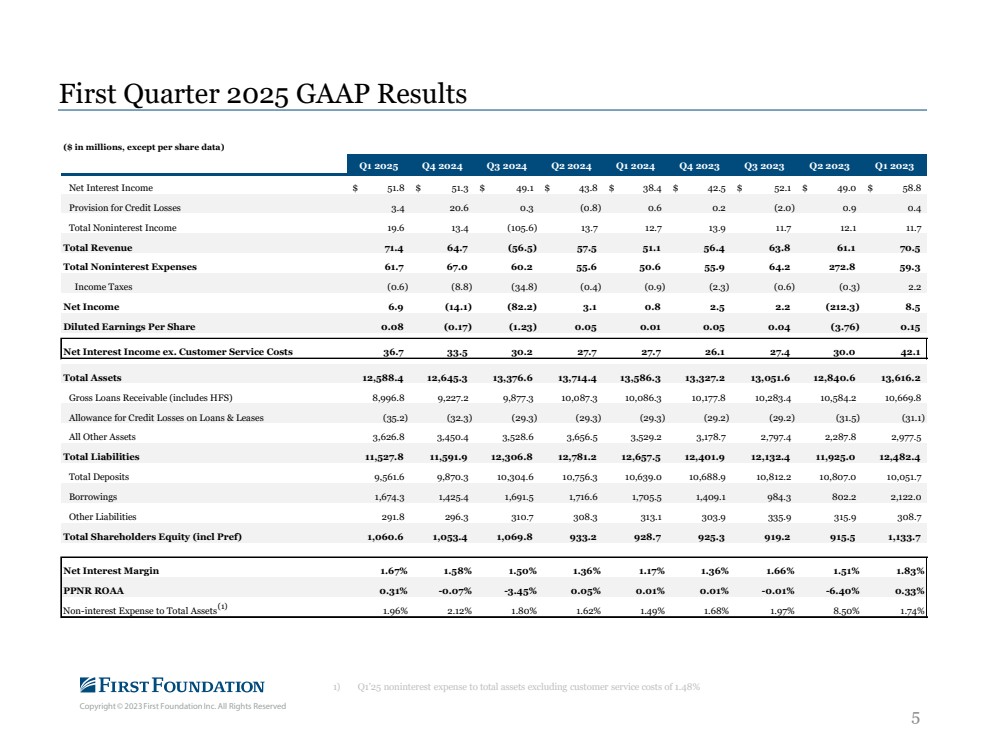
| Copyright © 2023 First Foundation Inc. All Rights Reserved First Foundation, Inc. ($ in millions, except per share data) Q1 2025 Q4 2024 Q3 2024 Q2 2024 Q1 2024 Q4 2023 Q3 2023 Q2 2023 Q1 2023 Net Interest Income $ 51.8 $ 51.3 $ 49.1 $ 43.8 $ 38.4 $ 42.5 $ 52.1 $ 49.0 $ 58.8 Provision for Credit Losses 3.4 20.6 0.3 (0.8) 0.6 0.2 (2.0) 0.9 0.4 Total Noninterest Income 19.6 13.4 (105.6) 13.7 12.7 13.9 11.7 12.1 11.7 Total Revenue 71.4 64.7 (56.5) 57.5 51.1 56.4 63.8 61.1 70.5 Total Noninterest Expenses 61.7 67.0 60.2 55.6 50.6 55.9 64.2 272.8 59.3 Income Taxes (0.6) (8.8) (34.8) (0.4) (0.9) (2.3) (0.6) (0.3) 2.2 Net Income 6.9 (14.1) (82.2) 3.1 0.8 2.5 2.2 (212.3) 8.5 Diluted Earnings Per Share 0.08 (0.17) (1.23) 0.05 0.01 0.05 0.04 (3.76) 0.15 Net Interest Income ex. Customer Service Costs 36.7 33.5 30.2 27.7 27.7 26.1 27.4 30.0 42.1 Total Assets 12,588.4 12,645.3 13,376.6 13,714.4 13,586.3 13,327.2 13,051.6 12,840.6 13,616.2 Gross Loans Receivable (includes HFS) 8,996.8 9,227.2 9,877.3 10,087.3 10,086.3 10,177.8 10,283.4 10,584.2 10,669.8 Allowance for Credit Losses on Loans & Leases (35.2) (32.3) (29.3) (29.3) (29.3) (29.2) (29.2) (31.5) (31.1) All Other Assets 3,626.8 3,450.4 3,528.6 3,656.5 3,529.2 3,178.7 2,797.4 2,287.8 2,977.5 Total Liabilities 11,527.8 11,591.9 12,306.8 12,781.2 12,657.5 12,401.9 12,132.4 11,925.0 12,482.4 Total Deposits 9,561.6 9,870.3 10,304.6 10,756.3 10,639.0 10,688.9 10,812.2 10,807.0 10,051.7 Borrowings 1,674.3 1,425.4 1,691.5 1,716.6 1,705.5 1,409.1 984.3 802.2 2,122.0 Other Liabilities 291.8 296.3 310.7 308.3 313.1 303.9 335.9 315.9 308.7 Total Shareholders Equity (incl Pref) 1,060.6 1,053.4 1,069.8 933.2 928.7 925.3 919.2 915.5 1,133.7 Net Interest Margin 1.67% 1.58% 1.50% 1.36% 1.17% 1.36% 1.66% 1.51% 1.83% PPNR ROAA 0.31% -0.07% -3.45% 0.05% 0.01% 0.01% -0.01% -6.40% 0.33% Non-interest Expense to Total Assets 1.96% 2.12% 1.80% 1.62% 1.49% 1.68% 1.97% 8.50% 1.74% 5 First Quarter 2025 GAAP Results (1) 1) Q1’25 noninterest expense to total assets excluding customer service costs of 1.48% |
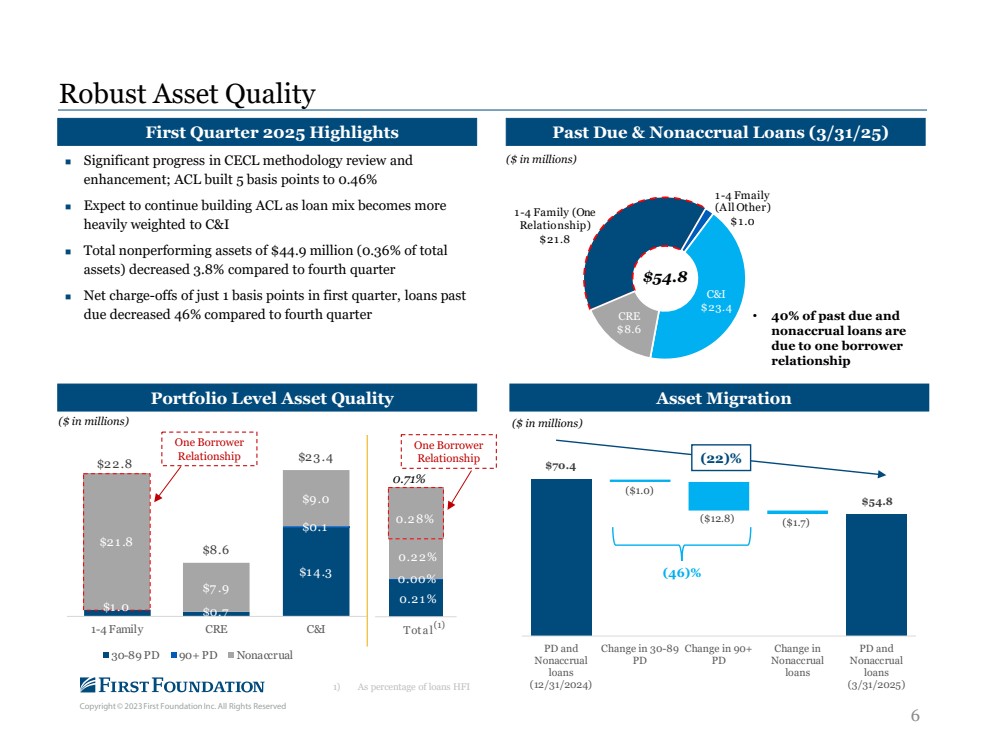
| Copyright © 2023 First Foundation Inc. All Rights Reserved 6 Robust Asset Quality 1) As percentage of loans HFI $1 .0 $0.7 $1 4.3 $0.1 $21 .8 $7 .9 $9.0 $22.8 $8.6 $23.4 1-4 Family CRE C&I 30-89 PD 90+ PD Nonaccrual ACL First Quarter 2025 Highlights Significant progress in CECL methodology review and enhancement; ACL built 5 basis points to 0.46% Expect to continue building ACL as loan mix becomes more heavily weighted to C&I Total nonperforming assets of $44.9 million (0.36% of total assets) decreased 3.8% compared to fourth quarter Net charge-offs of just 1 basis points in first quarter, loans past due decreased 46% compared to fourth quarter Past Due & Nonaccrual Loans (3/31/25) Portfolio Level Asset Quality ($ in millions) ($ in millions) ($ in millions) Asset Migration $54.8 • 40% of past due and nonaccrual loans are due to one borrower relationship (22)% 1 -4 Family (One Relationship) $21.8 1 -4 Fmaily (All Other) $1.0 C&I $23.4 CRE $8.6 One Borrower Relationship 0.21 % 0.00% 0.22% 0.28% Tota l(1) 0.71% One Borrower Relationship $70.4 $54.8 ($1.0) ($12.8) ($1.7) PD and Nonaccrual loans (12/31/2024) Change in 30-89 PD Change in 90+ PD Change in Nonaccrual loans PD and Nonaccrual loans (3/31/2025) (46)% |
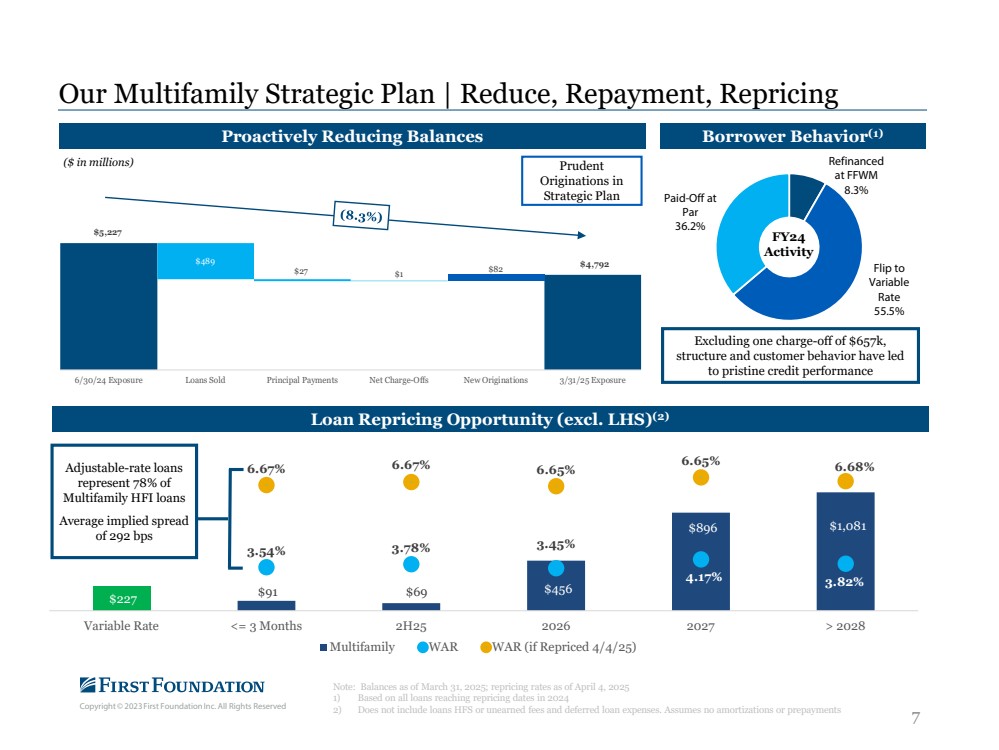
| Copyright © 2023 First Foundation Inc. All Rights Reserved 7 Our Multifamily Strategic Plan | Reduce, Repayment, Repricing Note: Balances as of March 31, 2025; repricing rates as of April 4, 2025 1) Based on all loans reaching repricing dates in 2024 2) Does not include loans HFS or unearned fees and deferred loan expenses. Assumes no amortizations or prepayments $227 $91 $69 $456 $896 $1,081 3.54% 3.78% 3.45% 4.17% 3.82% 6.67% 6.67% 6.65% 6.65% 6.68% Variable Rate <= 3 Months 2H25 2026 2027 > 2028 Multifamily WAR WAR (if Repriced 4/4/25) Loan Repricing Opportunity (excl. LHS)(2) Adjustable-rate loans represent 78% of Multifamily HFI loans Average implied spread of 292 bps Refinanced at FFWM 8.3% Flip to Variable Rate 55.5% Paid-Off at Par 36.2% FY24 Activity ($ in millions) Proactively Reducing Balances Borrower Behavior(1) Excluding one charge-off of $657k, structure and customer behavior have led to pristine credit performance Prudent Originations in Strategic Plan $5,227 $4,792 $82 $489 $27 $1 6/30/24 Exposure Loans Sold Principal Payments Net Charge-Offs New Originations 3/31/25 Exposure |
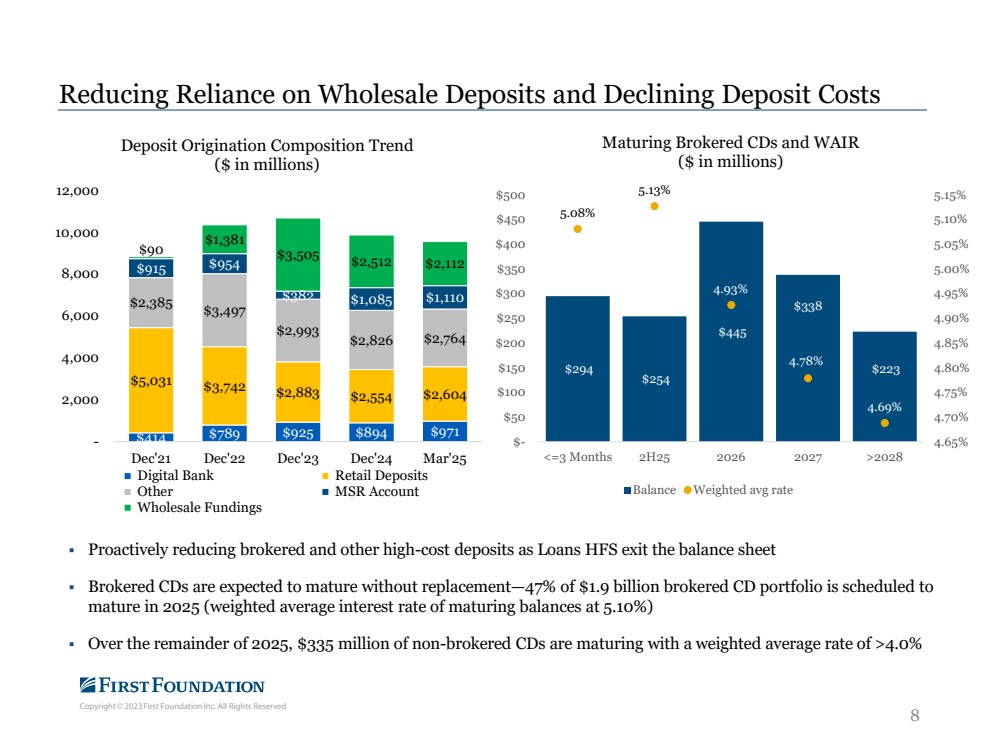
| Copyright © 2023 First Foundation Inc. All Rights Reserved 8 Reducing Reliance on Wholesale Deposits and Declining Deposit Costs Proactively reducing brokered and other high-cost deposits as Loans HFS exit the balance sheet Brokered CDs are expected to mature without replacement—47% of $1.9 billion brokered CD portfolio is scheduled to mature in 2025 (weighted average interest rate of maturing balances at 5.10%) Over the remainder of 2025, $335 million of non-brokered CDs are maturing with a weighted average rate of >4.0% $414 $789 $925 $894 $971 $5,031 $3,742 $2,883 $2,554 $2,604 $2,385 $3,497 $2,993 $2,826 $2,764 $915 $954 $382 $1,085 $1,110 $90 $1,381 $3,505 $2,512 $2,112 - 2,000 4,000 6,000 8,000 10,000 12,000 Dec'21 Dec'22 Dec'23 Dec'24 Mar'25 Deposit Origination Composition Trend ($ in millions) Digital Bank Retail Deposits Other MSR Account Wholesale Fundings $294 $254 $445 $338 $223 5.08% 5.13% 4.93% 4.78% 4.69% 4.65% 4.70% 4.75% 4.80% 4.85% 4.90% 4.95% 5.00% 5.05% 5.10% 5.15% $- $50 $100 $150 $200 $250 $300 $350 $400 $450 $500 <=3 Months 2H25 2026 2027 >2028 Maturing Brokered CDs and WAIR ($ in millions) Balance Weighted avg rate |
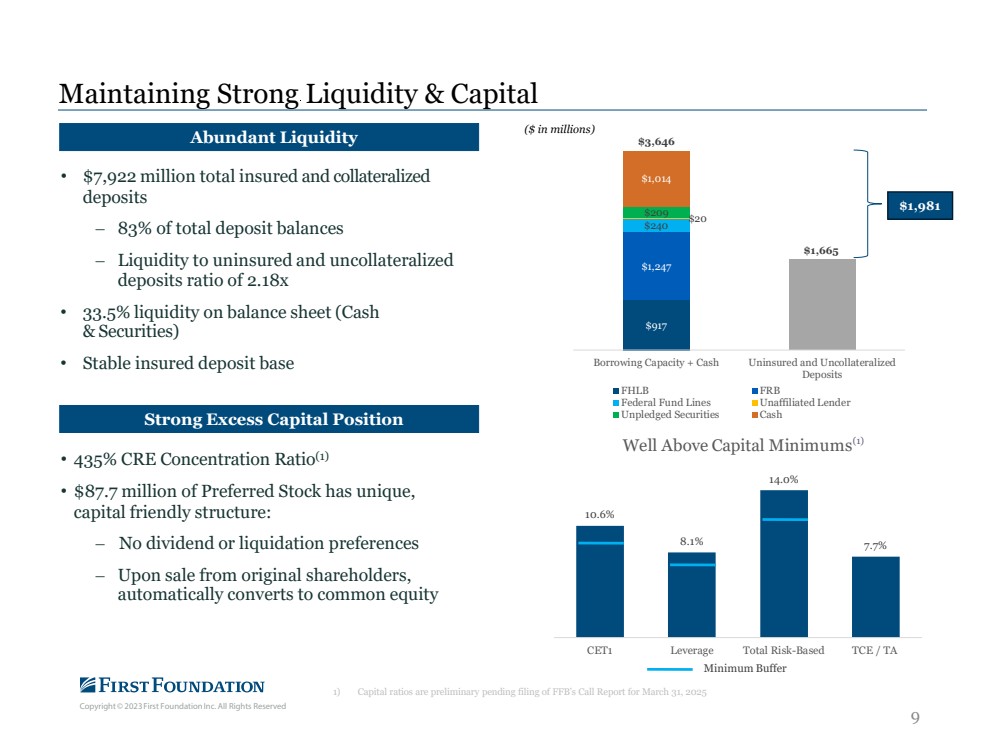
| Copyright © 2023 First Foundation Inc. All Rights Reserved 9 Maintaining Strong Liquidity & Capital • $7,922 million total insured and collateralized deposits ‒ 83% of total deposit balances ‒ Liquidity to uninsured and uncollateralized deposits ratio of 2.18x • 33.5% liquidity on balance sheet (Cash & Securities) • Stable insured deposit base • 435% CRE Concentration Ratio(1) • $87.7 million of Preferred Stock has unique, capital friendly structure: ‒ No dividend or liquidation preferences ‒ Upon sale from original shareholders, automatically converts to common equity Abundant Liquidity Strong Excess Capital Position 10.6% 8.1% 14.0% 7.7% CET1 Leverage Total Risk-Based TCE / TA Well Above Capital Minimums Minimum Buffer $1,981 ($ in millions) $917 $1,665 $1,247 $240 $20 $209 $1,014 $3,646 Borrowing Capacity + Cash Uninsured and Uncollateralized Deposits FHLB FRB Federal Fund Lines Unaffiliated Lender Unpledged Securities Cash (1) 1) Capital ratios are preliminary pending filing of FFB’s Call Report for March 31, 2025 |
| Copyright © 2023 First Foundation Inc. All Rights Reserved 1.17% 1.36% 1.50% 1.58% 1.67% 1.80% - 1.90% 2.10% - 2.20% 2.60% - 2.70% 5.50% 5.50% 5.00% 4.50% 4.50% 4.28% 4.30% 4.29% 4.04% 3.84% Q1 '24 Q2 '24 Q3 '24 Q4 '24 Q1 '25 Q4 '25 Q4 '26 Q4 '27 10 Accelerating NIM Momentum After 2025 Fed Funds Rate Interest-Bearing Deposit Costs Reflects NIM Guidance Range Net Interest Margin Drivers Net Interest Margin expected to increase through FY 2025 with acceleration in FY 2026 and beyond Proactively lowering funding cost by reducing high-cost funding Multifamily loan repricing will drive higher yields Commercial Banking growth leading to higher yielding balances |
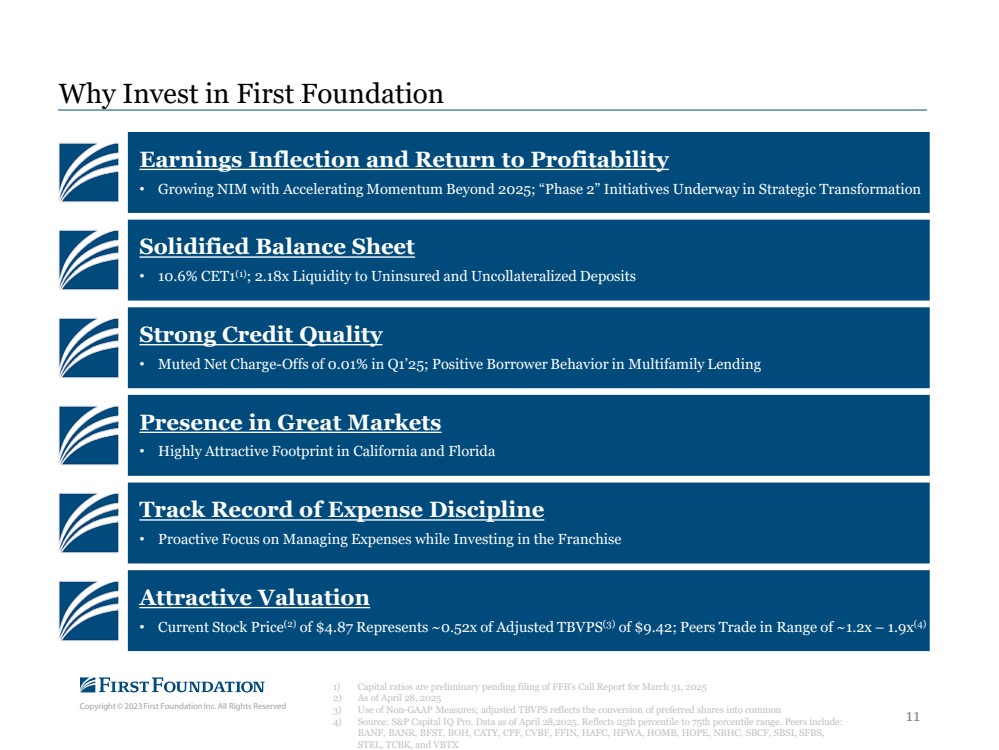
| Copyright © 2023 First Foundation Inc. All Rights Reserved Earnings Inflection and Return to Profitability • Growing NIM with Accelerating Momentum Beyond 2025; “Phase 2” Initiatives Underway in Strategic Transformation Solidified Balance Sheet • 10.6% CET1(1); 2.18x Liquidity to Uninsured and Uncollateralized Deposits Strong Credit Quality • Muted Net Charge-Offs of 0.01% in Q1’25; Positive Borrower Behavior in Multifamily Lending Presence in Great Markets • Highly Attractive Footprint in California and Florida Track Record of Expense Discipline • Proactive Focus on Managing Expenses while Investing in the Franchise Attractive Valuation • Current Stock Price(2) of $4.87 Represents ~0.52x of Adjusted TBVPS(3) of $9.42; Peers Trade in Range of ~1.2x – 1.9x(4) Why Invest in First Foundation 1) Capital ratios are preliminary pending filing of FFB’s Call Report for March 31, 2025 2) As of April 28, 2025 3) Use of Non-GAAP Measures; adjusted TBVPS reflects the conversion of preferred shares into common 4) Source: S&P Capital IQ Pro. Data as of April 28,2025. Reflects 25th percentile to 75th percentile range. Peers include: BANF, BANR, BFST, BOH, CATY, CPF, CVBF, FFIN, HAFC, HFWA, HOMB, HOPE, NBHC, SBCF, SBSI, SFBS, STEL, TCBK, and VBTX 11 |
| Copyright © 2023 First Foundation Inc. All Rights Reserved Appendix 12 |
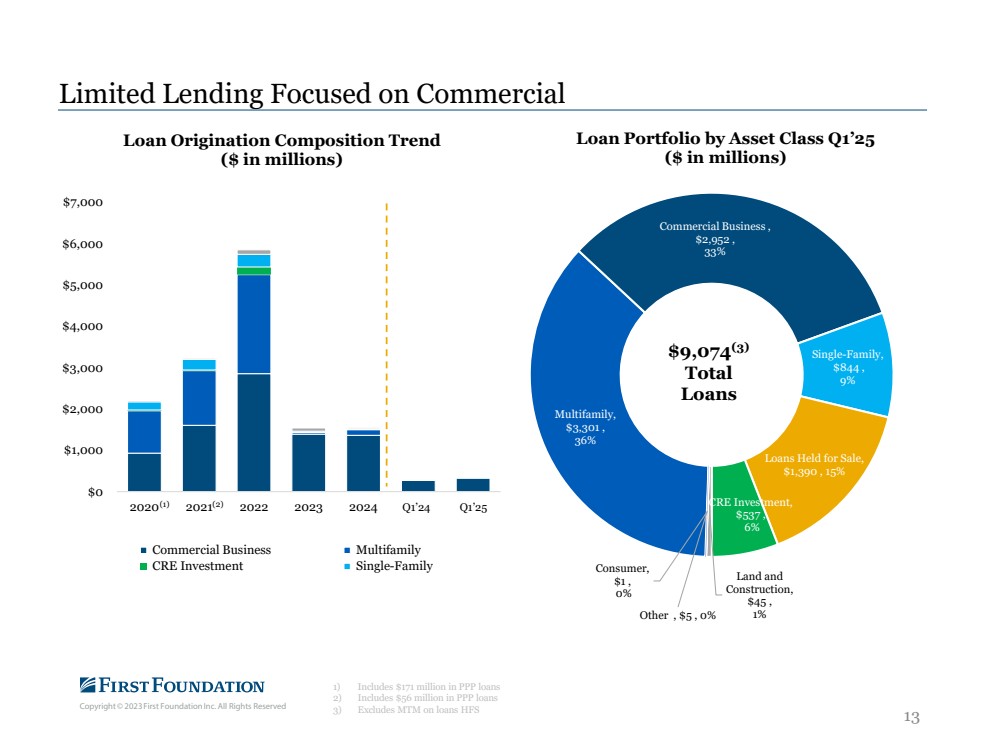
| Copyright © 2023 First Foundation Inc. All Rights Reserved 13 Limited Lending Focused on Commercial 1) Includes $171 million in PPP loans 2) Includes $56 million in PPP loans 3) Excludes MTM on loans HFS $0 $1,000 $2,000 $3,000 $4,000 $5,000 $6,000 $7,000 2020 2021 2022 2023 2024 1Q24 1Q25 Loan Origination Composition Trend ($ in millions) Commercial Business Multifamily CRE Investment Single-Family (1) (2) Multifamily, $3,301 , 36% Commercial Business , $2,952 , 33% Single-Family, $844 , 9% Loans Held for Sale, $1,390 , 15% CRE Investment, $537 , 6% Land and Construction, $45 , 1% Consumer, $1 , 0% Other , $5 , 0% Loan Portfolio by Asset Class Q1’25 ($ in millions) $9,074(3) Total Loans Q1’24 Q1’25 |
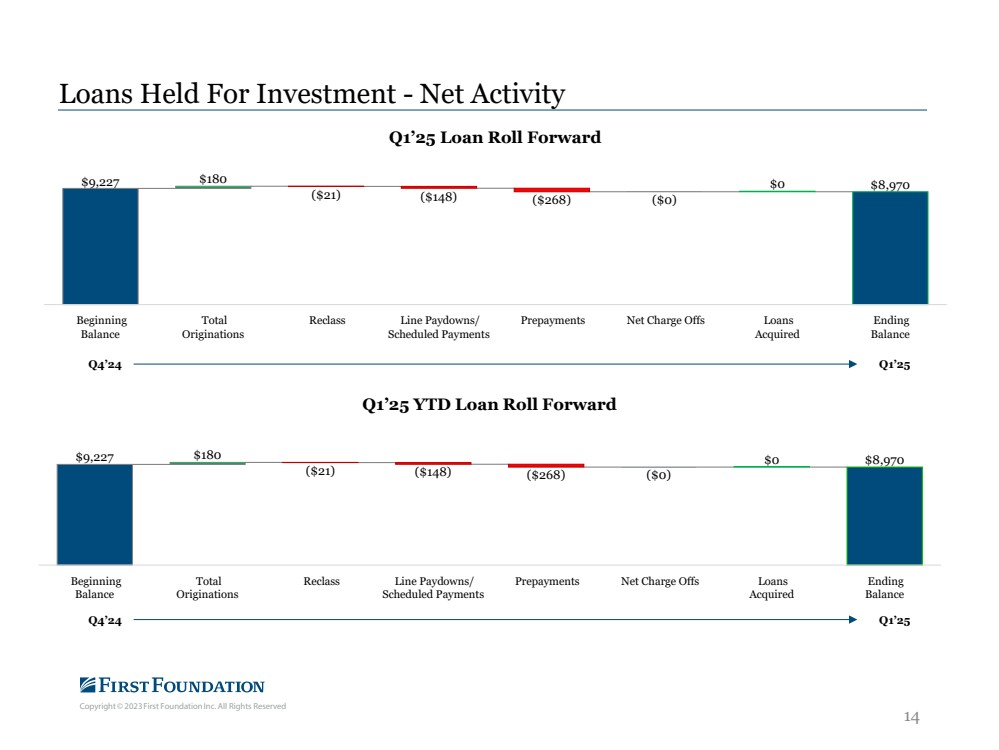
| Copyright © 2023 First Foundation Inc. All Rights Reserved 14 Loans Held For Investment - Net Activity Q4’24 Q1’25 $9,227 $180 ($21) ($148) ($268) ($0) $0 $8,970 Beginning Balance Total Originations Reclass Line Paydowns/ Scheduled Payments Prepayments Net Charge Offs Loans Acquired Ending Balance Q1’25 Loan Roll Forward $9,227 ($21) ($148) ($268) ($0) $0 $8,970 $180 Beginning Balance Total Originations Reclass Line Paydowns/ Scheduled Payments Prepayments Net Charge Offs Loans Acquired Ending Balance Q1’25 YTD Loan Roll Forward Q4’24 Q1’25 |
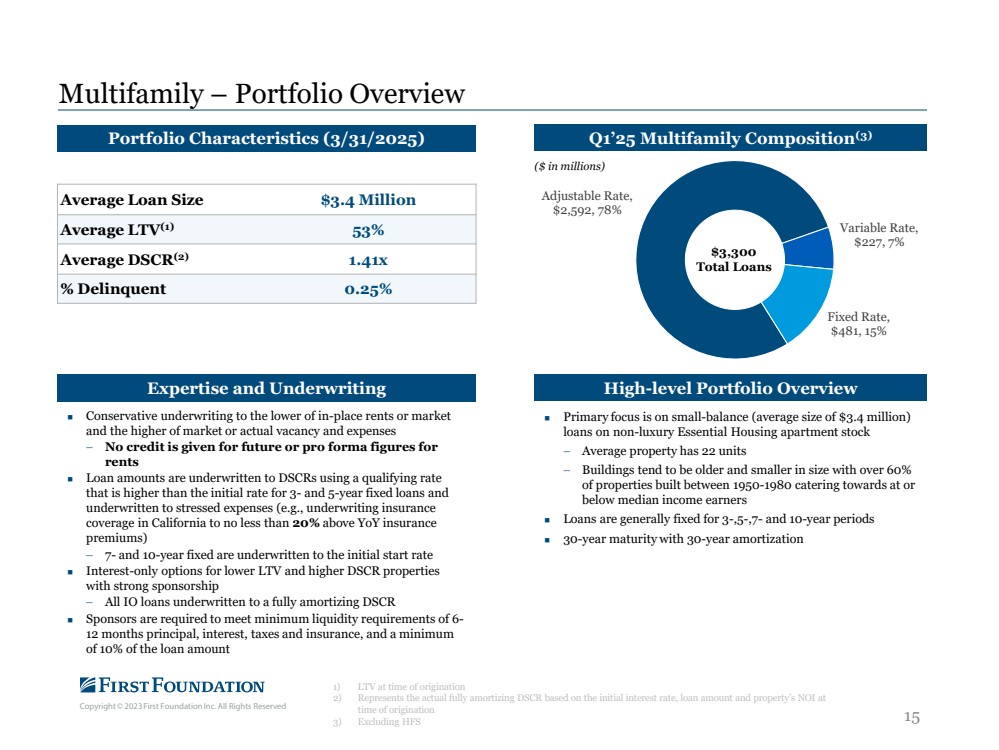
| Copyright © 2023 First Foundation Inc. All Rights Reserved 15 Multifamily – Portfolio Overview 1) LTV at time of origination 2) Represents the actual fully amortizing DSCR based on the initial interest rate, loan amount and property’s NOI at time of origination 3) Excluding HFS Adjustable Rate, $2,592, 78% Variable Rate, $227, 7% Fixed Rate, $481, 15% Portfolio Characteristics (3/31/2025) Average Loan Size $3.4 Million Average LTV(1) 53% Average DSCR(2) 1.41x % Delinquent 0.25% Q1’25 Multifamily Composition(3) Primary focus is on small-balance (average size of $3.4 million) loans on non-luxury Essential Housing apartment stock − Average property has 22 units − Buildings tend to be older and smaller in size with over 60% of properties built between 1950-1980 catering towards at or below median income earners Loans are generally fixed for 3-,5-,7- and 10-year periods 30-year maturity with 30-year amortization Conservative underwriting to the lower of in-place rents or market and the higher of market or actual vacancy and expenses − No credit is given for future or pro forma figures for rents Loan amounts are underwritten to DSCRs using a qualifying rate that is higher than the initial rate for 3- and 5-year fixed loans and underwritten to stressed expenses (e.g., underwriting insurance coverage in California to no less than 20% above YoY insurance premiums) − 7- and 10-year fixed are underwritten to the initial start rate Interest-only options for lower LTV and higher DSCR properties with strong sponsorship − All IO loans underwritten to a fully amortizing DSCR Sponsors are required to meet minimum liquidity requirements of 6- 12 months principal, interest, taxes and insurance, and a minimum of 10% of the loan amount Expertise and Underwriting High-level Portfolio Overview $3,300 Total Loans ($ in millions) |
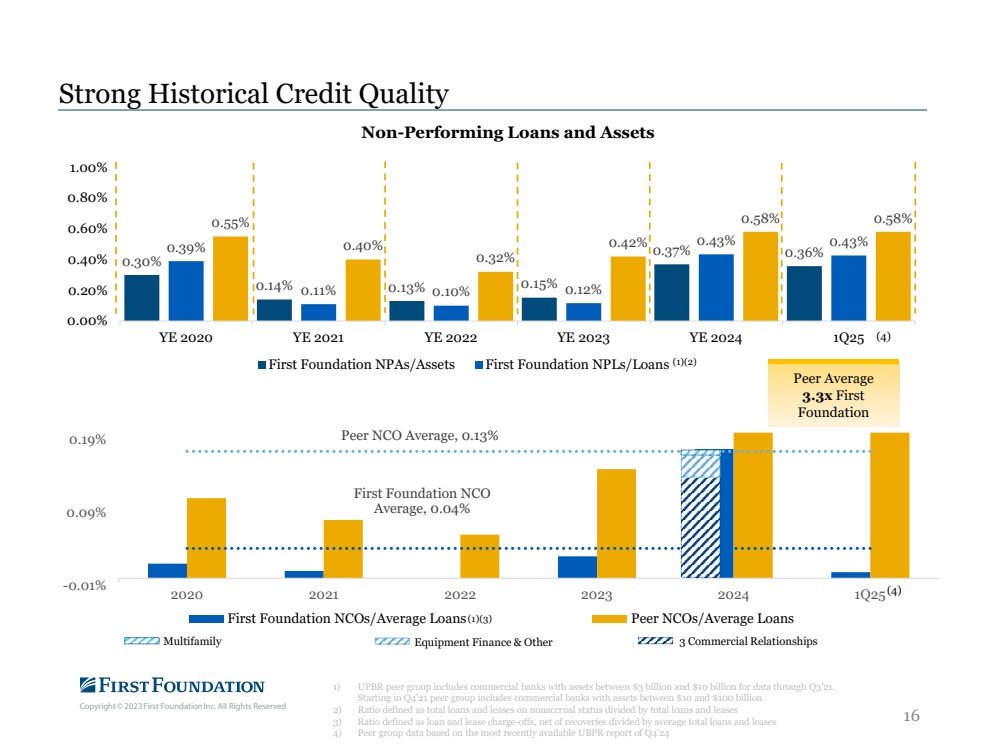
| Copyright © 2023 First Foundation Inc. All Rights Reserved 16 Strong Historical Credit Quality 1) UPBR peer group includes commercial banks with assets between $3 billion and $10 billion for data through Q3’21. Starting in Q4’21 peer group includes commercial banks with assets between $10 and $100 billion 2) Ratio defined as total loans and leases on nonaccrual status divided by total loans and leases 3) Ratio defined as loan and lease charge-offs, net of recoveries divided by average total loans and leases 4) Peer group data based on the most recently available UBPR report of Q4’24 First Foundation NCO Average, 0.04% Peer NCO Average, 0.13% -0.01% 0.09% 0.19% 0.29% 2020 2021 2022 2023 2024 1Q25 Net Charge-offs (NCOs)/Average Loans First Foundation NCOs/Average Loans Peer NCOs/Average Loans 0.30% 0.14% 0.13% 0.15% 0.39% 0.37% 0.36% 0.11% 0.10% 0.12% 0.43% 0.43% 0.55% 0.40% 0.32% 0.42% 0.58% 0.58% 0.00% 0.20% 0.40% 0.60% 0.80% 1.00% YE 2020 YE 2021 YE 2022 YE 2023 YE 2024 1Q25 Non-Performing Loans and Assets First Foundation NPAs/Assets First Foundation NPLs/Loans (4) (4) (1)(2) (1)(3) Peer Average 3.3x First Foundation Multifamily Equipment Finance & Other 3 Commercial Relationships |
| Copyright © 2023 First Foundation Inc. All Rights Reserved 17 Tangible Book Value Per Share Reconciliation 1) Use of Non-GAAP Measures; adjusted TBVPS reflects the conversion of preferred shares into common Tangible Book Value Per share The $228 million July 2024 Capital Raise strengthened capital and increased go-forward flexibility TBV per share (as adjusted) reflects the conversion of remaining Series A preferred shares, adding $87.6 million of common equity and 29.8 million common shares $14.92 $16.20 $16.30 $9.36 $9.42 YE 2021 YE 2022 YE 2023 YE 2024 1Q25 TBV Per Share (as adjusted)(1) GAAP Tangible Book Value Per Share Tangible Book Value Per Share (as adjusted) Shareholders Common Equity $972,962.0 Shareholders Common Equity $972,962.0 Less: Intangible Assets $3,245.0 Convertibe Preferred Equity $87,649.0 Tangible Common Equity (TCE) $969,717.0 Less: Intangible Assets $3,245.0 Adjusted Tangible Common Equity (TCE) $1,057,366 Common Shares Outstanding 82,386,071 Common Shares Outstanding 82,386,071 Tangible Book Value Per Share $11.77 Common Shares Underlying the Series B Preferred Shares 29,811,000 Basic Common Shares Outstanding Upon Conversion (Adjusted) 112,197,071 Tangible Book Value Per Share (as adjusted)(1) $9.42 |
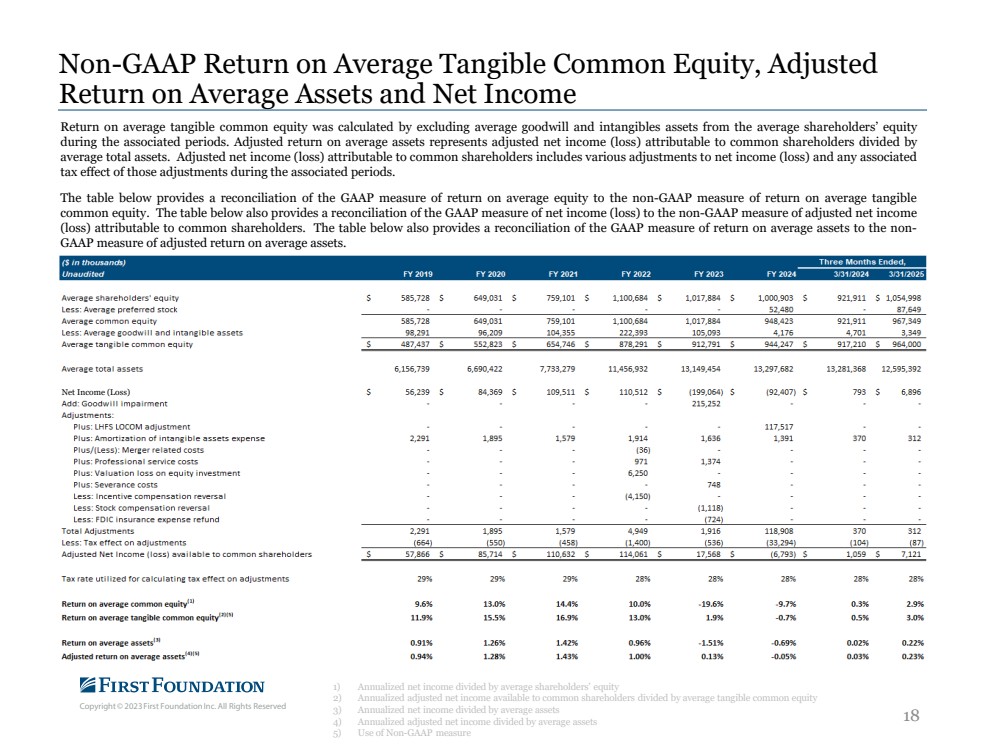
| Copyright © 2023 First Foundation Inc. All Rights Reserved 18 Non-GAAP Return on Average Tangible Common Equity, Adjusted Return on Average Assets and Net Income 1) Annualized net income divided by average shareholders’ equity 2) Annualized adjusted net income available to common shareholders divided by average tangible common equity 3) Annualized net income divided by average assets 4) Annualized adjusted net income divided by average assets 5) Use of Non-GAAP measure Return on average tangible common equity was calculated by excluding average goodwill and intangibles assets from the average shareholders’ equity during the associated periods. Adjusted return on average assets represents adjusted net income (loss) attributable to common shareholders divided by average total assets. Adjusted net income (loss) attributable to common shareholders includes various adjustments to net income (loss) and any associated tax effect of those adjustments during the associated periods. The table below provides a reconciliation of the GAAP measure of return on average equity to the non-GAAP measure of return on average tangible common equity. The table below also provides a reconciliation of the GAAP measure of net income (loss) to the non-GAAP measure of adjusted net income (loss) attributable to common shareholders. The table below also provides a reconciliation of the GAAP measure of return on average assets to the non-GAAP measure of adjusted return on average assets. Net Income (Loss) |
| Copyright © 2023 First Foundation Inc. All Rights Reserved 19 Non-GAAP Tangible Common Equity Ratio, Tangible Book Value Per Share, And Adjusted Earnings (Loss) Per Share Tangible shareholders’ equity, tangible common equity to tangible asset ratio, tangible common equity, tangible book value per share, and adjusted earnings (loss) per share (basic and diluted) are non-GAAP financial measurements determined by methods other than in accordance with U.S. GAAP. Tangible common equity is calculated by taking shareholder’s equity and subtracting preferred stock, goodwill and intangible assets. Tangible common equity to tangible asset ratio is calculated by taking tangible common equity and dividing by tangible assets which is total assets excluding the balance of goodwill and intangible assets. Tangible book value per common share is calculated by dividing tangible common equity by basic common shares outstanding, as compared to book value per share, which is calculated by dividing shareholders’ equity by basic common shares outstanding. Adjusted earnings (loss) per share (basic and diluted) is calculated by dividing adjusted net income (loss) attributable to common shareholders by average common shares outstanding (basic and diluted). The reconciliation of GAAP net (loss) income to adjusted net income (loss) attributable to common shareholders is presented on slide 18 in “Non-GAAP Return on Average Tangible Common Equity (ROATCE), Adjusted Return on Average Assets and Net Income.” The table below provides a reconciliation of the GAAP measure of shareholders’ equity to tangible shareholders’ equity and tangible common equity. The table below also provides a reconciliation of the GAAP measure of equity to asset ratio to the non-GAAP measure of tangible common equity to tangible assets ratio. The table below also provides a reconciliation of GAAP measure of book value per share to the non-GAAP measure of tangible book value per common share. The table below also provides a reconciliation of the GAAP measure of net (loss) income per share (basic and diluted) to the non-GAAP measure of adjusted earnings (loss) per share (basic and diluted). $0.09 83,434,754 |
| Copyright © 2023 First Foundation Inc. All Rights Reserved firstfoundationinc.com |
