Pay vs Performance Disclosure - USD ($)
Dec. 31, 2024
Dec. 31, 2023
Dec. 31, 2022
Dec. 31, 2021
Dec. 31, 2020
Pay Versus Performance Disclosure
The Compensation Discussion and Analysis section of this proxy statement describes our compensation program, objectives and policies for our Chief Executive Officer and other Named Executive Officers for the 2024 performance year. As required by Item 402(v) (the “Rule”) of Regulation
S-K,
the following sets forth information regarding compensation of our principal executive officer (the “PEO), and our other non-PEO
Named Executive Officers. In accordance with the Rule, the table below and the discussion that follows includes an amount referred to as “compensation actually paid” as defined in Item 402(v)(2)(iii). The calculation of this amount includes, among other things, the revaluation of unvested and outstanding equity awards. In accordance with the Rule, the revaluation of stock awards includes, as applicable: ∎ |
the year-end fair value of the awards granted in the covered fiscal year (e.g., 2024) that are outstanding and unvested as of the end of the covered fiscal year; |
∎ |
the change in fair value from the end of the prior fiscal year (e.g., 2023) to the end of the covered fiscal year with respect to any awards granted in prior years that are outstanding and unvested as of the end of the covered fiscal year; |
∎ |
the fair value, as of the vesting date, of any awards that were granted and vested in the same covered year; |
∎ |
the change in fair value from the end of the prior fiscal year to the vesting date or forfeiture date with respect to any awards granted in prior years that vested or failed to vest, as applicable, in the covered fiscal year; and |
∎ |
the dollar value of any dividends or other earnings paid on awards in the covered fiscal year prior to the vesting date that are not otherwise included in the total compensation for the covered fiscal year. |
| Year |
Summary Compensation Table Total for Katharine A. Keenan (1) ($) |
Compensation Actually Paid to Katharine A. Keenan (2) ($) |
Summary Compensation Table Total for Stephen D. Plavin (1) ($) |
Compensation Actually Paid to Stephen A. Plavin ($) |
Average Summary Compensation Table Total for Non-PEO Named Executive Officers (3),(4) ($) |
Average Compensation Actually Paid to Non-PEO Named Executive Officers (3),(4),(5) ($) |
Value of Initial Fixed $100 Investment Based On: (6) |
Net Income (8) ($ in millions) |
Distributable Earnings (9) ($ in millions) |
|||||||||||||||||||||||||||||||
| Total Shareholder Return ($) |
Peer Group Total Shareholder Return (7) ($) |
|||||||||||||||||||||||||||||||||||||||
| 2024 |
990,854 | 762,181 | — | — | 229,320 | 176,681 | 78 | 80 | (204.1 | ) | (5.5 | ) | ||||||||||||||||||||||||||||
| 2023 |
1,167,400 | 1,293,085 | — | — | 269,400 | 299,595 | 85 | 80 | 246.6 | 526.3 | ||||||||||||||||||||||||||||||
| 2022 |
1,284,920 | 761,432 | — | — | 148,260 | (325,341 | ) | 75 | 69 | 248.6 | 489.8 | |||||||||||||||||||||||||||||
| 2021 |
1,620,840 | 1,860,444 | — | 457,734 | 483,135 | 637,264 | 99 | 94 | 419.2 | 396.7 | ||||||||||||||||||||||||||||||
| 2020 |
— | — | 928,556 | 130,062 | 811,124 | 470,503 | 82 | 81 | 137.7 | 352.0 | ||||||||||||||||||||||||||||||
(1) |
The dollar amounts reported in this column are the amounts of total compensation reported for Ms. Keenan for 2024, 2023, 2022 and 2021, and Stephen D. Plavin for 2021 and 2020, who served as our Chief Executive Officer, for the applicable corresponding year as reported in the “Total” column of the “Summary Compensation Table” for such corresponding year’s proxy statement. Mr. Plavin resigned as Chief Executive Officer of the Company effective June 30, 2021 and did not receive any compensation from the Company in 2021, 2022, 2023 or 2024 for service as an officer of the Company as reported in the Summary Compensation Table. For 2021, only that portion of Mr. Plavin’s compensation that was earned or paid to him in connection with his role as CEO of the Company and relating to his previously granted equity awards is included in the calculation of “compensation actually paid” to Mr. Plavin. |
(2) |
In accordance with the requirements of Item 402(v)(2)(iii) of Regulation S-K, the following adjustments were made to the amounts reported for Ms. Keenan as Chief Executive Officer in the Summary Compensation Table. Importantly, the dollar amounts do not reflect the actual amount of compensation earned by, or paid to, our Chief Executive Officer during the applicable year. |
| Description |
2024 ($) |
|||
| Reported Summary Compensation Total |
990,854 | |||
| Value of Stock Awards Reported in the Summary Compensation Table Deduction |
(990,854 | ) | ||
| Stock Awards Adjustment (a) |
762,181 | |||
| |
|
|||
| Compensation Actually Paid |
762,181 | |||
| (a) | The amounts added or deducted in calculated stock award adjustments include: |
| Year |
Year End Fair Value of Unvested Equity Awards Granted in the Covered Year |
Year over Year Change in Fair Value of Outstanding and Unvested Equity Awards |
Fair Value as of Vesting Date of Equity Awards Granted and Vested in the Year |
Year over Year Change in Fair Value of Equity Awards Granted in Prior Years that Vested in the Year |
Fair Value at the End of the Prior Year of Equity Awards that Failed to Meet Vesting Conditions in the Year |
Value of Dividends or other Earnings Paid on Stock Awards not Otherwise Reflected in Fair Value or Total Compensation |
Total Stock Award Adjustments | ||||||||||||||||||||||||||||
| 2024 |
902,709 | (200,716 | ) | — | (142,308 | ) | — | 202,496 | 762,181 | ||||||||||||||||||||||||||
(3) |
The dollar amounts reported in this column represent the average of the total amounts reported for our other named executive officers in the “Total” column of the “Summary Compensation Table” in the corresponding year’s proxy statement as follows: |
2020: Ms. Keenan, Douglas N. Armer and Mr. Marone
2021: Messrs. Armer and Marone. Ms. Keenan, whose 2021 compensation is included in the PEO column, is excluded from this calculation.
2022: Messrs. Armer and Marone
2023: Mr. Marone
2024: Mr. Marone
(4) |
In accordance with the requirements of Item 402(v)(2)(iii) of Regulation S-K, when calculating the “average compensation actually paid” for our other named executive officers the following adjustments were made to the amounts reported in the Summary Compensation Table. Importantly, the dollar amounts do not reflect the actual average amount of compensation earned by, or paid to, our other named executive officers as a group during the applicable year. |
| Description |
2024 ($) | |
| Reported Summary Compensation Total |
229,320 | |
| Value of Stock Awards Reported in the Summary Compensation Table Deduction |
(229,320) | |
| Stock Awards Adjustment (a) |
176,681 | |
| | ||
| Compensation Actually Paid |
176,681 | |
| (a) | The amounts added or deducted in calculated stock award adjustments include: |
| Year |
Year End Fair Value of Unvested Equity Awards Granted in the Covered Year |
Year over Year Change in Fair Value of Outstanding and Unvested Equity Awards |
Fair Value as of Vesting Date of Equity Awards Granted and Vested in the Year |
Year over Year Change in Fair Value of Equity Awards Granted in Prior Years that Vested in the Year |
Fair Value at the End of the Prior Year of Equity Awards that Failed to Meet Vesting Conditions in the Year |
Value of Dividends or other Earnings Paid on Stock Awards not Otherwise Reflected in Fair Value or Total Compensation |
Total Equity Award Adjustments |
|||||||||||||||||||||
| 2024 |
208,920 | (46,320 | ) | — | (32,397 | ) | — | 46,478 | 176,681 | |||||||||||||||||||
(5) |
When calculating amounts of “compensation actually paid” for purposes of this table, the fair value of awards of restricted shares of class A common stock calculated under the Financial Accounting Standard Board’s ASC Topic 718. Under ASC Topic 718, the grant date fair value is calculated using the closing market price of our class A common stock on the date of grant. Adjustments have been made using the stock price as of year-end and as of each vesting date, as applicable. |
(6) |
Total shareholder return as calculated based on a fixed investment of one hundred dollars measured from the market close on December 31, 2019 (the last trading day of 2019) through and including the end of the fiscal year for each year reported in the table as required by the Rule. |
(7) |
Total shareholder return for the group of companies included in the FTSE NAREIT Mortgage REITs Index, which is the industry peer group we use for purposes of Item 201(e) of Regulation S-K. We used the Bloomberg REIT Mortgage Index in fiscal year 2024 to measure peer group total shareholder return. Because the Bloomberg REIT Mortgage Index was discontinued on February 29, 2024, we have changed the published industry index we use to measure peer group total shareholder return to the FTSE NAREIT Mortgage REITS Index. Assuming a $100 investment on December 31, 2019, the cumulative total shareholder return for the Bloomberg REIT Mortgage Index for the period from December 31, 2019 to |
| February 29, 2024, the date such index was discontinued, was $74.90. Assuming the $100 investment on December 31, 2019, the cumulative total shareholder return for the period from December 31, 2019 to December 31, 2024 for the Company and the FTSE NAREIT Mortgage REITs Index was $78.49 and $79.62, respectively. |
(8) |
Represents net income attributable to Blackstone Mortgage Trust. |
(9) |
For purposes of the Rule, we have identified Distributable Earnings as our Company-Selected Metric. We define Distributable Earnings as GAAP net income (loss), including realized gains and losses not otherwise recognized in current period GAAP net income (loss), and excluding (i) non-cash equity compensation expense, (ii) depreciation and amortization, (iii) unrealized gains (losses), and (iv) certain non-cash items. Distributable Earnings may also be adjusted from time to time to exclude one-time events pursuant to changes in GAAP and certain other non-cash charges as determined by our Manager, subject to approval by a majority of our independent directors. Distributable Earnings mirrors the terms of our Management Agreement for purposes of calculating our incentive fee expense. Although Distributable Earnings is one important financial performance measure, among others, that the compensation committee considers when making compensation decisions with the intent of aligning compensation with Company performance, the compensation committee has not historically and does not currently evaluate ‘compensation actually paid’ as calculated pursuant to Item 402(v)(2) as part of its executive compensation determinations; accordingly, the compensation committee does not actually use any financial performance measure specifically to link executive compensation “actually paid” to Company performance. |
(3) |
The dollar amounts reported in this column represent the average of the total amounts reported for our other named executive officers in the “Total” column of the “Summary Compensation Table” in the corresponding year’s proxy statement as follows: |
2020: Ms. Keenan, Douglas N. Armer and Mr. Marone
2021: Messrs. Armer and Marone. Ms. Keenan, whose 2021 compensation is included in the PEO column, is excluded from this calculation.
2022: Messrs. Armer and Marone
2023: Mr. Marone
2024: Mr. Marone
(7) |
Total shareholder return for the group of companies included in the FTSE NAREIT Mortgage REITs Index, which is the industry peer group we use for purposes of Item 201(e) of Regulation S-K. We used the Bloomberg REIT Mortgage Index in fiscal year 2024 to measure peer group total shareholder return. Because the Bloomberg REIT Mortgage Index was discontinued on February 29, 2024, we have changed the published industry index we use to measure peer group total shareholder return to the FTSE NAREIT Mortgage REITS Index. Assuming a $100 investment on December 31, 2019, the cumulative total shareholder return for the Bloomberg REIT Mortgage Index for the period from December 31, 2019 to |
| February 29, 2024, the date such index was discontinued, was $74.90. Assuming the $100 investment on December 31, 2019, the cumulative total shareholder return for the period from December 31, 2019 to December 31, 2024 for the Company and the FTSE NAREIT Mortgage REITs Index was $78.49 and $79.62, respectively. |
(2) |
In accordance with the requirements of Item 402(v)(2)(iii) of Regulation S-K, the following adjustments were made to the amounts reported for Ms. Keenan as Chief Executive Officer in the Summary Compensation Table. Importantly, the dollar amounts do not reflect the actual amount of compensation earned by, or paid to, our Chief Executive Officer during the applicable year. |
| Description |
2024 ($) |
|||
| Reported Summary Compensation Total |
990,854 | |||
| Value of Stock Awards Reported in the Summary Compensation Table Deduction |
(990,854 | ) | ||
| Stock Awards Adjustment (a) |
762,181 | |||
| |
|
|||
| Compensation Actually Paid |
762,181 | |||
| (a) | The amounts added or deducted in calculated stock award adjustments include: |
| Year |
Year End Fair Value of Unvested Equity Awards Granted in the Covered Year |
Year over Year Change in Fair Value of Outstanding and Unvested Equity Awards |
Fair Value as of Vesting Date of Equity Awards Granted and Vested in the Year |
Year over Year Change in Fair Value of Equity Awards Granted in Prior Years that Vested in the Year |
Fair Value at the End of the Prior Year of Equity Awards that Failed to Meet Vesting Conditions in the Year |
Value of Dividends or other Earnings Paid on Stock Awards not Otherwise Reflected in Fair Value or Total Compensation |
Total Stock Award Adjustments | ||||||||||||||||||||||||||||
| 2024 |
902,709 | (200,716 | ) | — | (142,308 | ) | — | 202,496 | 762,181 | ||||||||||||||||||||||||||
(4) |
In accordance with the requirements of Item 402(v)(2)(iii) of Regulation S-K, when calculating the “average compensation actually paid” for our other named executive officers the following adjustments were made to the amounts reported in the Summary Compensation Table. Importantly, the dollar amounts do not reflect the actual average amount of compensation earned by, or paid to, our other named executive officers as a group during the applicable year. |
| Description |
2024 ($) | |
| Reported Summary Compensation Total |
229,320 | |
| Value of Stock Awards Reported in the Summary Compensation Table Deduction |
(229,320) | |
| Stock Awards Adjustment (a) |
176,681 | |
| | ||
| Compensation Actually Paid |
176,681 | |
| (a) | The amounts added or deducted in calculated stock award adjustments include: |
| Year |
Year End Fair Value of Unvested Equity Awards Granted in the Covered Year |
Year over Year Change in Fair Value of Outstanding and Unvested Equity Awards |
Fair Value as of Vesting Date of Equity Awards Granted and Vested in the Year |
Year over Year Change in Fair Value of Equity Awards Granted in Prior Years that Vested in the Year |
Fair Value at the End of the Prior Year of Equity Awards that Failed to Meet Vesting Conditions in the Year |
Value of Dividends or other Earnings Paid on Stock Awards not Otherwise Reflected in Fair Value or Total Compensation |
Total Equity Award Adjustments |
|||||||||||||||||||||
| 2024 |
208,920 | (46,320 | ) | — | (32,397 | ) | — | 46,478 | 176,681 | |||||||||||||||||||
Total Shareholder Return
The following charts show the relationship between (1) the compensation actually paid to our PEO and the average compensation actually paid to the
non-PEO
named executive officers (“Other-NEO”)
(each as calculated pursuant to Item 402(v)(2)(iii) of Regulation S-K)
and (2) the cumulative total shareholder return of the Company for its last three completed fiscal (calendar) years. The charts also provide a comparison of the Company’s Total Shareholder Return (“TSR”) to the Compensation Comparison Group (“CCG”) total shareholder return for the four-year period. 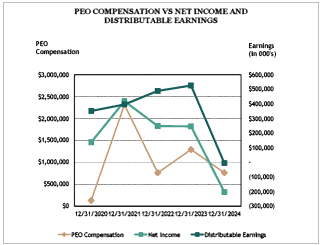
Net Income and Distributable Earnings
The following charts show the relationship between (1) the compensation actually paid to our PEO and the average compensation actually paid to the Other-NEOs (each as calculated pursuant to Item 402(v)(2)(iii) of Regulation
S-K)
and (2) both the net income and Distributable Earnings of the Company for the last four fiscal years. 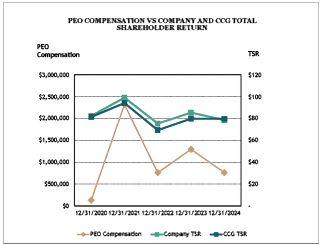

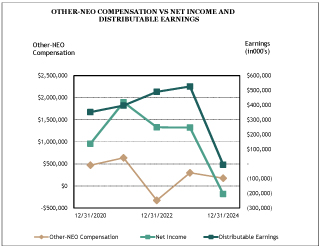
Net Income and Distributable Earnings
The following charts show the relationship between (1) the compensation actually paid to our PEO and the average compensation actually paid to the Other-NEOs (each as calculated pursuant to Item 402(v)(2)(iii) of Regulation
S-K)
and (2) both the net income and Distributable Earnings of the Company for the last four fiscal years.
Total Shareholder Return
The following charts show the relationship between (1) the compensation actually paid to our PEO and the average compensation actually paid to the
non-PEO
named executive officers (“Other-NEO”)
(each as calculated pursuant to Item 402(v)(2)(iii) of Regulation S-K)
and (2) the cumulative total shareholder return of the Company for its last three completed fiscal (calendar) years. The charts also provide a comparison of the Company’s Total Shareholder Return (“TSR”) to the Compensation Comparison Group (“CCG”) total shareholder return for the four-year period.
Tabular List of Financial Performance Measures
For purposes of the Rule, we have identified the following performance measures, which the compensation committee considered,
among
others, when making executive compensation decisions for performance year 2024, in response to the Tabular List disclosure requirement pursuant to Item 402(v)(6) of Regulation S-K.
∎ |
Company TSR |
∎ |
Net Income |
∎ |
Distributable Earnings |