Pay vs Performance Disclosure - USD ($)
Dec. 31, 2024
Dec. 31, 2023
Dec. 31, 2022
Dec. 31, 2021
Dec. 31, 2020
Pay versus Performance
The following table sets forth information concerning the compensation of our PEO and other NEOs for each of the fiscal years ending December 31, 2020, 2021, 2022, 2023 and 2024 and certain measures of our financial performance for each such fiscal year.
(A) |
(B) |
(C) |
(D) |
(E) |
(F) |
(G) |
(H) |
(I) |
||||||||||||||||||||||||
Value of Initial Fixed $100 Investment Based on: (5) |
||||||||||||||||||||||||||||||||
Year |
Summary Compensation Table Total for PEO (1) (2) |
Compensation Actually Paid to PEO (3) |
Average Summary Compensation Table Total for Non-PEO NEOs (2) |
Average Compensation Actually Paid to Non-PEO NEOs (3) |
Total Shareholder Return |
Peer Group Total Shareholder Return(4) |
Net Income (Loss) (6) (in thousands) |
Adjusted CASM ex-fuel (7) |
||||||||||||||||||||||||
| 2024 | $ | 8,169,764 | $ | 4,070,833 | $ | 1,839,501 | $ | 746,231 | $ | 0.92 | $ | 62.72 | ($ | 1,229,495 | ) | $ | 0.0797 | |||||||||||||||
| 2023 | $ | 6,601,404 | $ | 6,020,729 | $ | 2,939,369 | $ | 2,707,786 | $ | 43.70 | $ | 61.60 | ($ | 447,464 | ) | $ | 0.0706 | |||||||||||||||
| 2022 | $ | 3,358,855 | $ | 2,638,268 | $ | 1,667,353 | $ | 1,317,722 | $ | 48.33 | $ | 48.03 | ($ | 544,150 | ) | $ | 0.0673 | |||||||||||||||
| 2021 | $ | 3,871,281 | $ | 3,113,927 | $ | 1,671,535 | $ | 1,368,937 | $ | 54.20 | $ | 74.24 | ($ | 472,569 | ) | $ | 0.0674 | |||||||||||||||
| 2020 | $ | 2,591,445 | $ | 618,389 | $ | 1,064,081 | $ | 370,397 | $ | 60.65 | $ | 75.55 | ($ | 428,700 | ) | $ | 0.0790 | |||||||||||||||
| (1) | Edward M. Christie III served as the principal executive officer (“PEO”) of the Company during 2020, 2021, 2022 ,2023 and 2024. |
| (2) | The dollar amounts reported as total compensation for the Company’s PEO for each corresponding year are the amounts reported in the “Total” column of the Summary Compensation Table (“SCT”) for the PEO, and the dollar amounts reported for the Company’s other NEOs as a group for each corresponding year are the average of the amounts reported in the “Total” column of the SCT for such non-PEO NEOs. Refer to “Compensation Discussion and Analysis–Compensation Tables–Summary Compensation Table” of this this Amendment No. 1 to our 2024 Form 10-K and the Company’s proxy statements for fiscal years 2023, 2022, 2021 and 2020 for additional information. The individuals comprising the non-PEO NEOs in each applicable year are as follows: (i) for 2024, Frederick S. Cromer, John Bendoraitis, Matthew H. Klein, Thomas C. Canfield, Brian J. McMenamy and Scott M. Haralson; (ii) for 2023, Scott M. Haralson, John Bendoraitis, Matthew H. Klein, and Rocky B. Wiggins; (iii) for 2022, Scott M. Haralson, John Bendoraitis, Matthew H. Klein, and Melinda C. Grindle; (iv) for 2021, Scott M. Haralson, John Bendoraitis, Matthew H. Klein, and Thomas C. Canfield; and (v) for 2020, Scott M. Haralson, John Bendoraitis, Matthew H. Klein, and Thomas C. Canfield. |
| (3) | The dollar amounts reported as “compensation actually paid” (“CAP”) to the Company’s PEO, and the dollar amounts reported as average CAP to the non-PEO NEOs as a group, were computed in accordance with Item 402(v) of Regulation S-K. The dollar amounts do not reflect the actual amount of compensation earned by or paid to such PEO and NEOs during the applicable fiscal year. The valuation methodologies and assumptions used when calculating the equity values included in CAP are not materially different than those used when calculating the amounts included in the SCT. In accordance with the requirements of Item 402(v) of Regulation S-K, the following adjustments were made to the SCT for the PEO and Average SCT Total for the non-PEO NEOs for each applicable year to determine the CAP for our PEO and non-PEO NEOs for each such year: |
Adjustments to PEO SCT Total
and
Non-PEO
NEO Average SCT Total Year |
PEO or NEOs |
Reported Summary Compensation Table Total |
Less Reported Value of Equity Awards (a) |
Plus Fair Value at Fiscal Year- End of Outstanding and Unvested Option Awards and Stock Awards Granted in Fiscal Year |
Plus/(Minus) Change in Fair Value as of Fiscal Year- End from Prior Fiscal Year-End ofOutstanding and Unvested Option Awards and Stock Awards Granted in Prior Fiscal Years |
Plus Fair Value at Vesting of Option Awards and Stock Awards Granted in Fiscal Year that Vested During Covered Fiscal Year |
Plus/(Minus) Change in Fair Value as of vesting Date from Prior Fiscal Year- End of Option Awards and Stock Awards Granted in Prior Fiscal Years for Which Applicable Vesting Conditions Were Satisfied During Fiscal Year |
Less Fair Value as of Prior Fiscal Year-End ofOption Awards and Stock Awards Granted in Prior Fiscal Years that Failed to Meet Applicable Vesting Conditions During Fiscal Year |
Plus Value of Dividends or other Earnings or Paid on Stock or Option Awards Not Otherwise Reflected in Total Compensation |
Equals Compensation Actually Paid |
||||||||||||||||||||||||||||||
2024 |
PEO | $ | 8,169,764 | ($ | 1,456,246 | ) | $ | 109,731 | ($ | 2,246,352 | ) | ($ | 506,064 | ) | $ | 0 | $ | 0 | ($ | 2,642,685 | ) | $ | 4,070,833 | |||||||||||||||||
2024 |
NEOs | $ | 1,839,501 | ($ | 462,496 | ) | $ | 33,082 | ($ | 366,597 | ) | ($ | 128,910 | ) | $ | 0 | ($ | 168,349 | ) | ($ | 630,774 | ) | $ | 746,231 | ||||||||||||||||
| (a) | For the PEO, the grant date fair value of equity awards represents the total of the amounts reported in the “Stock Awards” column in the Summary Compensation Table for the applicable year. For the NEOs, the grant date fair value of equity awards represents the average of the amounts reported in the “Stock Awards” column in the Summary Compensation Table for the applicable year. |
| (4) | The selected TSR peer group is the NYSE Arca Airline Index (^XAL), which is an independently prepared index that includes companies in the airline industry, and which we used in the stock performance graph required by Item 201(e)(1)(ii) of Regulation S-K included in the Company’s audited consolidated financial statements included in our Annual Report on Form 10-K for fiscal year 2024. |
| (5) | The comparison of total shareholder returns assumes that $100 was invested on December 31, 2019, through the end of the covered fiscal year, in the Company and the NYSE Arca Airline Index (^XAL). |
| (6) | The dollar amounts reported in this column represent the amount of net income (loss) reflected in the Company’s audited consolidated financial statements included in our Annual Report on Form 10-K for the applicable year. |
| (7) | Pursuant to Item 402(v) of Regulation S-K, “Adjusted CASM ex-fuel” was determined to represent the most important financial measure linking compensation actually paid to our PEO and other NEOs in fiscal year 2024 to Company performance, and was therefore selected as the 2024 “Company-Selected Measure” (as defined in Item 402(v)). “Adjusted CASM ex-fuel ” is a common metric used in the airline industry to measure an airline’s cost structure and efficiency, and is defined as operating costs, excluding aircraft fuel expense and special items, per available seat mile. |
non-PEO
NEOs. Refer to “Compensation Discussion and Analysis–Compensation Tables–Summary Compensation Table” of this this Amendment No. 1 to our 2024 Form 10-K
and the Company’s proxy statements for fiscal years 2023, 2022, 2021 and 2020 for additional information. The individuals comprising the non-PEO
NEOs in each applicable year are as follows: (i) for 2024, Frederick S. Cromer, John Bendoraitis, Matthew H. Klein, Thomas C. Canfield, Brian J. McMenamy and Scott M. Haralson; (ii) for 2023, Scott M. Haralson, John Bendoraitis, Matthew H. Klein, and Rocky B. Wiggins; (iii) for 2022, Scott M. Haralson, John Bendoraitis, Matthew H. Klein, and Melinda C. Grindle; (iv) for 2021, Scott M. Haralson, John Bendoraitis, Matthew H. Klein, and Thomas C. Canfield; and (v) for 2020, Scott M. Haralson, John Bendoraitis, Matthew H. Klein, and Thomas C. Canfield.
S-K
included in the Company’s audited consolidated financial statements included in our Annual Report on Form 10-K
for fiscal year 2024.
| (3) | The dollar amounts reported as “compensation actually paid” (“CAP”) to the Company’s PEO, and the dollar amounts reported as average CAP to the non-PEO NEOs as a group, were computed in accordance with Item 402(v) of Regulation S-K. The dollar amounts do not reflect the actual amount of compensation earned by or paid to such PEO and NEOs during the applicable fiscal year. The valuation methodologies and assumptions used when calculating the equity values included in CAP are not materially different than those used when calculating the amounts included in the SCT. In accordance with the requirements of Item 402(v) of Regulation S-K, the following adjustments were made to the SCT for the PEO and Average SCT Total for the non-PEO NEOs for each applicable year to determine the CAP for our PEO and non-PEO NEOs for each such year: |
Adjustments to PEO SCT Total
and
Non-PEO
NEO Average SCT Total Year |
PEO or NEOs |
Reported Summary Compensation Table Total |
Less Reported Value of Equity Awards (a) |
Plus Fair Value at Fiscal Year- End of Outstanding and Unvested Option Awards and Stock Awards Granted in Fiscal Year |
Plus/(Minus) Change in Fair Value as of Fiscal Year- End from Prior Fiscal Year-End ofOutstanding and Unvested Option Awards and Stock Awards Granted in Prior Fiscal Years |
Plus Fair Value at Vesting of Option Awards and Stock Awards Granted in Fiscal Year that Vested During Covered Fiscal Year |
Plus/(Minus) Change in Fair Value as of vesting Date from Prior Fiscal Year- End of Option Awards and Stock Awards Granted in Prior Fiscal Years for Which Applicable Vesting Conditions Were Satisfied During Fiscal Year |
Less Fair Value as of Prior Fiscal Year-End ofOption Awards and Stock Awards Granted in Prior Fiscal Years that Failed to Meet Applicable Vesting Conditions During Fiscal Year |
Plus Value of Dividends or other Earnings or Paid on Stock or Option Awards Not Otherwise Reflected in Total Compensation |
Equals Compensation Actually Paid |
||||||||||||||||||||||||||||||
2024 |
PEO | $ | 8,169,764 | ($ | 1,456,246 | ) | $ | 109,731 | ($ | 2,246,352 | ) | ($ | 506,064 | ) | $ | 0 | $ | 0 | ($ | 2,642,685 | ) | $ | 4,070,833 | |||||||||||||||||
2024 |
NEOs | $ | 1,839,501 | ($ | 462,496 | ) | $ | 33,082 | ($ | 366,597 | ) | ($ | 128,910 | ) | $ | 0 | ($ | 168,349 | ) | ($ | 630,774 | ) | $ | 746,231 | ||||||||||||||||
Relationship Between CAP and TSR
The below chart reflects the relationship between the “compensation actually paid” to the PEO and the average of the “compensation actually paid” to the
non-PEO
NEOs, Spirit’s cumulative TSR and the cumulative TSR of our selected peer group—NYSE ARCA Airline Industry Index: 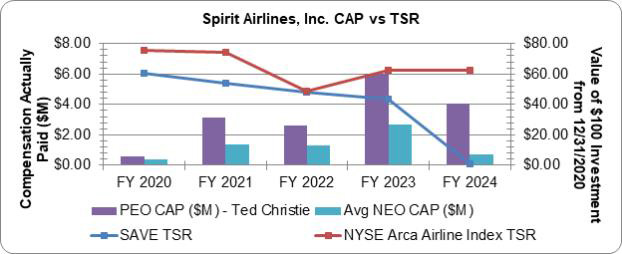
Relationship between CAP and Net Income
The below chart reflects the relationship between the “compensation actually paid” to the PEO and the
av
erage of the “compensation actually paid” to the non-PEO
NEOs and Spirit’s net income (loss): 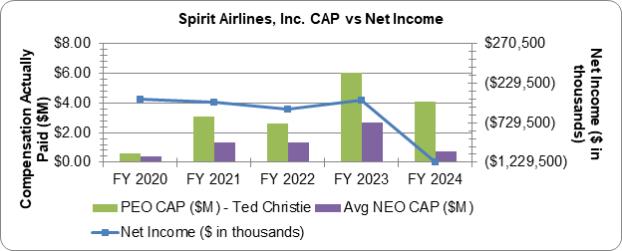
Relationship between CAP and the Company-Selected Measure (CASM)
The below chart reflects the relationship between the “compensation
actually
paid” to the PEO and the average of the “compensation actually paid” to the non-PEO
NEOs and Spirit’s CASM ex-fuel
for the applicable fiscal year: 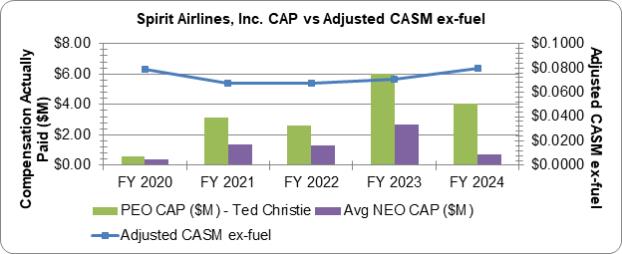
Relationship Between CAP and TSR
The below chart reflects the relationship between the “compensation actually paid” to the PEO and the average of the “compensation actually paid” to the
non-PEO
NEOs, Spirit’s cumulative TSR and the cumulative TSR of our selected peer group—NYSE ARCA Airline Industry Index: