Pay vs Performance Disclosure - USD ($)
Dec. 31, 2024
Dec. 31, 2023
Dec. 31, 2022
Pay versus Performance Information
In accordance with rules adopted by the Securities and Exchange Commission pursuant to the Dodd-Frank Wall Street Reform and Consumer Protection Act of 2010, we provide the following disclosure regarding executive compensation for our principal executive officer (“PEO”) and Non-PEO NEOs and Company performance for the fiscal years listed below. The Compensation Committee did not consider the pay versus performance disclosure below in making its pay decisions for any of the years shown.
Year | Summary Compensation Table Total for Soroush Salehian Dardashti1 ($) | Compensation Actually Paid to Soroush Salehian Dardashti1,2,3 ($) | Average Summary Compensation Table Total for Non-PEO NEOs1 ($) | Average Compensation Actually Paid to Non-PEO NEOs1,2,3 ($) | Value of Initial Fixed $100 Investment based on TSR4 ($) | Net Income ($ Millions) | ||||||||||||
(a) | (b) | (c) | (d) | (e) | (f) | (g) | ||||||||||||
2024 | 1,513,000 | 4,373,443 | 2,313,819 | 3,657,244 | 12.57 | (152) | ||||||||||||
2023 | 7,613,310 | 4,893,052 | 4,266,499 | 2,853,083 | 10.02 | (149) | ||||||||||||
2022 | 1,056,300 | (3,736,128) | 1,496,649 | (5,522,762) | 17.99 | (147) | ||||||||||||
1. | Soroush Salehian Dardashti was our PEO for each year presented. The individuals comprising the Non-PEO NEOs for each year presented are Mina Rezk and Saurabh Sinha. |
2. | The amounts shown for Compensation Actually Paid have been calculated in accordance with Item 402(v) of Regulation S-K and do not reflect compensation actually earned, realized, or received by the Company’s NEOs. These amounts reflect the Summary Compensation Table Total with certain adjustments as described in footnote 3 below. The amount for the 2023 Average Summary Compensation Table Total for Non-PEO NEOs is revised from the amount reported in the 2024 proxy statement to correct an administrative error, and the amount for the 2023 Average Compensation Actually Paid to Non-PEO NEOs is correspondingly updated. |
3. | Compensation Actually Paid reflects the exclusions and inclusions of certain amounts for the PEO and the Non-PEO NEOs as set forth below. Equity values are calculated in accordance with FASB ASC Topic 718. Amounts in the Exclusion of Stock Awards and Option Awards column are the totals from the Stock Awards and Option Awards columns set forth in the Summary Compensation Table. |
Year | Summary Compensation Table Total for Soroush Salehian Dardashti ($) | Exclusion of Stock Awards and Option Awards for Soroush Salehian Dardashti ($) | Inclusion of Equity Values for Soroush Salehian Dardashti ($) | Compensation Actually Paid to Soroush Salehian Dardashti ($) | ||||||||
2024 | 1,513,000 | — | 2,860,443 | 4,373,443 | ||||||||
2023 | 7,613,310 | (6,172,060) | 3,451,802 | 4,893,052 | ||||||||
2022 | 1,056,300 | — | (4,792,428) | (3,736,128) | ||||||||
Year | Average Summary Compensation Table Total for Non-PEO NEOs ($) | Average Exclusion of Stock Awards and Option Awards for Non-PEO NEOs ($) | Average Inclusion of Equity Values for Non-PEO NEOs ($) | Average Compensation Actually Paid to Non-PEO NEOs ($) | ||||||||
2024 | 2,313,819 | (815,000) | 2,158,425 | 3,657,244 | ||||||||
2023 | 4,266,499 | (2,773,353) | 1,359,937 | 2,853,083 | ||||||||
2022 | 1,496,649 | (532,912) | (6,486,499) | (5,522,762) | ||||||||
The amounts in the Inclusion of Equity Values in the tables above are derived from the amounts set forth in the following tables:
Year | Year-End Fair Value of Equity Awards Granted During Year That Remained Unvested as of Last Day of Year for Soroush Salehian Dardashti ($) | Change in Fair Value from Last Day of Prior Year to Last Day of Year of Unvested Equity Awards for Soroush Salehian Dardashti ($) | Vesting-Date Fair Value of Equity Awards Granted During Year that Vested During Year for Soroush Salehian Dardashti ($) | Change in Fair Value from Last Day of Prior Year to Vesting Date of Unvested Equity Awards that Vested During Year for Soroush Salehian Dardashti ($) | Total - Inclusion of Equity Values for Soroush Salehian Dardashti ($) | ||||||||||
2024 | — | 2,884,147 | — | (23,704) | 2,860,443 | ||||||||||
2023 | 3,328,597 | (22,146) | 237,679 | (92,328) | 3,451,802 | ||||||||||
2022 | — | (2,997,317) | — | (1,795,111) | (4,792,428) |
Year | Average Year-End Fair Value of Equity Awards Granted During Year That Remained Unvested as of Last Day of Year for Non-PEO NEOs ($) | Average Change in Fair Value from Last Day of Prior Year to Last Day of Year of Unvested Equity Awards for Non-PEO NEOs ($) | Average Vesting- Date Fair Value of Equity Awards Granted During Year that Vested During Year for Non- PEO NEOs ($) | Average Change in Fair Value from Last Day of Prior Year to Vesting Date of Unvested Equity Awards that Vested During Year for Non-PEO NEOs ($) | Total - Average Inclusion of Equity Values for Non- PEO NEOs ($) | ||||||||||
2024 | 1,039,063 | 1,043,051 | 103,125 | (26,814) | 2,158,425 | ||||||||||
2023 | 1,526,268 | (165,161) | 141,726 | (142,896) | 1,359,937 | ||||||||||
2022 | 134,187 | (4,460,626) | 104,645 | (2,264,705) | (6,486,499) | ||||||||||
4. | The Company TSR assumes $100 was invested in the Company for the period starting December 31, 2021 through the end of the listed year. Historical stock performance is not necessarily indicative of future stock performance. |
1. | Soroush Salehian Dardashti was our PEO for each year presented. The individuals comprising the Non-PEO NEOs for each year presented are Mina Rezk and Saurabh Sinha. |
3. | Compensation Actually Paid reflects the exclusions and inclusions of certain amounts for the PEO and the Non-PEO NEOs as set forth below. Equity values are calculated in accordance with FASB ASC Topic 718. Amounts in the Exclusion of Stock Awards and Option Awards column are the totals from the Stock Awards and Option Awards columns set forth in the Summary Compensation Table. |
Year | Summary Compensation Table Total for Soroush Salehian Dardashti ($) | Exclusion of Stock Awards and Option Awards for Soroush Salehian Dardashti ($) | Inclusion of Equity Values for Soroush Salehian Dardashti ($) | Compensation Actually Paid to Soroush Salehian Dardashti ($) | ||||||||
2024 | 1,513,000 | — | 2,860,443 | 4,373,443 | ||||||||
2023 | 7,613,310 | (6,172,060) | 3,451,802 | 4,893,052 | ||||||||
2022 | 1,056,300 | — | (4,792,428) | (3,736,128) | ||||||||
The amounts in the Inclusion of Equity Values in the tables above are derived from the amounts set forth in the following tables:
Year | Year-End Fair Value of Equity Awards Granted During Year That Remained Unvested as of Last Day of Year for Soroush Salehian Dardashti ($) | Change in Fair Value from Last Day of Prior Year to Last Day of Year of Unvested Equity Awards for Soroush Salehian Dardashti ($) | Vesting-Date Fair Value of Equity Awards Granted During Year that Vested During Year for Soroush Salehian Dardashti ($) | Change in Fair Value from Last Day of Prior Year to Vesting Date of Unvested Equity Awards that Vested During Year for Soroush Salehian Dardashti ($) | Total - Inclusion of Equity Values for Soroush Salehian Dardashti ($) | ||||||||||
2024 | — | 2,884,147 | — | (23,704) | 2,860,443 | ||||||||||
2023 | 3,328,597 | (22,146) | 237,679 | (92,328) | 3,451,802 | ||||||||||
2022 | — | (2,997,317) | — | (1,795,111) | (4,792,428) |
3. | Compensation Actually Paid reflects the exclusions and inclusions of certain amounts for the PEO and the Non-PEO NEOs as set forth below. Equity values are calculated in accordance with FASB ASC Topic 718. Amounts in the Exclusion of Stock Awards and Option Awards column are the totals from the Stock Awards and Option Awards columns set forth in the Summary Compensation Table. |
Year | Average Summary Compensation Table Total for Non-PEO NEOs ($) | Average Exclusion of Stock Awards and Option Awards for Non-PEO NEOs ($) | Average Inclusion of Equity Values for Non-PEO NEOs ($) | Average Compensation Actually Paid to Non-PEO NEOs ($) | ||||||||
2024 | 2,313,819 | (815,000) | 2,158,425 | 3,657,244 | ||||||||
2023 | 4,266,499 | (2,773,353) | 1,359,937 | 2,853,083 | ||||||||
2022 | 1,496,649 | (532,912) | (6,486,499) | (5,522,762) | ||||||||
The amounts in the Inclusion of Equity Values in the tables above are derived from the amounts set forth in the following tables:
Year | Average Year-End Fair Value of Equity Awards Granted During Year That Remained Unvested as of Last Day of Year for Non-PEO NEOs ($) | Average Change in Fair Value from Last Day of Prior Year to Last Day of Year of Unvested Equity Awards for Non-PEO NEOs ($) | Average Vesting- Date Fair Value of Equity Awards Granted During Year that Vested During Year for Non- PEO NEOs ($) | Average Change in Fair Value from Last Day of Prior Year to Vesting Date of Unvested Equity Awards that Vested During Year for Non-PEO NEOs ($) | Total - Average Inclusion of Equity Values for Non- PEO NEOs ($) | ||||||||||
2024 | 1,039,063 | 1,043,051 | 103,125 | (26,814) | 2,158,425 | ||||||||||
2023 | 1,526,268 | (165,161) | 141,726 | (142,896) | 1,359,937 | ||||||||||
2022 | 134,187 | (4,460,626) | 104,645 | (2,264,705) | (6,486,499) | ||||||||||
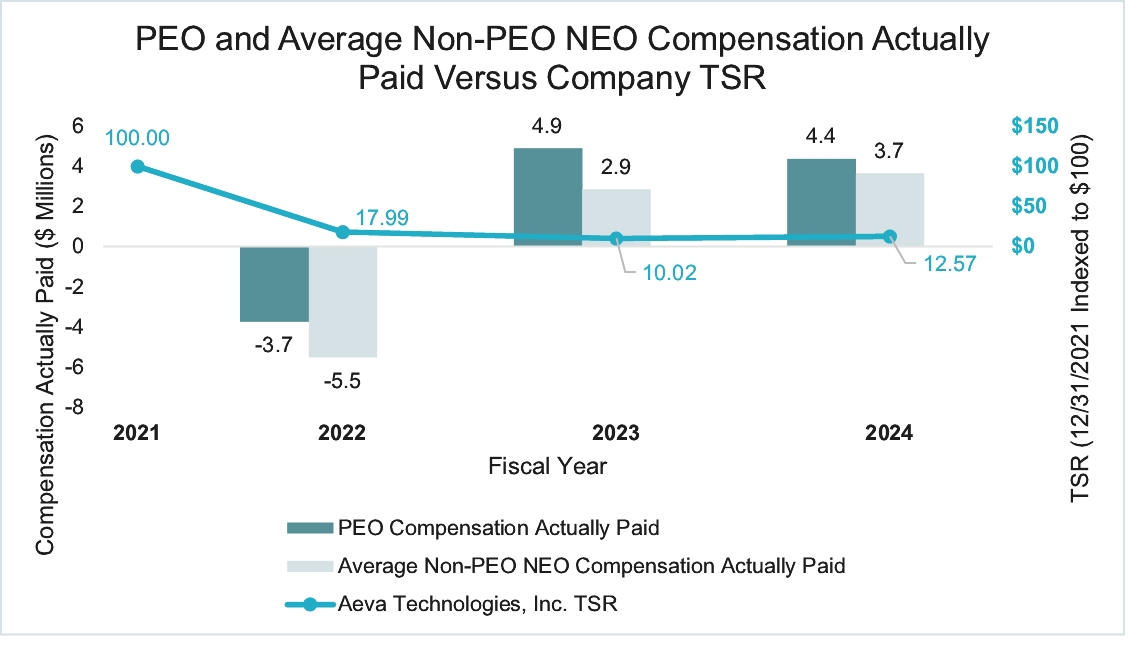
Description of Relationship Between PEO and Non-PEO NEO Compensation Actually Paid and Company Total Shareholder Return (“TSR”)
The following chart sets forth the relationship between Compensation Actually Paid to our PEO, the average of Compensation Actually Paid to our Non-PEO NEOs, and the Company’s cumulative TSR over the three most recently completed fiscal years.
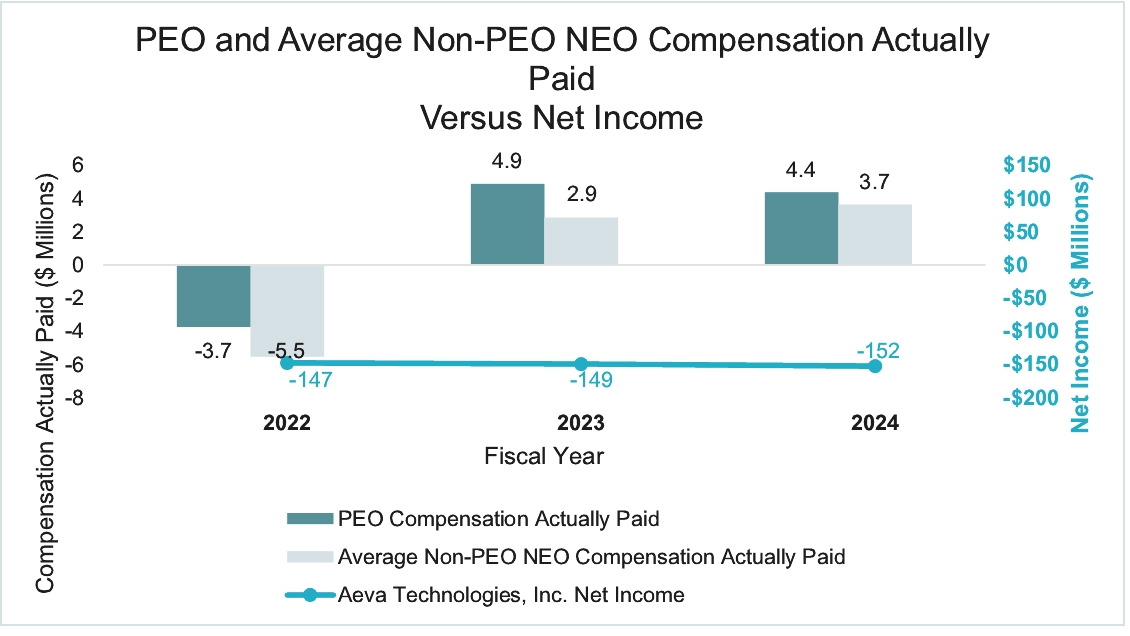
Description of Relationship Between PEO and Non-PEO NEO Compensation Actually Paid and Net Income
The following chart sets forth the relationship between Compensation Actually Paid to our PEO, the average of Compensation Actually Paid to our Non-PEO NEOs, and our Net Income during the three most recently completed fiscal years.
The amounts in the Inclusion of Equity Values in the tables above are derived from the amounts set forth in the following tables:
Year | Year-End Fair Value of Equity Awards Granted During Year That Remained Unvested as of Last Day of Year for Soroush Salehian Dardashti ($) | Change in Fair Value from Last Day of Prior Year to Last Day of Year of Unvested Equity Awards for Soroush Salehian Dardashti ($) | Vesting-Date Fair Value of Equity Awards Granted During Year that Vested During Year for Soroush Salehian Dardashti ($) | Change in Fair Value from Last Day of Prior Year to Vesting Date of Unvested Equity Awards that Vested During Year for Soroush Salehian Dardashti ($) | Total - Inclusion of Equity Values for Soroush Salehian Dardashti ($) | ||||||||||
2024 | — | 2,884,147 | — | (23,704) | 2,860,443 | ||||||||||
2023 | 3,328,597 | (22,146) | 237,679 | (92,328) | 3,451,802 | ||||||||||
2022 | — | (2,997,317) | — | (1,795,111) | (4,792,428) |
Year | Average Year-End Fair Value of Equity Awards Granted During Year That Remained Unvested as of Last Day of Year for Non-PEO NEOs ($) | Average Change in Fair Value from Last Day of Prior Year to Last Day of Year of Unvested Equity Awards for Non-PEO NEOs ($) | Average Vesting- Date Fair Value of Equity Awards Granted During Year that Vested During Year for Non- PEO NEOs ($) | Average Change in Fair Value from Last Day of Prior Year to Vesting Date of Unvested Equity Awards that Vested During Year for Non-PEO NEOs ($) | Total - Average Inclusion of Equity Values for Non- PEO NEOs ($) | ||||||||||
2024 | 1,039,063 | 1,043,051 | 103,125 | (26,814) | 2,158,425 | ||||||||||
2023 | 1,526,268 | (165,161) | 141,726 | (142,896) | 1,359,937 | ||||||||||
2022 | 134,187 | (4,460,626) | 104,645 | (2,264,705) | (6,486,499) | ||||||||||