Value of Initial Fixed | ||||||||||||||||||||
Average | $100 Investment Based On: | |||||||||||||||||||
Summary | Summary | Summary | Average | NASDAQ | ||||||||||||||||
Compensation | Compensation | Compensation | Compensation | Compensation | Company | Biotechnology | Company | |||||||||||||
Table Total | Compensation | Table Total | Actually Paid | Table Total for | Actually Paid | Total | Index Total | Selected | ||||||||||||
for First | Actually Paid | for Second | for Second | Non-PEO | to Non-PEO | Shareholder | Shareholder | Net Income / | Measure: | |||||||||||
PEO | for First PEO | PEO | PEO | NEOs | NEOs | Return | Return | Loss | Revenue | |||||||||||
Year | ($)(1) | ($)(2) | ($)(1) | ($)(2) | ($)(3) | ($)(4)(5) | ($)(6) | ($)(7) | ($ Millions) (8) | ($ Millions) | ||||||||||
2024 |
| 7,410,765 |
| 14,728,383 |
| — |
| — |
| 2,298,243 |
| 4,494,498 |
| 93.98 |
| 113.84 |
| (363.3) |
| 806.8 |
2023 |
| 5,659,384 |
| (3,542,201) |
| 8,937,025 |
| 4,769,312 |
| 2,398,388 |
| 781,089 |
| 57.4 |
| 115.4 |
| (626.6) |
| 937.8 |
2022 |
| 7,163,740 |
| 5,403,785 |
| — |
| — |
| 3,371,920 |
| 2,655,391 |
| 79.5 |
| 111.3 |
| (559.0) |
| 698.8 |
2021 |
| 11,022,323 |
| (4,946,916) |
| — |
| — |
| 4,334,690 |
| (1,002,836) |
| 82.9 |
| 124.9 |
| (523.9) |
| 538.6 |
2020 |
| 10,552,792 |
| 12,568,762 |
| — |
| — |
| 3,982,716 |
| 2,566,938 |
| 127.1 |
| 125.7 |
| (438.2) |
| 380.8 |
(1) | The dollar amounts reported in this column are the amounts of total compensation reported for our PEO for each corresponding year in the “Total” column of the Summary Compensation Table. Our PEO for fiscal year 2024 was Matthew Klein. For fiscal year 2023, Stuart Peltz was our First PEO and Matthew Klein was our Second PEO. Our PEO for fiscal years 2022, 2021 and 2020 was Stuart Peltz. |
(2) | The dollar amounts reported in this column represent the amount of CAP, for our PEO for the corresponding fiscal year, as calculated in accordance with Item 402(v) of Regulation S-K and as further described below. |
(3) | The dollar amounts reported in this column represent the average of the amounts reported for our non-PEO NEOs as a group in the “Total” column of the Summary Compensation Table for the corresponding year. The non-PEO NEOs included for purposes of such calculations are as follows: (i) for fiscal year 2024, Pierre Gravier, Lee Golden, Eric Pauwels and Neil Almstead; (ii) for fiscal year 2023, Pierre Gravier, Mark Boulding, Lee Golden, Eric Pauwels and Emily Hill; (iii) for fiscal year 2022, Emily Hill, Neil Almstead, Eric Pauwels and Matthew Klein; (iv) for fiscal year 2021, Emily Hill, Neil Almstead, Mark Boulding, and Eric Pauwels; and (v) for fiscal year 2020, Emily Hill, Neil Almstead, Mark Boulding, Eric Pauwels and Marcio Souza. |
(4) | The dollar amounts reported in this column represent the average amount of CAP to the non-PEO NEOs specified in footnote (3) as a group, as further described below. |
(5) | The following tables describe the adjustments, each of which is prescribed by SEC rules, to calculate CAP from the amounts reported in the Summary Compensation Table. The amounts reported in the Summary Compensation Table and CAP do not reflect the actual amount of compensation earned by or paid to our executives during the applicable fiscal years, but rather are amounts determined in accordance with Item 402 of Regulation S-K under the Exchange Act. |
PEO: | ||||||||
Deductions | Additions | |||||||
Year | SCT Total ($) | from SCT Total ($) | to SCT Total ($) | CAP ($) | ||||
2024 | 7,410,765 | (5,359,306.38) | 12,676,925 | 14,728,383 |
|
|
|
|
|
| Value of Dividends |
| |||||||
Fair Value at the | or other Earnings | |||||||||||||
Year over Year | Fair Value as of | Year over Year | End of the Prior | Paid on Stock or | ||||||||||
Change in Fair | Vesting Date of | Change in Fair | Year of Equity | Option Awards | ||||||||||
Value of | Equity Awards | Value of Equity | Awards that | not Otherwise | ||||||||||
Year End Fair | Outstanding | Granted and | Awards Granted | Failed to Meet | Reflected in Fair | Total Equity | ||||||||
Value of Equity | and Unvested | Vested in | in Prior Years that | Vesting Conditions | Value or Total | Award | ||||||||
Awards | Equity Awards | the Year | Vested in the Year | in the Year | Compensation | Adjustments | ||||||||
Year | ($) | ($) | ($) | ($) | ($) | ($) | ($) | |||||||
2024 | 9,467,926 | 2,717,603 | — | 491,396 | — | — | 12,676,925 |
Non-PEO NEO's: | ||||||||
Deductions | Additions | |||||||
Year | SCT Total ($) | from SCT Total ($) | to SCT Total ($) | CAP ($) | ||||
2024 | 2,298,243 | (1,278,288) | 3,474,544 | 4,494,498 |
|
|
|
|
|
| Value of Dividends |
| |||||||
Fair Value at the | or other Earnings | |||||||||||||
Year over Year | Fair Value as of | Year over Year | End of the Prior | Paid on Stock or | ||||||||||
Change in Fair | Vesting Date of | Change in Fair | Year of Equity | Option Awards | ||||||||||
Value of | Equity Awards | Value of Equity | Awards that | not Otherwise | ||||||||||
Year End Fair | Outstanding | Granted and | Awards Granted | Failed to Meet | Reflected in Fair | Total Equity | ||||||||
Value of Equity | and Unvested | Vested in | in Prior Years that | Vesting Conditions | Value or Total | Award | ||||||||
Awards | Equity Awards | the Year | Vested in the Year | in the Year | Compensation | Adjustments | ||||||||
Year | ($) | ($) | ($) | ($) | ($) | ($) | ($) | |||||||
2024 | 2,520,255 | 852,982 | — | 101,307 | — | — | 3,474,544 |
The methodology used to develop the valuation assumptions as of each applicable measurement date is consistent with and did not materially differ from those disclosed at the time of grant.
(6) | Amounts represent the cumulative total stockholder return of our common stock for the period beginning on the market close on December 31, 2020, the last trading day before the earliest fiscal year in the table, through and including December 31, 2024, the end of the last fiscal year in the table for which cumulative total stockholder return is being calculated. Amount assumes that $100 was invested for the period starting December 31, 2020. The amount included in the table is the value of such fixed investment based on the cumulative total stockholder return as of the end of each year, including reinvestment of dividends (if any). |
(7) | The peer group used for this purpose is NASDAQ Biotechnology Index, which we also use in the stock performance graph required by Item 201(e) of Regulation S-K included in our Annual Report for the year ended December 31, 2024. Amount assumes $100 was invested for the period starting December 31, 2020, through the end of the listed year in the Company and in the NASDAQ Biotechnology Index, respectively. |
(8) | The dollar amounts in this column are the Company’s net loss as reflected in the Company’s audited consolidated financial statements for the applicable year. |
(1) | The dollar amounts reported in this column are the amounts of total compensation reported for our PEO for each corresponding year in the “Total” column of the Summary Compensation Table. Our PEO for fiscal year 2024 was Matthew Klein. For fiscal year 2023, Stuart Peltz was our First PEO and Matthew Klein was our Second PEO. Our PEO for fiscal years 2022, 2021 and 2020 was Stuart Peltz. |
(3) | The dollar amounts reported in this column represent the average of the amounts reported for our non-PEO NEOs as a group in the “Total” column of the Summary Compensation Table for the corresponding year. The non-PEO NEOs included for purposes of such calculations are as follows: (i) for fiscal year 2024, Pierre Gravier, Lee Golden, Eric Pauwels and Neil Almstead; (ii) for fiscal year 2023, Pierre Gravier, Mark Boulding, Lee Golden, Eric Pauwels and Emily Hill; (iii) for fiscal year 2022, Emily Hill, Neil Almstead, Eric Pauwels and Matthew Klein; (iv) for fiscal year 2021, Emily Hill, Neil Almstead, Mark Boulding, and Eric Pauwels; and (v) for fiscal year 2020, Emily Hill, Neil Almstead, Mark Boulding, Eric Pauwels and Marcio Souza. |
(7) | The peer group used for this purpose is NASDAQ Biotechnology Index, which we also use in the stock performance graph required by Item 201(e) of Regulation S-K included in our Annual Report for the year ended December 31, 2024. Amount assumes $100 was invested for the period starting December 31, 2020, through the end of the listed year in the Company and in the NASDAQ Biotechnology Index, respectively. |
(5) | The following tables describe the adjustments, each of which is prescribed by SEC rules, to calculate CAP from the amounts reported in the Summary Compensation Table. The amounts reported in the Summary Compensation Table and CAP do not reflect the actual amount of compensation earned by or paid to our executives during the applicable fiscal years, but rather are amounts determined in accordance with Item 402 of Regulation S-K under the Exchange Act. |
PEO: | ||||||||
Deductions | Additions | |||||||
Year | SCT Total ($) | from SCT Total ($) | to SCT Total ($) | CAP ($) | ||||
2024 | 7,410,765 | (5,359,306.38) | 12,676,925 | 14,728,383 |
|
|
|
|
|
| Value of Dividends |
| |||||||
Fair Value at the | or other Earnings | |||||||||||||
Year over Year | Fair Value as of | Year over Year | End of the Prior | Paid on Stock or | ||||||||||
Change in Fair | Vesting Date of | Change in Fair | Year of Equity | Option Awards | ||||||||||
Value of | Equity Awards | Value of Equity | Awards that | not Otherwise | ||||||||||
Year End Fair | Outstanding | Granted and | Awards Granted | Failed to Meet | Reflected in Fair | Total Equity | ||||||||
Value of Equity | and Unvested | Vested in | in Prior Years that | Vesting Conditions | Value or Total | Award | ||||||||
Awards | Equity Awards | the Year | Vested in the Year | in the Year | Compensation | Adjustments | ||||||||
Year | ($) | ($) | ($) | ($) | ($) | ($) | ($) | |||||||
2024 | 9,467,926 | 2,717,603 | — | 491,396 | — | — | 12,676,925 |
(5) | The following tables describe the adjustments, each of which is prescribed by SEC rules, to calculate CAP from the amounts reported in the Summary Compensation Table. The amounts reported in the Summary Compensation Table and CAP do not reflect the actual amount of compensation earned by or paid to our executives during the applicable fiscal years, but rather are amounts determined in accordance with Item 402 of Regulation S-K under the Exchange Act. |
Non-PEO NEO's: | ||||||||
Deductions | Additions | |||||||
Year | SCT Total ($) | from SCT Total ($) | to SCT Total ($) | CAP ($) | ||||
2024 | 2,298,243 | (1,278,288) | 3,474,544 | 4,494,498 |
|
|
|
|
|
| Value of Dividends |
| |||||||
Fair Value at the | or other Earnings | |||||||||||||
Year over Year | Fair Value as of | Year over Year | End of the Prior | Paid on Stock or | ||||||||||
Change in Fair | Vesting Date of | Change in Fair | Year of Equity | Option Awards | ||||||||||
Value of | Equity Awards | Value of Equity | Awards that | not Otherwise | ||||||||||
Year End Fair | Outstanding | Granted and | Awards Granted | Failed to Meet | Reflected in Fair | Total Equity | ||||||||
Value of Equity | and Unvested | Vested in | in Prior Years that | Vesting Conditions | Value or Total | Award | ||||||||
Awards | Equity Awards | the Year | Vested in the Year | in the Year | Compensation | Adjustments | ||||||||
Year | ($) | ($) | ($) | ($) | ($) | ($) | ($) | |||||||
2024 | 2,520,255 | 852,982 | — | 101,307 | — | — | 3,474,544 |
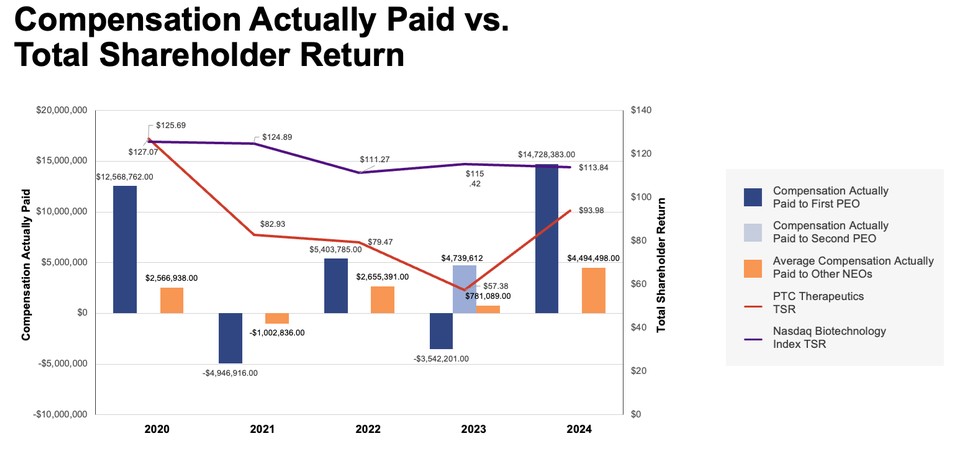
Description of Relationship Between PEO and Non-PEO NEO CAP and Company Total Stockholder Return, or TSR
The following chart sets forth graphically the relationship between CAP to our PEO, the average of CAP to our Non-PEO NEOs, the Company’s cumulative TSR and the index TSR over the five most recently completed fiscal years.
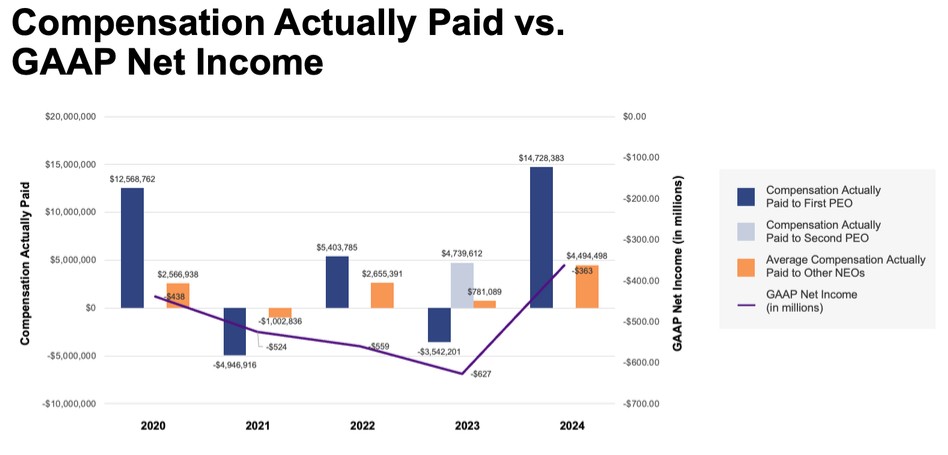
Description of Relationship Between PEO and Non-PEO NEO CAP and Net Income
The following chart sets forth graphically the relationship between CAP to our PEO, the average of CAP to our Non-PEO NEOs, and our net income loss during the five most recently completed fiscal years.
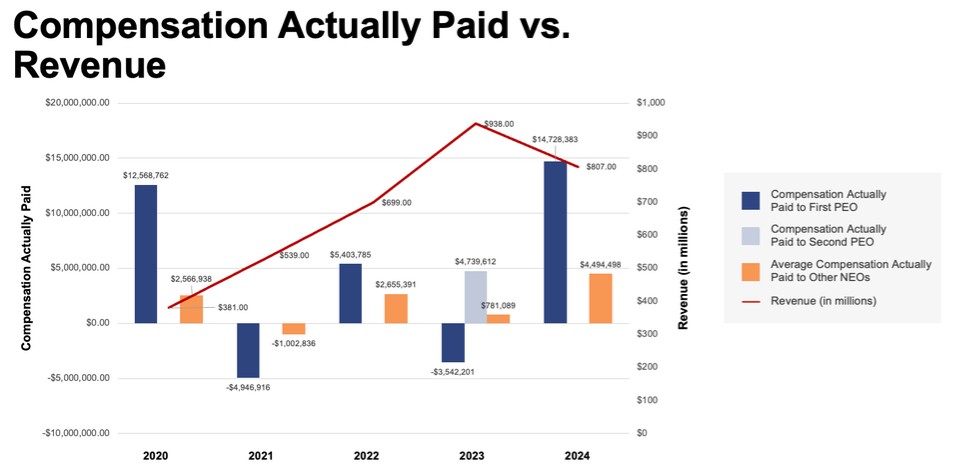
Description of Relationship Between PEO and Non-PEO NEO CAP and Revenue
The following chart sets forth graphically the relationship between CAP to our PEO, the average of CAP to our Non-PEO NEOs, and our revenue during the five most recently completed fiscal years.
Most Important Performance Measures |
| |
Revenue | ||
Pipeline Development (1) | ||
Total Shareholder Return | ||
Non-GAAP R&D expenses plus Non-GAAP SG&A expenses (2) |
| (1) | Pipeline Development is a non-financial performance measure that encapsulates the progress of our clinical and pre-clinical pipeline programs. For more information, see “Company goals and results under the 2024 annual incentive program—Advance research and development programs.” on page 41. |
| (2) | Non-GAAP research and development and non-GAAP selling, general and administrative expenses each exclude non-cash, stock-based compensation expense from the corresponding GAAP measures. The metric listed refers to the sum of Non-GAAP research and development expense and non-GAAP selling, general and administrative expense. For more information, please refer to Exhibit A of this proxy statement. |
|
|
|
|
|
| Value of Dividends |
| |||||||
Fair Value at the | or other Earnings | |||||||||||||
Year over Year | Fair Value as of | Year over Year | End of the Prior | Paid on Stock or | ||||||||||
Change in Fair | Vesting Date of | Change in Fair | Year of Equity | Option Awards | ||||||||||
Value of | Equity Awards | Value of Equity | Awards that | not Otherwise | ||||||||||
Year End Fair | Outstanding | Granted and | Awards Granted | Failed to Meet | Reflected in Fair | Total Equity | ||||||||
Value of Equity | and Unvested | Vested in | in Prior Years that | Vesting Conditions | Value or Total | Award | ||||||||
Awards | Equity Awards | the Year | Vested in the Year | in the Year | Compensation | Adjustments | ||||||||
Year | ($) | ($) | ($) | ($) | ($) | ($) | ($) | |||||||
2024 | 9,467,926 | 2,717,603 | — | 491,396 | — | — | 12,676,925 |
|
|
|
|
|
| Value of Dividends |
| |||||||
Fair Value at the | or other Earnings | |||||||||||||
Year over Year | Fair Value as of | Year over Year | End of the Prior | Paid on Stock or | ||||||||||
Change in Fair | Vesting Date of | Change in Fair | Year of Equity | Option Awards | ||||||||||
Value of | Equity Awards | Value of Equity | Awards that | not Otherwise | ||||||||||
Year End Fair | Outstanding | Granted and | Awards Granted | Failed to Meet | Reflected in Fair | Total Equity | ||||||||
Value of Equity | and Unvested | Vested in | in Prior Years that | Vesting Conditions | Value or Total | Award | ||||||||
Awards | Equity Awards | the Year | Vested in the Year | in the Year | Compensation | Adjustments | ||||||||
Year | ($) | ($) | ($) | ($) | ($) | ($) | ($) | |||||||
2024 | 2,520,255 | 852,982 | — | 101,307 | — | — | 3,474,544 |