Pay vs Performance Disclosure - USD ($)
Dec. 31, 2024
Dec. 31, 2023
Dec. 31, 2022
| Pay-Versus-Performance | ||||||||||||||||||||||||||||||||||||||||||||||||||
Year(1) (a) | Summary Compensation Table Total for PEO 1 (Faga) (2) (b) | Compensation Actually Paid for PEO 1 (Faga) (3) (c) | Summary Compensation Table Total for PEO 2 (Suria) (2) (b) | Compensation Actually Paid for PEO 2 (Suria) (3) (c) | Average Summary Compensation Table Total for Non-PEO NEOs (2) (d) | Average Compensation Actually Paid for Non-PEO NEOs (3) (e) | Value of Initial Fixed $100 Investment Based on Total Shareholder Return (4) (f) | Net Income (g) | ||||||||||||||||||||||||||||||||||||||||||
| 2024 | $13,630,292 | $9,160,362 | N/A | N/A | $3,911,208 | $1,844,033 | $38 | $(145,231,000) | ||||||||||||||||||||||||||||||||||||||||||
| 2023 | $7,461,920 | $(1,737,869) | N/A | N/A | $2,349,651 | $544,250 | $62 | $(163,619,000) | ||||||||||||||||||||||||||||||||||||||||||
| 2022 | $24,440,350 | $28,514,763 | $7,250,583 | $3,714,536 | $3,827,145 | $2,228,110 | $89 | $(128,724,000) | ||||||||||||||||||||||||||||||||||||||||||
| Year | PEO 1 | PEO 2 | Non-PEO NEOs | ||||||||
| 2024 | Daniel Faga | N/A | Dennis Mulroy, Paul Lizzul | ||||||||
| 2023 | Daniel Faga | N/A | Eric Loumeau, Paul Lizzul | ||||||||
| 2022 | Daniel Faga | Hamza Suria | Eric Loumeau, Paul Lizzul | ||||||||
–2022 Summary Compensation Table total for Mr. Faga includes fees paid for service as a non-employee director during 2022 ($10,000 cash retainer and $200,618 stock option grant).
The dollar amounts reported in these columns represent (i) the “compensation actually paid” to our PEOs and (ii) the average “compensation actually paid” to our other NEOs as a group (excluding our PEOs), based on their total compensation reported in the Summary Compensation Table for the applicable fiscal years and adjusted in accordance with Item 402(v) of Regulation S-K. The dollar amounts reported in this column for the latest fiscal year are adjusted as shown in the table below:| 2024 (PEO 1) | 2024 (NEO Average) | ||||||||||||||||
| Summary Compensation Table - Total Compensation | $ | 13,630,292 | $ | 3,911,208 | |||||||||||||
| - | Grant Date Fair Value of Stock Awards and Option Awards Granted in Fiscal Year | $ | (12,612,583) | $ | (3,218,111) | ||||||||||||
| + | Fair Value at Fiscal Year End of Outstanding and Unvested Stock Awards and Option Awards Granted in Fiscal Year | $ | 6,463,650 | $ | 1,710,780 | ||||||||||||
| + | Change in Fair Value of Outstanding and Unvested Stock Awards and Option Awards Granted in Prior Fiscal Years | $ | (1,013,905) | $ | (450,902) | ||||||||||||
| + | Fair Value at Vesting of Stock Awards and Option Awards Granted in Fiscal Year That Vested During Fiscal Year | $ | — | $ | — | ||||||||||||
| + | Change in Fair Value as of Vesting Date of Stock Awards and Option Awards Granted in Prior Fiscal Years For Which Applicable Vesting Conditions Were Satisfied During Fiscal Year | $ | 2,692,908 | $ | 117,525 | ||||||||||||
| - | Fair Value as of Prior Fiscal Year End of Stock Awards and Option Awards Granted in Prior Fiscal Years That Failed to Meet Applicable Vesting Conditions During Fiscal Year | $ | — | $ | (226,467) | ||||||||||||
| = | Compensation Actually Paid | $ | 9,160,362 | $ | 1,844,033 | ||||||||||||
The fair value or change in fair value, as applicable, of equity awards in the “Compensation Actually Paid” columns has been estimated pursuant to the guidance in ASC Topic 718, and the valuation assumptions used to calculate fair values did not materially differ from those disclosed at the time of the grant.
| 2024 (PEO 1) | 2024 (NEO Average) | ||||||||||||||||
| Summary Compensation Table - Total Compensation | $ | 13,630,292 | $ | 3,911,208 | |||||||||||||
| - | Grant Date Fair Value of Stock Awards and Option Awards Granted in Fiscal Year | $ | (12,612,583) | $ | (3,218,111) | ||||||||||||
| + | Fair Value at Fiscal Year End of Outstanding and Unvested Stock Awards and Option Awards Granted in Fiscal Year | $ | 6,463,650 | $ | 1,710,780 | ||||||||||||
| + | Change in Fair Value of Outstanding and Unvested Stock Awards and Option Awards Granted in Prior Fiscal Years | $ | (1,013,905) | $ | (450,902) | ||||||||||||
| + | Fair Value at Vesting of Stock Awards and Option Awards Granted in Fiscal Year That Vested During Fiscal Year | $ | — | $ | — | ||||||||||||
| + | Change in Fair Value as of Vesting Date of Stock Awards and Option Awards Granted in Prior Fiscal Years For Which Applicable Vesting Conditions Were Satisfied During Fiscal Year | $ | 2,692,908 | $ | 117,525 | ||||||||||||
| - | Fair Value as of Prior Fiscal Year End of Stock Awards and Option Awards Granted in Prior Fiscal Years That Failed to Meet Applicable Vesting Conditions During Fiscal Year | $ | — | $ | (226,467) | ||||||||||||
| = | Compensation Actually Paid | $ | 9,160,362 | $ | 1,844,033 | ||||||||||||
The fair value or change in fair value, as applicable, of equity awards in the “Compensation Actually Paid” columns has been estimated pursuant to the guidance in ASC Topic 718, and the valuation assumptions used to calculate fair values did not materially differ from those disclosed at the time of the grant.
The following graph displays our compensation actually paid (CAP) vs. our cumulative TSR. The CAP to our PEOs in 2022 was non-standard as it reflects a new hire compensation package for Mr. Faga and partial year employment for Hamza Suria, our former President and Chief Executive Officer.
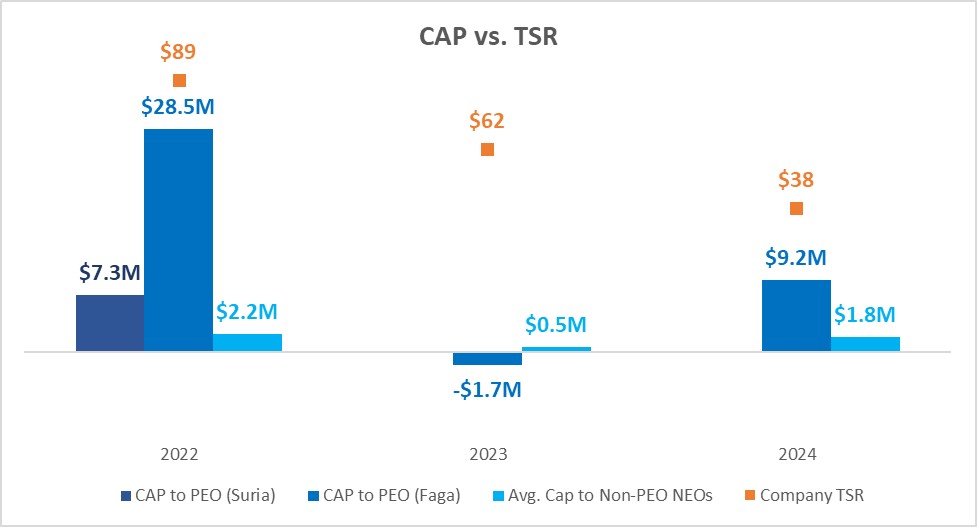
1. Cumulative TSR is calculated by dividing the sum of the cumulative amount of dividends for the measurement period, assuming dividend reinvestment, and the difference between the Company’s share price at the end and the beginning of the measurement period by the Company’s share price at the beginning of the measurement period.
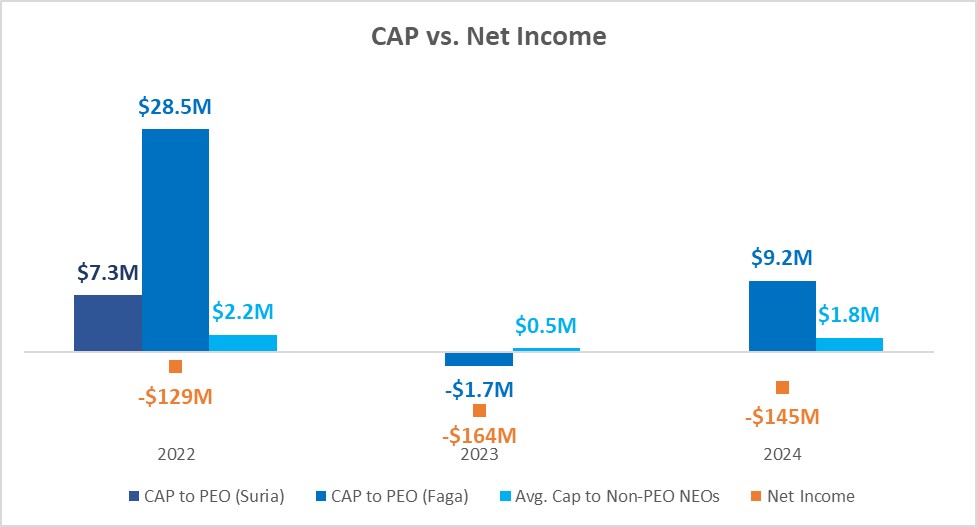
The following graph displays our compensation actually paid vs. Net Income. As a pre-commercial biotechnology company, we do not believe Net Income is yet a reasonable metric to measure our financial performance.