Pay vs Performance Disclosure - USD ($)
Dec. 31, 2024
Dec. 31, 2023
Dec. 31, 2022
Dec. 31, 2021
Dec. 31, 2020
The following tables and related disclosures provide information about (i) the total compensation (“SCT Total”) of our principal executive officer (“PEO”) and our non-PEO named executive officers (collectively, the “Other NEOs”) as presented in the Summary Compensation Table, (ii) the “compensation actually paid” (“CAP”) to our PEO and our Other NEOs, as calculated pursuant to Item 402(v), (iii) certain financial performance measures, and (iv) the relationship of the CAP to those financial performance measures
| Pay vs. Performance Table | ||||||||||||||||||||||||||
| Value of Initial Fixed $100 Investment Based On: | ||||||||||||||||||||||||||
| Year (a) | Summary Compensation Table Total for PEO (b) | Compensation Actually Paid to PEO (c) | Average Summary Compensation Table Total for Non-PEO NEOs (d) | Average Compensation Actually Paid to Non-PEO NEOs (e) | Total Shareholder Return (f) | Peer Group Total Shareholder Return (g) | Net Income (Loss) $ (in millions) (h) | Year End Stock Price (Company Selected Measure) (i) | ||||||||||||||||||
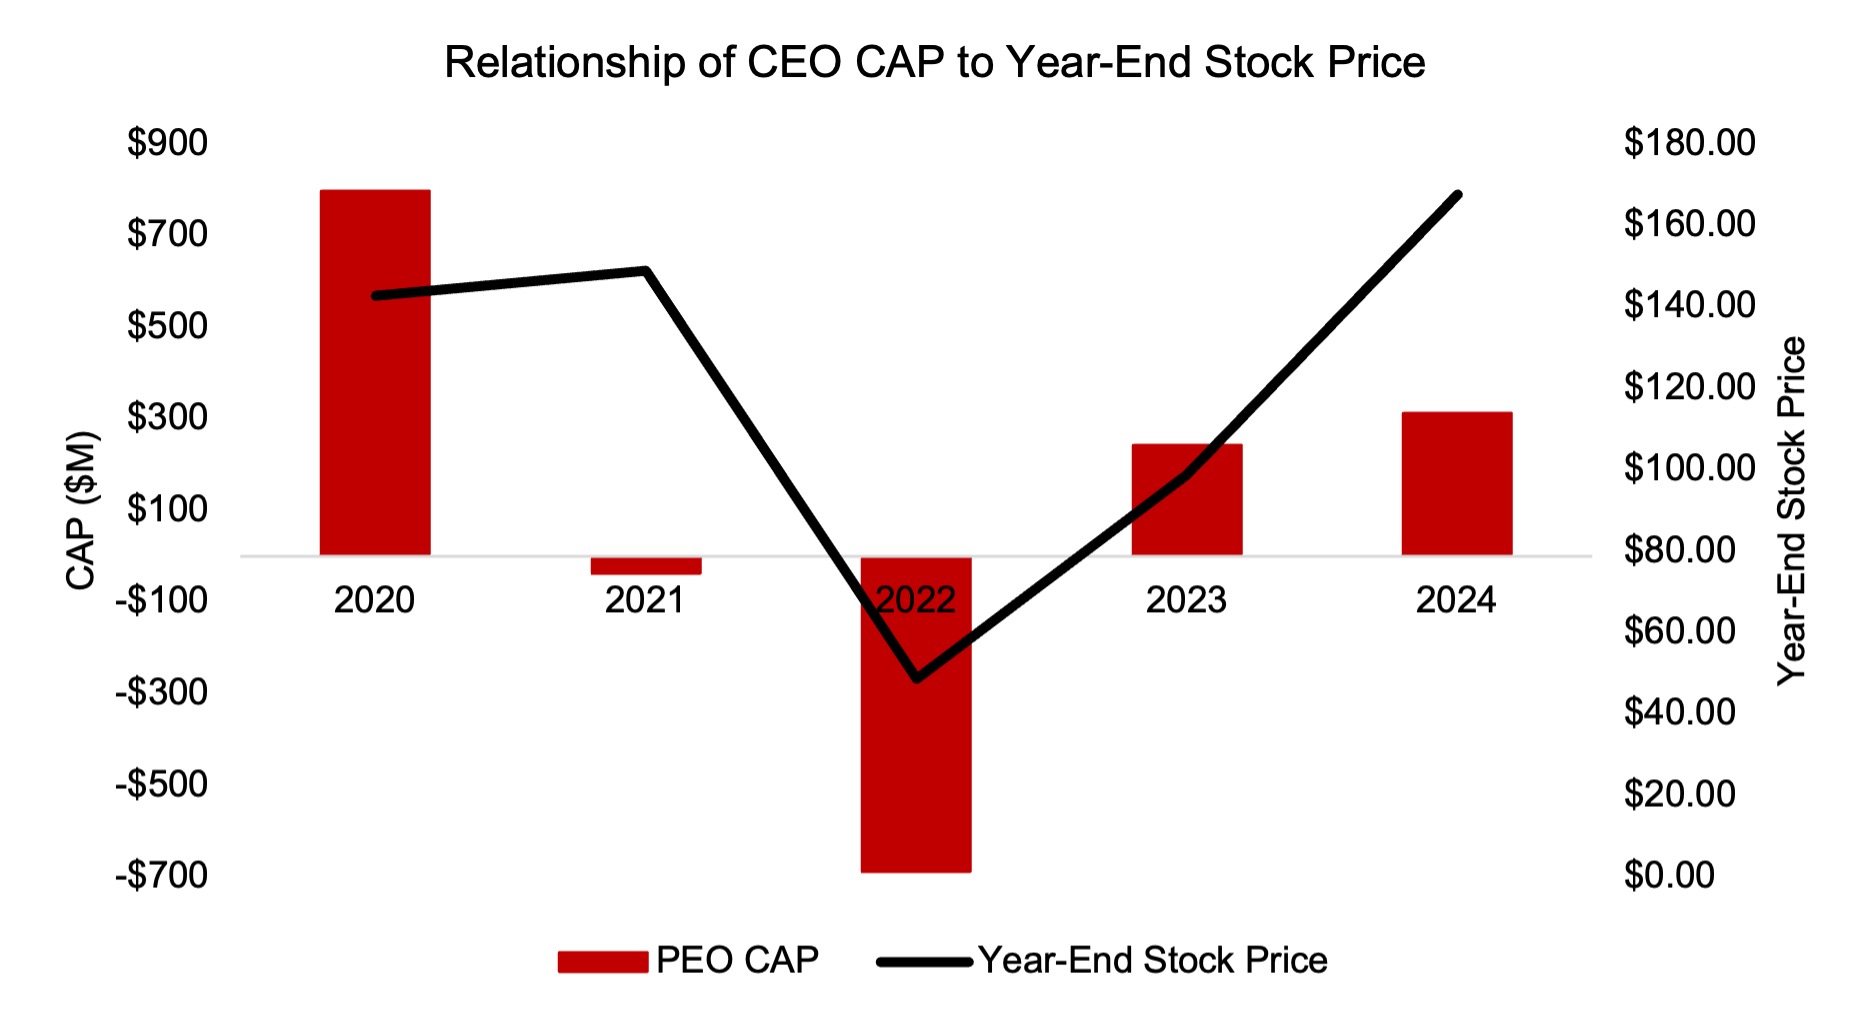
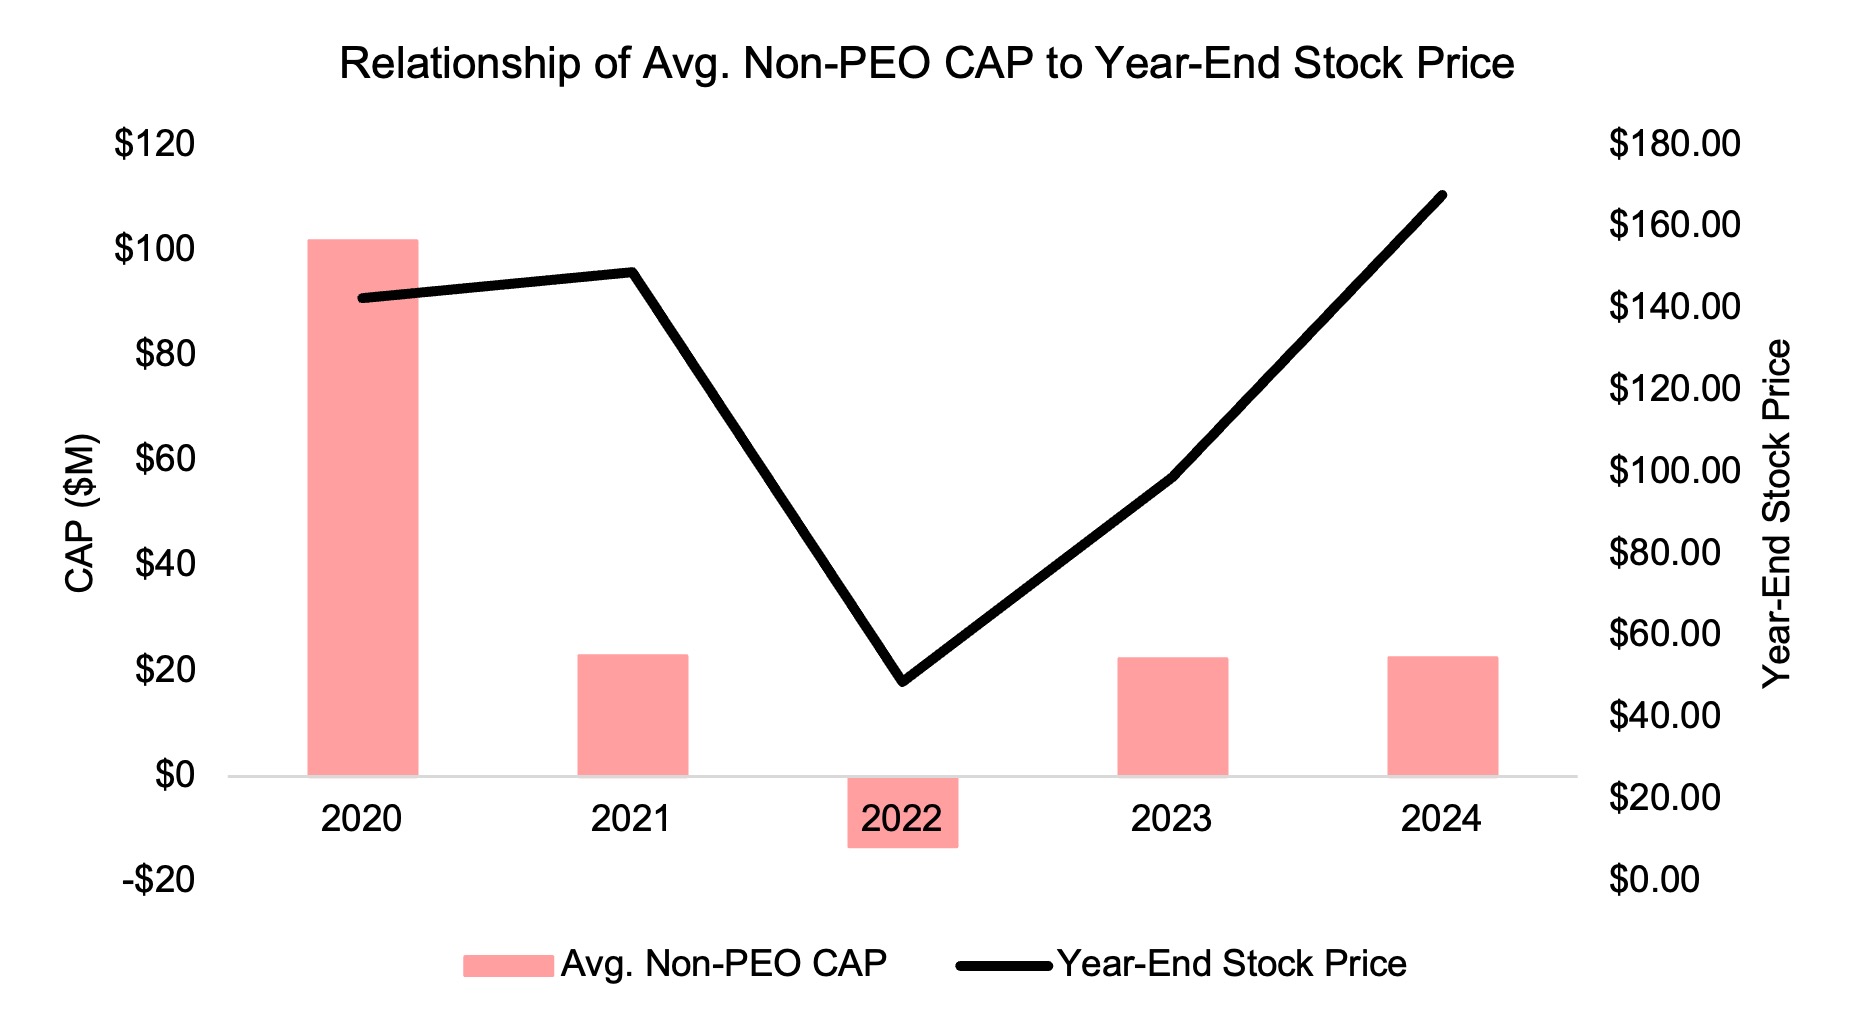
2024 | $ | 318,518 | $ | 313,764,318 | $ | 8,133,018 | $ | 22,629,253 | $ | 89 | $ | 211 | $ | 123 | $ | 168 | ||||||||||
2023(1) | $ | 316,275 | $ | 244,015,195 | $ | 10,831,201 | $ | 22,342,699 | $ | 52 | $ | 155 | $ | (558) | $ | 99 | ||||||||||
2022(1) | $ | 300,065 | $ | (686,374,575) | $ | 10,468,361 | $ | (13,402,406) | $ | 26 | $ | 99 | $ | (1,365) | $ | 49 | ||||||||||
| 2021 | $ | 300,297 | $ | (35,818,623) | $ | 8,474,204 | $ | 22,896,547 | $ | 79 | $ | 140 | $ | (468) | $ | 149 | ||||||||||
| 2020 | $ | 413,669,920 | $ | 796,888,547 | $ | 4,066,452 | $ | 101,965,963 | $ | 75 | $ | 105 | $ | (461) | $ | 143 | ||||||||||
(1) The 2023 and 2022 SCT Totals (columns (b) and (d)) and CAP (columns (c) and (e)) to our PEO and Other NEOs, as previously disclosed in our proxy statement dated April 26, 2024, included the value of payments made on behalf of such named executive officers related to basic life insurance premiums, which is a broad-based benefit that is available generally to all salaried employees and does not discriminate in scope, terms, or operation in favor of our executive officers. As contemplated by SEC disclosure rules, such broad-based benefits are not required to be reported as compensation to named executive officers. Accordingly, the value of these benefits has been removed from, and revised amounts are now presented in, the 2023 and 2022 SCT Totals and CAP amounts in the table above.
The following table sets forth our PEO and Other NEOs for each year represented in the Pay vs. Performance Table:
| PEO | Other NEOs | |||||||||||||
| 2024 | Tony Xu | Ravi Inukonda | Keith Yandell | |||||||||||
| Prabir Adarkar | Tia Sherringham | |||||||||||||
| 2023 | Tony Xu | Ravi Inukonda | Keith Yandell | |||||||||||
| Prabir Adarkar | Tia Sherringham | |||||||||||||
| 2022 | Tony Xu | Ravi Inukonda | Keith Yandell | |||||||||||
| Prabir Adarkar | Tia Sherringham | |||||||||||||
| 2021 | Tony Xu | Prabir Adarkar | Keith Yandell | |||||||||||
| Christopher Payne | ||||||||||||||
| 2020 | Tony Xu | Prabir Adarkar | Keith Yandell | |||||||||||
| Christopher Payne | ||||||||||||||
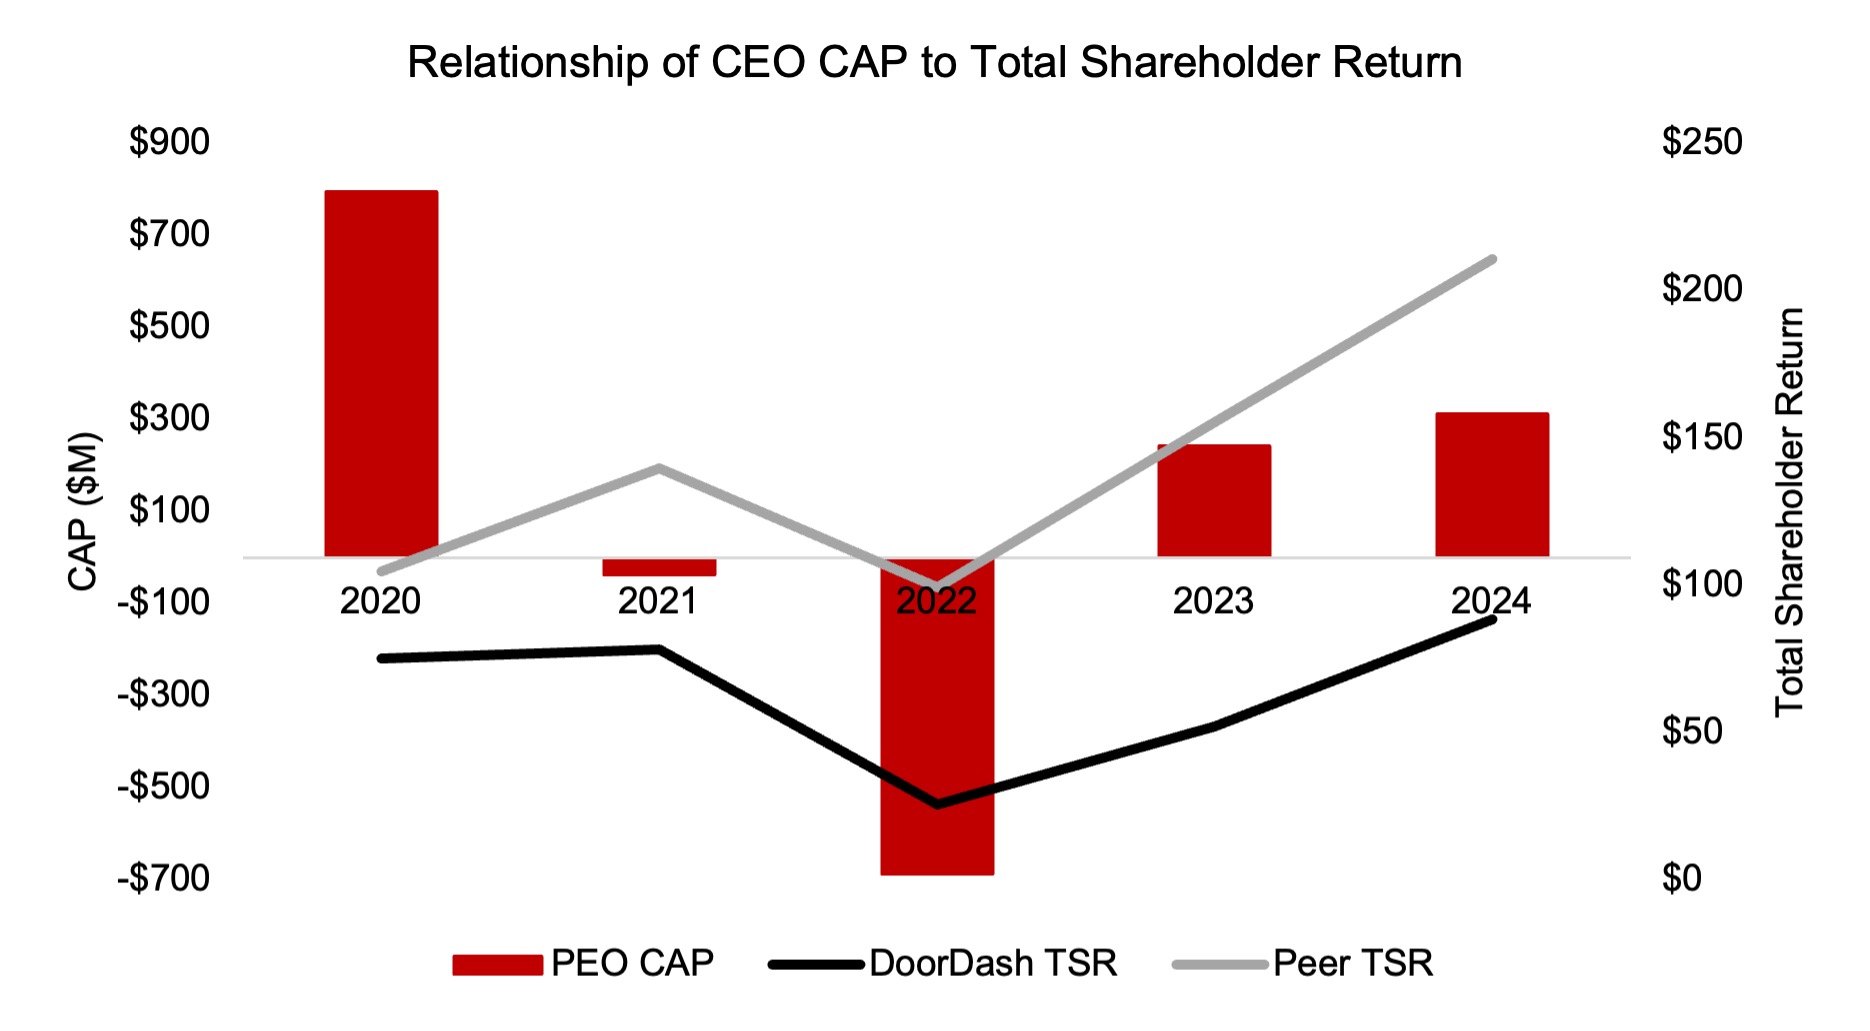
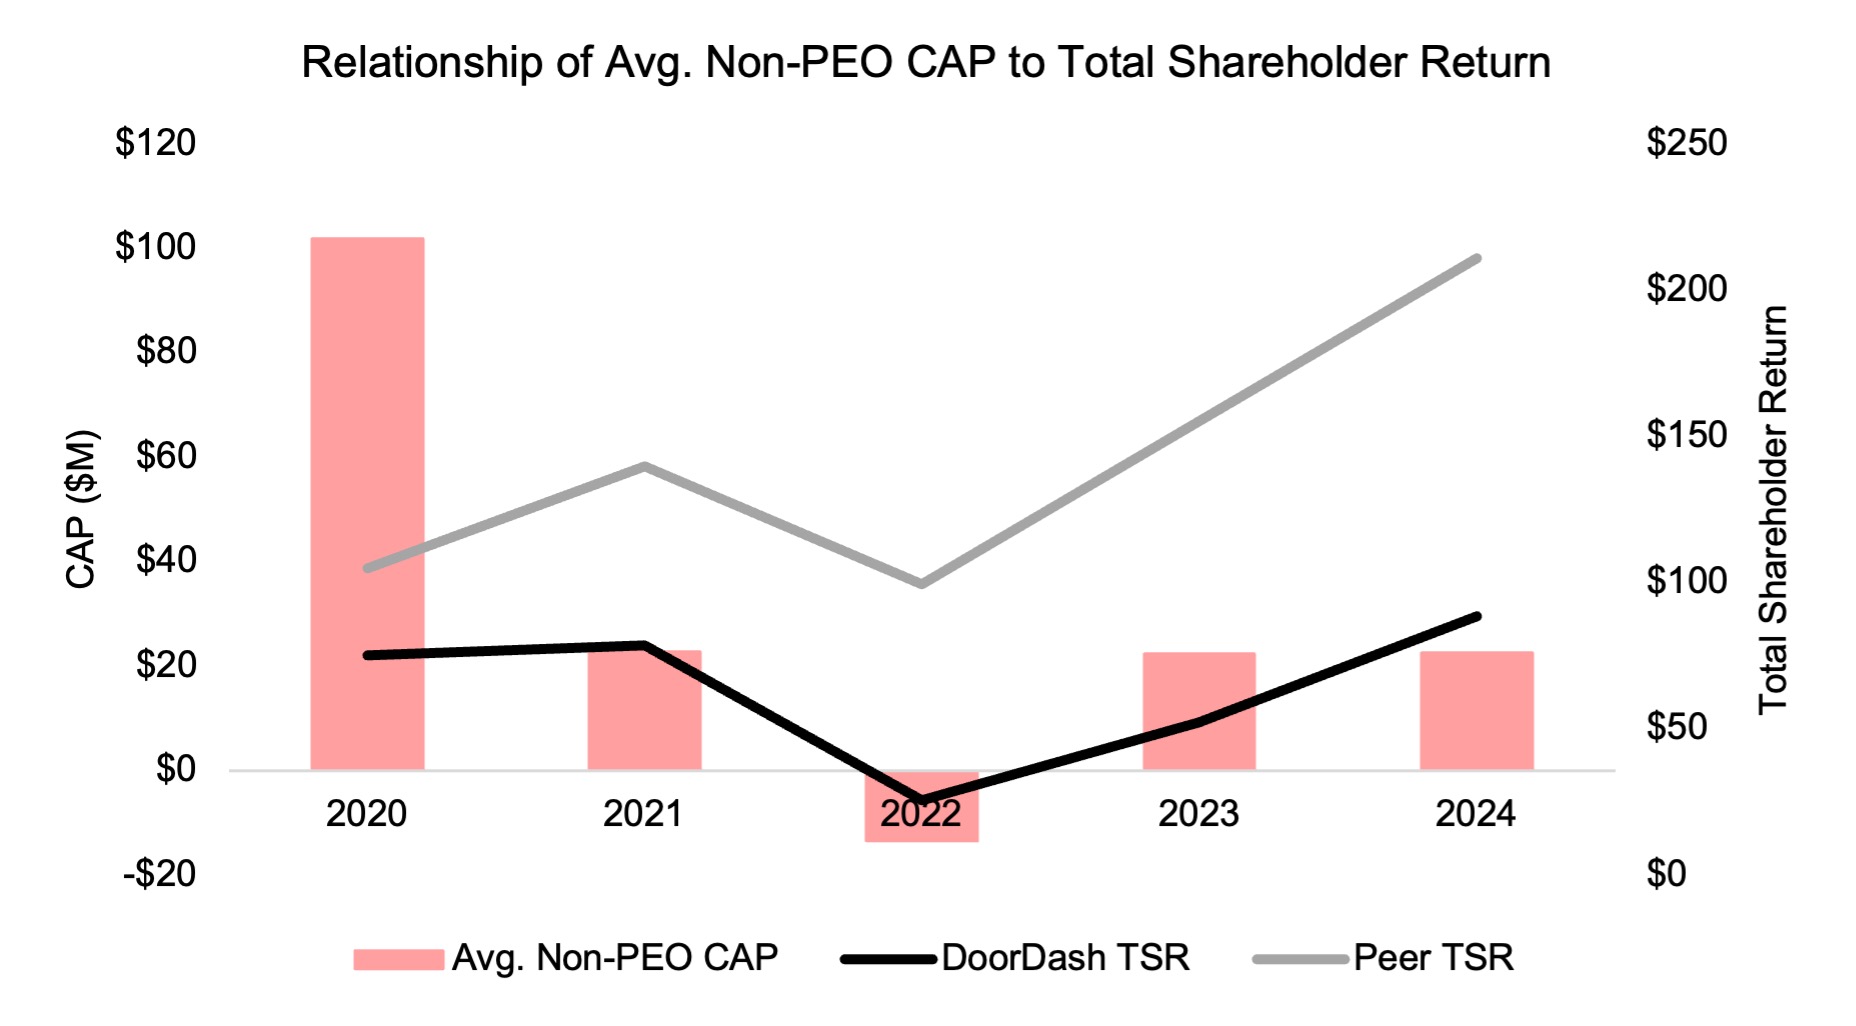
Total Shareholder Return (“TSR”) values provided in this table illustrate the value of an initial investment of $100 in our Class A common stock made at the beginning of each year at the end of such year. The methodology used in this table is the same methodology provided on page 54 of our Annual Report on Form 10-K for the fiscal year ended December 31, 2024, page 57 of our Annual Report on Form 10-K for the fiscal year ended December 31, 2023, page 59 of our Annual Report on Form 10-K for the fiscal year ended December 31, 2022, page 64 of our Annual Report on Form 10-K for the fiscal year ended December 31, 2021, and page 62 of our Annual Report on Form 10-K for the fiscal year ended December 31, 2020. The peer group selected for comparison is the S&P 500 IT Index, which is one of the same peer groups we use to calculate total shareholder return in our Annual Report on Form 10-K.
The table below describes the adjustments, each of which is required by SEC rules, to calculate CAP amounts from the SCT Total of our PEO (Column (b)) and our Other NEOs (Column (d)). The SCT Total and CAP amounts do not reflect the actual amount of compensation earned by or paid to our executives during the applicable years, but rather are amounts determined in accordance with Item 402(v). For a more representative view of the amount of compensation actually realized by our NEOs, see “Option Exercises and Stock Vested in 2024” of this proxy statement. With respect to CAP to our PEO, the assumptions and methodology used to calculate the fair value of equity awards in this table are consistent with the assumptions used to calculate the grant date fair value when the award was granted.
2024 | 2023(1) | 2022(1) | 2021 | 2020 | ||||||||||||||||||||||||||||
| Description of Adjustment | PEO | Average Non-PEO NEOs | PEO | Average Non-PEO NEOs | PEO | Average Non-PEO NEOs | PEO | Average Non-PEO NEOs | PEO | Average Non-PEO NEOs | ||||||||||||||||||||||
| Summary Compensation Table Total | $ | 318,518 | $ | 8,133,018 | $ | 316,275 | $ | 10,831,201 | $ | 300,065 | $ | 10,468,361 | $ | 300,297 | $ | 8,474,204 | $ | 413,669,920 | $ | 4,066,452 | ||||||||||||
| Deduction for amounts reported under the "Stock Awards" and "Option Awards" columns in the Summary Compensation Table for each year | $ | — | $ | (7,701,028) | $ | — | $ | (10,471,303) | $ | — | $ | (7,987,216) | $ | — | $ | (8,123,633) | $ | (413,369,623) | $ | (3,595,893) | ||||||||||||
| ASC 718 fair value of awards granted during the year that remain unvested as of and determined on the last day of each year | $ | — | $ | 8,926,229 | $ | — | $ | 13,410,597 | $ | — | $ | 4,447,851 | $ | — | $ | 8,379,696 | $ | 796,588,250 | $ | 15,049,657 | ||||||||||||
ASC 718 fair value of awards granted during the year that vested during the year, determined as of vest date(2) | $ | — | $ | 1,732,053 | $ | — | $ | 3,223,356 | $ | — | $ | 691,030 | $ | — | $ | — | $ | — | $ | — | ||||||||||||
Change in ASC 718 fair value of awards granted in prior years that are outstanding and unvested as of the last date of the year, determined based on change in ASC 718 fair value from the last date of the prior year to the last date of the year | $ | 313,445,800 | $ | 8,336,140 | $ | 243,698,920 | $ | 3,830,205 | $ | (686,674,640) | $ | (6,215,760) | $ | (36,118,920) | $ | 1,765,460 | $ | — | $ | 56,913,754 | ||||||||||||
Change in ASC 718 fair value for awards granted in prior years that vested during the year, determined based on change from the last day of the previous year to the vest date(2) | $ | — | $ | 3,202,841 | $ | — | $ | 1,518,643 | $ | — | $ | (14,806,672) | $ | — | $ | 12,400,820 | $ | — | $ | 29,531,993 | ||||||||||||
| Total Adjustments (subtotal) | $ | 313,445,800 | $ | 14,496,235 | $ | 243,698,920 | $ | 11,511,498 | $ | (686,674,640) | $ | (23,870,767) | $ | (36,118,920) | $ | 14,422,343 | $ | 383,218,627 | $ | 97,899,511 | ||||||||||||
| Compensation actually paid | $ | 313,764,318 | $ | 22,629,253 | $ | 244,015,195 | $ | 22,342,699 | $ | (686,374,575) | $ | (13,402,406) | $ | (35,818,623) | $ | 22,896,547 | $ | 796,888,547 | $ | 101,965,963 | ||||||||||||
(1) The 2023 and 2022 SCT Totals and CAP to our PEO and Other NEOs, as previously disclosed in our proxy statement dated April 26, 2024, included the value of payments made on behalf of such named executive officers related to basic life insurance premiums, which is a broad-based benefit that is available generally to all salaried employees and does not discriminate in scope, terms, or operation in favor of our executive officers. As contemplated by SEC disclosure rules, such broad-based benefits are not required to be reported as compensation to named executive officers. Accordingly, the value of these benefits has been removed from, and revised amounts are now presented in, the 2023 and 2022 SCT Totals and CAP amounts in the table above.
(2) Consistent with footnote 2 of the “Option Exercises and Stock Vested in 2024” table above, the fair value of awards that vested during 2024 has been computed by multiplying the number of shares acquired on vesting by the closing price of our Class A common stock on the trading day immediately preceding the applicable vesting date. As previously disclosed in our proxy statement dated April 26, 2024, for purposes of this table, the fair value of awards that vested (i) during 2023, 2022 and 2021 was computed by multiplying the number of shares acquired on vesting by the closing price of our Class A common stock on the applicable vesting date, and (ii) during 2020 reflects restricted stock units which vested upon the completion of our initial public offering in December 2020 at a per share price of $102.00.
Other adjustments required by Item 402(v) include adjustments for forfeitures, paid dividends, modifications and valuation of pension plans and are excluded from the above table because we did not have any of those elements in our compensation plans for the years covered in this disclosure.