Pay vs Performance Disclosure
|
12 Months Ended |
|
Dec. 31, 2024
USD ($)
|
Dec. 31, 2023
USD ($)
|
Dec. 31, 2022
USD ($)
|
Dec. 31, 2021
USD ($)
|
Dec. 31, 2020
USD ($)
|
| Pay vs Performance Disclosure |
|
|
|
|
|
| Pay vs Performance Disclosure, Table |
| | | | | | | | | | | | | | | | | | | | | | | | | | | | Year | Summary
Compensation
Table Total for
PEO(1) | Compensation Actually Paid to PEO(1)(2) | Average Summary Compensation
Table Total for
Non-PEO
NEOs(3) | Average Compensation Actually Paid to
Non-PEO
NEOs(3)(2) | Value of Initial Fixed $100
Investment Based on: | Net
Income(5) | Annual TSR(6) | Total
Shareholder
Return(4) | Peer Group
Total
Shareholder
Return(4) | | 2024 | 7,830,131 | 8,612,920 | 2,305,263 | 2,342,805 | 83.12 | 92.73 | 327,129 | -5.6% | | 2023 | 7,622,277 | 8,172,651 | 2,442,001 | 2,505,883 | 88.26 | 107.14 | 318,719 | 1.9% | | 2022 | 7,179,497 | 11,733,138 | 2,490,632 | 3,948,594 | 86.49 | 107.11 | 156,563 | 44.6% | | 2021 | 5,775,292 | 8,589,691 | 2,042,922 | 3,465,632 | 59.83 | 67.34 | 114,240 | 32.1% | | 2020 | 2,952,261 | (1,262,832) | 1,010,380 | 351,935 | 45.29 | 56.62 | (742,353) | -54.7% |
|
|
|
|
|
| Company Selected Measure Name |
Annual TSR
|
|
|
|
|
| Named Executive Officers, Footnote |
For 2024, 2023, 2022, 2021 and 2020, our PEO was Mr. Somasundaram.For 2024, 2023 and 2022, our non-PEO NEOs were Messrs. Fisher, Bryant, and Mahoney and Ms. Wright. For 2021, our non-PEO NEOs were Messrs. Fisher, Bryant and Mahoney and Ms. Wright, as well as Jay Nutt, who served as our Senior Vice President and Chief Financial Officer through January 2021. For 2020, our non-PEO NEOs were Messrs. Nutt and Mahoney, Ms. Wright, and Syed Raza, our Senior Vice President and Chief Digital Officer.
|
|
|
|
|
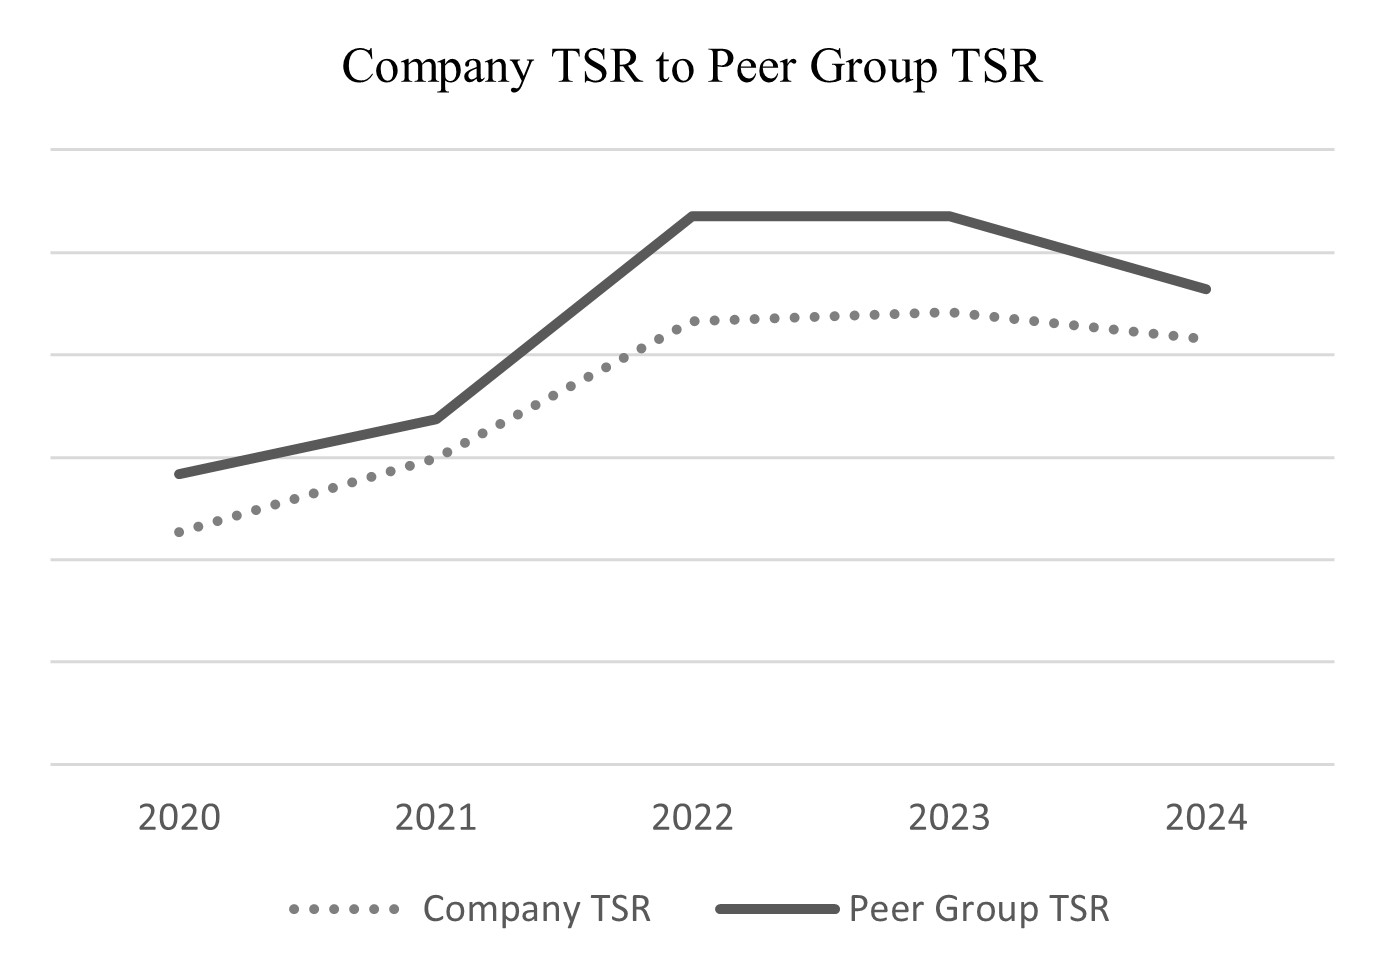
| Peer Group Issuers, Footnote |
The Company TSR and the Company’s Peer Group TSR reflected in these columns for each applicable fiscal year is calculated based on a fixed investment of $100 at the applicable measurement point on the same cumulative basis as is used in Item 201(e) of Regulation S-K. The peer group used to determine the Company’s Peer Group TSR for each applicable fiscal year is the following published industry index, as disclosed in our Annual Report on Form 10-K for the year ended December 31, 2024 pursuant to Item 201(e) of Regulation S-K: Philadelphia Oil Service Index (PHLX).
|
|
|
|
|
| PEO Total Compensation Amount |
$ 7,830,131
|
$ 7,622,277
|
$ 7,179,497
|
$ 5,775,292
|
$ 2,952,261
|
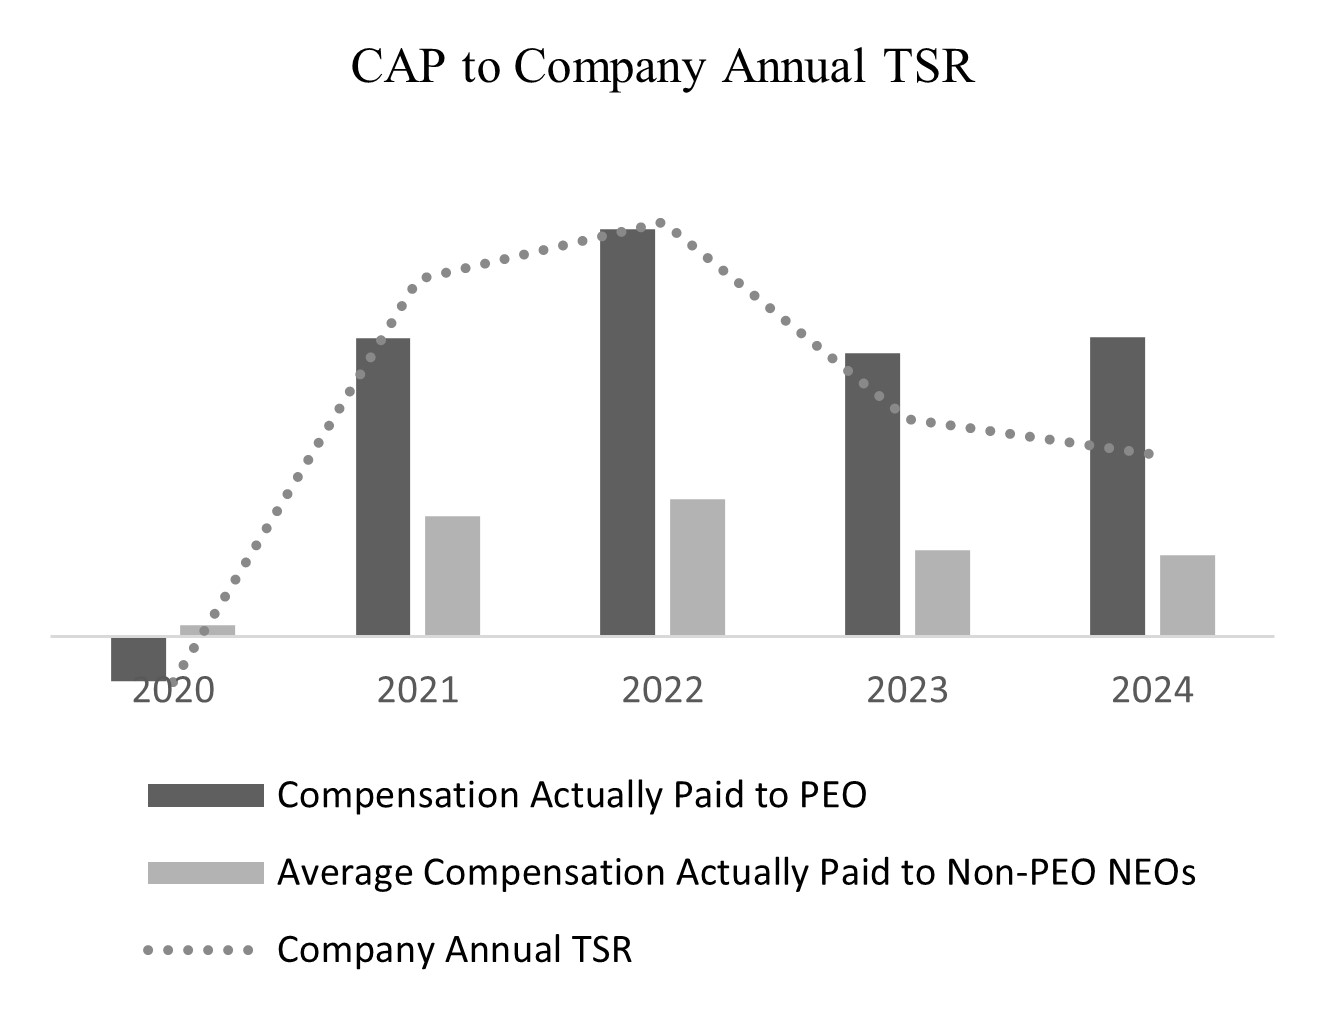
| PEO Actually Paid Compensation Amount |
$ 8,612,920
|
8,172,651
|
11,733,138
|
8,589,691
|
(1,262,832)
|
| Adjustment To PEO Compensation, Footnote |
In calculating the “compensation actually paid” amounts reflected in these columns, the fair value or change in fair value, as applicable, of the equity award adjustments included in such calculations were computed in accordance with FASB ASC Topic 718. The valuation assumptions used to calculate such fair values do not materially differ from the assumptions disclosed at the time of grant. We did not report a change in pension benefit values for any of the years reflected in the table, and therefore adjustments to pension benefit values were not included in calculating “compensation actually paid” amounts reflected in these columns.In the calculation of compensation actually paid and presented in the table, the following amounts were deducted and added: | | | | | | | | | | | | | | | | | | | PEO | 2024 | 2023 | 2022 | 2021 | 2020 | | Total Compensation Reported in Summary Compensation Table for the Year Indicated | 7,830,131 | 7,622,277 | 7,179,497 | 5,775,292 | 2,952,261 | | Less, Grant Date Fair Value of Stock Awards Reported in the Summary Compensation Table for the Year Indicated | (5,486,640) | (5,373,069) | (5,203,750) | (3,932,766) | (1,641,944) | | Plus, Year-End Fair Value of Awards Granted in the Year Indicated that were Outstanding and Unvested at Year-End of Such Year | 4,968,652 | 4,620,574 | 7,255,445 | 4,532,494 | 2,642,678 | | Plus, Change in Fair Value of Awards Granted in Prior Years that were Outstanding and Unvested at Year-End (From Prior Year-End to Year-End) | 1,246,950 | 344,365 | 2,281,142 | 942,330 | (3,816,849) | | Plus, Change in Fair Value of Awards Granted in Prior Years that Vested in the Year Indicated (From Prior Year-End to Vesting Date) | 53,827 | 958,505 | 220,805 | 1,272,342 | (1,398,978) | | Total Adjustments | 782,789 | 550,374 | 4,553,641 | 2,814,399 | (4,215,093) |
|
|
|
|
|
| Non-PEO NEO Average Total Compensation Amount |
$ 2,305,263
|
2,442,001
|
2,490,632
|
2,042,922
|
1,010,380
|
| Non-PEO NEO Average Compensation Actually Paid Amount |
$ 2,342,805
|
2,505,883
|
3,948,594
|
3,465,632
|
351,935
|
| Adjustment to Non-PEO NEO Compensation Footnote |
In calculating the “compensation actually paid” amounts reflected in these columns, the fair value or change in fair value, as applicable, of the equity award adjustments included in such calculations were computed in accordance with FASB ASC Topic 718. The valuation assumptions used to calculate such fair values do not materially differ from the assumptions disclosed at the time of grant. We did not report a change in pension benefit values for any of the years reflected in the table, and therefore adjustments to pension benefit values were not included in calculating “compensation actually paid” amounts reflected in these columns. | | | | | | | | | | | | | | | | | | | Average of Non-PEO NEOs | 2024 | 2023 | 2022 | 2021 | 2020 | | Average Total Compensation Reported in Summary Compensation Table for the Year Indicated | 2,305,263 | 2,442,001 | 2,490,632 | 2,042,922 | 1,010,380 | | Less, Average Grant Date Fair Value of Stock Awards Reported in the Summary Compensation Table for the Year Indicated | (1,188,758) | (1,336,536) | (1,432,023) | (1,099,468) | (383,067) | | Plus, Average Year-End Fair Value of Awards Granted in the Year Indicated that were Outstanding and Unvested at Year-End of Such Year | 502,537 | 574,677 | 1,002,840 | 633,505 | 303,859 | | Plus, Vesting Date Fair Value of Awards Granted in the Year Indicated that Vested in Such Year | 271,104 | — | — | — | — | | Plus, Average Change in Fair Value of Awards Granted in Prior Years that were Outstanding and Unvested at Year-End (From Prior Year-End to Year-End) | 69,465 | 69,353 | 251,642 | 230,016 | (329,187) | | Plus, Average Change in Fair Value of Awards Granted in Prior Years that Vested in the Year Indicated (From Prior Year-End to Vesting Date) | 41,148 | 74,905 | 253,855 | 679,155 | (149,815) | | Average Total Adjustments | 105,318 | 63,881 | 1,457,962 | 1,450,698 | (658,446) |
|
|
|
|
|
| Compensation Actually Paid vs. Total Shareholder Return |
|
|
|
|
|
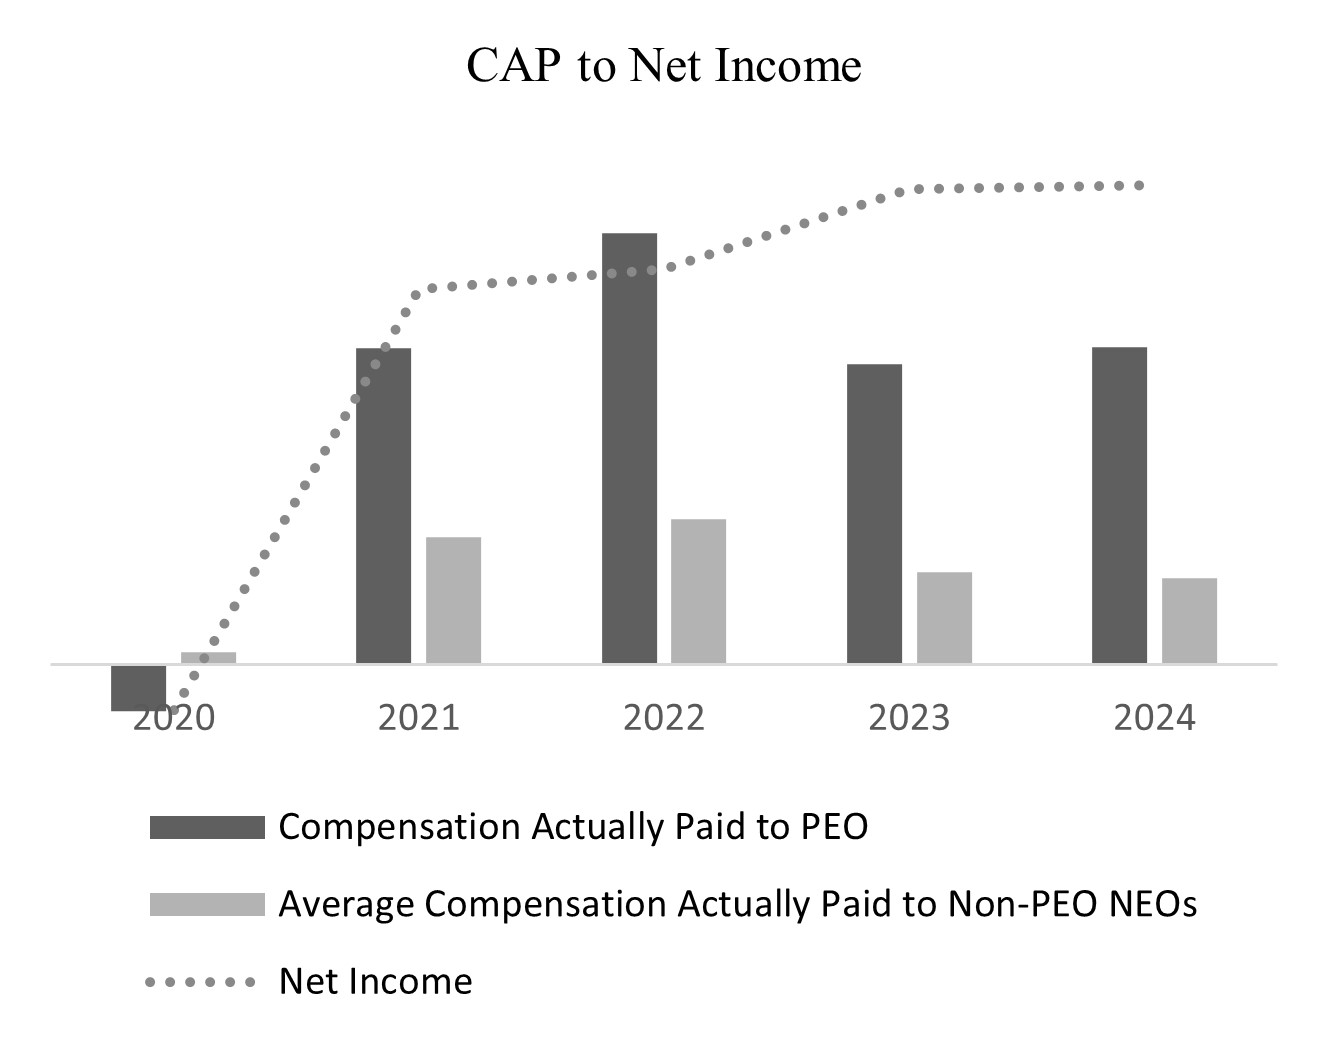
| Compensation Actually Paid vs. Net Income |
|
|
|
|
|
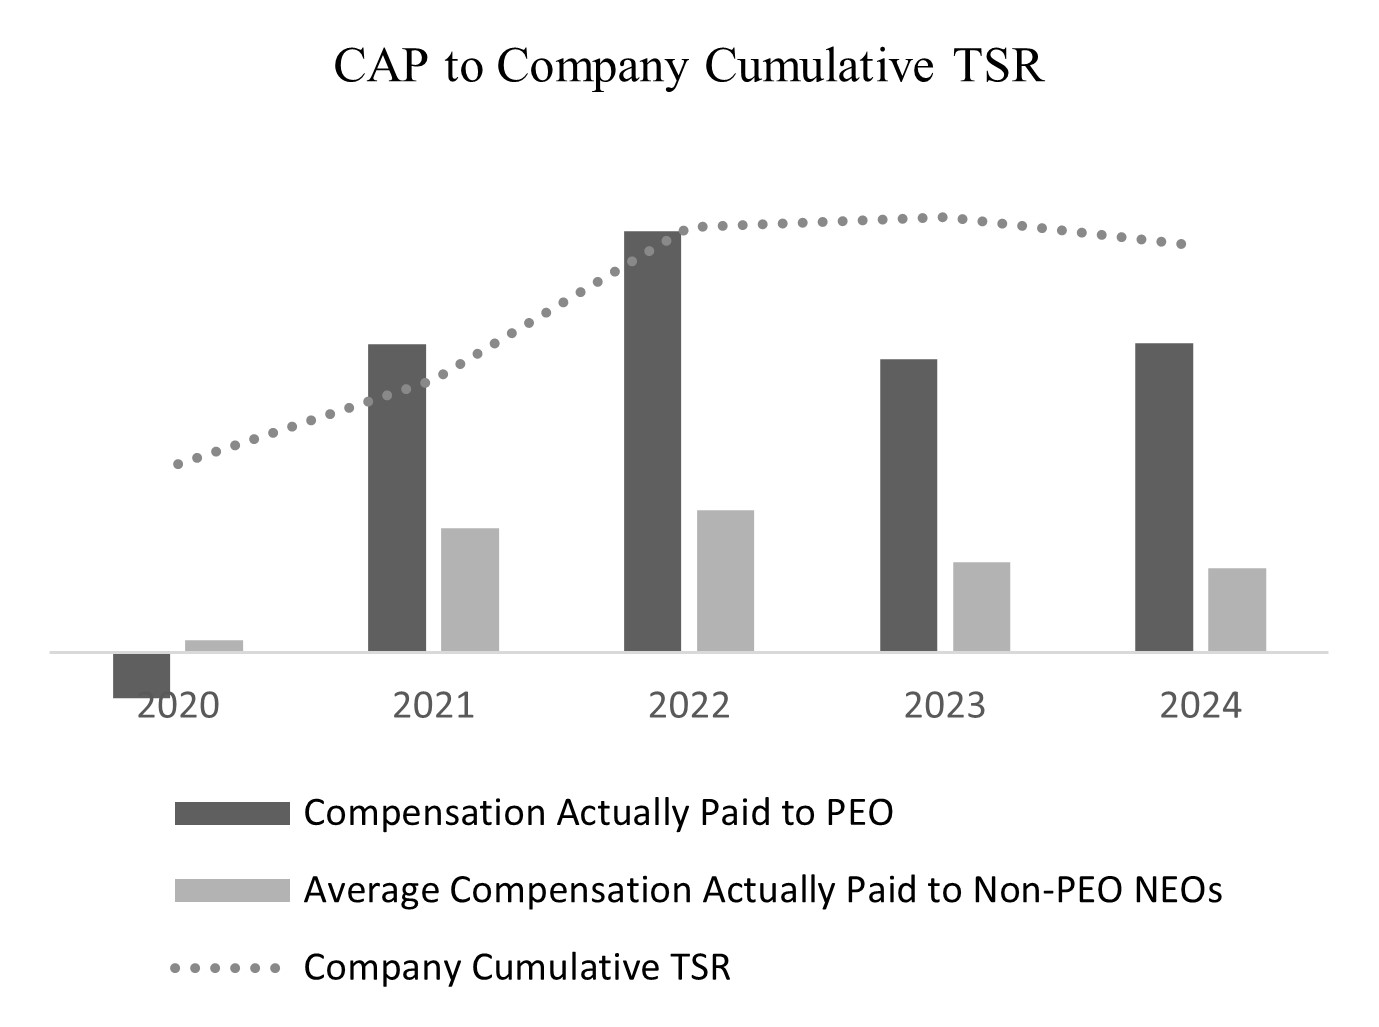
| Compensation Actually Paid vs. Company Selected Measure |
|
|
|
|
|
| Total Shareholder Return Vs Peer Group |
|
|
|
|
|
| Tabular List, Table |
Most Important Financial Measures Annual TSR Consolidated Adjusted EBITDA Consolidated Adjusted Free Cash Flow
|
|
|
|
|
| Total Shareholder Return Amount |
$ 83.12
|
88.26
|
86.49
|
59.83
|
45.29
|
| Peer Group Total Shareholder Return Amount |
92.73
|
107.14
|
107.11
|
67.34
|
56.62
|
| Net Income (Loss) |
$ 327,129
|
$ 318,719
|
$ 156,563
|
$ 114,240
|
$ 742,353
|
| Company Selected Measure Amount |
(5.6)
|
1.9
|
44.6
|
32.1
|
(54.7)
|
| PEO Name |
Mr. Somasundaram
|
|
|
|
|
| Additional 402(v) Disclosure |
Represents, in thousands, the amount of net income reflected in the Company’s audited financial statements for the year indicated.
|
|
|
|
|
| Measure:: 1 |
|
|
|
|
|
| Pay vs Performance Disclosure |
|
|
|
|
|
| Name |
Annual TSR
|
|
|
|
|
| Non-GAAP Measure Description |
We have selected Annual TSR as our most important financial measure (that is not otherwise required to be disclosed in the table) used to link “compensation actually paid” to our NEOs to company performance for fiscal year 2024. Annual TSR is expressed as a percentage and calculated using the following formula: (a) the sum of the closing price of the Company’s Common Stock on the last business day of the fiscal year plus dividends per share paid in that year, less (b) the closing price of the Company’s Common Stock on the last business day of the prior fiscal year, divided by (c) the closing price of the Company’s Common Stock on the last business day of the prior fiscal year.
|
|
|
|
|
| Measure:: 2 |
|
|
|
|
|
| Pay vs Performance Disclosure |
|
|
|
|
|
| Name |
Consolidated Adjusted EBITDA
|
|
|
|
|
| Measure:: 3 |
|
|
|
|
|
| Pay vs Performance Disclosure |
|
|
|
|
|
| Name |
Consolidated Adjusted Free Cash Flow
|
|
|
|
|
| PEO |
|
|
|
|
|
| Pay vs Performance Disclosure |
|
|
|
|
|
| Adjustment to Compensation, Amount |
$ 782,789
|
$ 550,374
|
$ 4,553,641
|
$ 2,814,399
|
$ (4,215,093)
|
| PEO | Year-end Fair Value of Equity Awards Granted in Covered Year that are Outstanding and Unvested |
|
|
|
|
|
| Pay vs Performance Disclosure |
|
|
|
|
|
| Adjustment to Compensation, Amount |
4,968,652
|
4,620,574
|
7,255,445
|
4,532,494
|
2,642,678
|
| PEO | Year-over-Year Change in Fair Value of Equity Awards Granted in Prior Years That are Outstanding and Unvested |
|
|
|
|
|
| Pay vs Performance Disclosure |
|
|
|
|
|
| Adjustment to Compensation, Amount |
1,246,950
|
344,365
|
2,281,142
|
942,330
|
(3,816,849)
|
| PEO | Vesting Date Fair Value of Equity Awards Granted and Vested in Covered Year |
|
|
|
|
|
| Pay vs Performance Disclosure |
|
|
|
|
|
| Adjustment to Compensation, Amount |
(5,486,640)
|
(5,373,069)
|
(5,203,750)
|
(3,932,766)
|
(1,641,944)
|
| PEO | Change in Fair Value as of Vesting Date of Prior Year Equity Awards Vested in Covered Year |
|
|
|
|
|
| Pay vs Performance Disclosure |
|
|
|
|
|
| Adjustment to Compensation, Amount |
53,827
|
958,505
|
220,805
|
1,272,342
|
(1,398,978)
|
| Non-PEO NEO |
|
|
|
|
|
| Pay vs Performance Disclosure |
|
|
|
|
|
| Adjustment to Compensation, Amount |
105,318
|
63,881
|
1,457,962
|
1,450,698
|
(658,446)
|
| Non-PEO NEO | Year-end Fair Value of Equity Awards Granted in Covered Year that are Outstanding and Unvested |
|
|
|
|
|
| Pay vs Performance Disclosure |
|
|
|
|
|
| Adjustment to Compensation, Amount |
502,537
|
574,677
|
1,002,840
|
633,505
|
303,859
|
| Non-PEO NEO | Year-over-Year Change in Fair Value of Equity Awards Granted in Prior Years That are Outstanding and Unvested |
|
|
|
|
|
| Pay vs Performance Disclosure |
|
|
|
|
|
| Adjustment to Compensation, Amount |
271,104
|
0
|
0
|
0
|
0
|
| Non-PEO NEO | Vesting Date Fair Value of Equity Awards Granted and Vested in Covered Year |
|
|
|
|
|
| Pay vs Performance Disclosure |
|
|
|
|
|
| Adjustment to Compensation, Amount |
(1,188,758)
|
(1,336,536)
|
(1,432,023)
|
(1,099,468)
|
(383,067)
|
| Non-PEO NEO | Change in Fair Value as of Vesting Date of Prior Year Equity Awards Vested in Covered Year |
|
|
|
|
|
| Pay vs Performance Disclosure |
|
|
|
|
|
| Adjustment to Compensation, Amount |
69,465
|
69,353
|
251,642
|
230,016
|
(329,187)
|
| Non-PEO NEO | Prior Year End Fair Value of Equity Awards Granted in Any Prior Year that Fail to Meet Applicable Vesting Conditions During Covered Year |
|
|
|
|
|
| Pay vs Performance Disclosure |
|
|
|
|
|
| Adjustment to Compensation, Amount |
$ 41,148
|
$ 74,905
|
$ 253,855
|
$ 679,155
|
$ (149,815)
|