Pay vs Performance Disclosure - USD ($)
Dec. 31, 2022
Nov. 07, 2022
Dec. 31, 2024
Dec. 31, 2023
Dec. 31, 2022
Pay Versus Performance
As required by Section 953(a) of the Dodd-Frank Act and Item 402(v) of Regulation S-K, we are providing the following information about the relationship between compensation actually paid (“CAP”) to our principal executive officers (“PEOs”) and our non-PEO Named Executive Officers (“Non-PEO NEOs”) and certain financial performance of the Company. Also as required by the SEC, this section compares CAP to various measures used to gauge performance at the Company. Accordingly, the table below includes the following “Company-Selected Measure” as defined in Item 402(v) of Regulation S-K: Revenue. The disclosure included in this section is prescribed by SEC rules and does not necessarily align with how the Company or the Compensation Committee view the link between the Company’s performance and named executive officer pay and the Compensation Committee did not consider the disclosure below in making its pay decisions for any of the years shown. For information on our executive compensation program and the Compensation Committee’s approach, refer to the above Narrative Disclosure to Summary Compensation Table and Outstanding Equity Awards at Fiscal Year-End table.
Pay Versus Performance
| | | | | | Value of Initial Fixed $100 Investment Based On: | ||||||||||||||||||||
Year | Summary Compensation Table Total for Mr. Francis(1) ($) | Summary Compensation Table Total for Mr. Beals(1) ($) | CAP to Mr. Francis(2) ($) | CAP to Mr. Beals(2) ($) | Average Summary Compensation Table Total for Non-PEO NEOs(3) ($) | Average CAP to Non-PEO NEOs(4) ($) | Total Shareholder Return(5) ($) | Net Income (Loss) (millions)(6) ($) | ||||||||||||||||||
2024 | 7,509,027 | N/A | 12,875,782(7) | N/A | 599,267 | 634,857(7) | $23.08 | $12.2 | ||||||||||||||||||
2023 | 1,162,045 | N/A | 1,153,035(7) | N/A | 1,593,985 | 1,186,043(7) | $12.04 | $(15.7) | ||||||||||||||||||
2022 | 263,058 | 2,136,675 | (2,043) | (4,133,509) | 743,179 | (3,158,242) | $16.89 | $(82.7) | ||||||||||||||||||
1. | The dollar amounts reported are total compensation reported for Messrs. Francis (our Chairperson of the Board and Principal Executive Officer since November 7, 2022) and Beals (our former Chief Executive Officer and former Principal Executive Officer from January 1, 2022 through November 7, 2022) for each corresponding year in the “Total” column of the Summary Compensation Table. Refer to “Executive Compensation—Summary Compensation Table. |
2. | The dollar amounts reported represent CAP to Messrs. Francis and Beals as computed in accordance with Item 402(v) of Regulation S-K. The dollar amounts do not reflect the actual amount of compensation earned by or paid to Messrs. Francis and Beals during the applicable year adjusted in accordance with the requirements of Item 402(v) of Regulation S-K. |
3. | The dollar amounts reported represent the average of the amounts reported for Non-PEO NEOs in the “Total” column of the Summary Compensation Table in each applicable year. The Non-PEO NEOs included for purposes of calculating the average amounts in each applicable year are as follows: (i) for 2024, Brian Camire, General Counsel, Susan Echard. Chief Financial Officer and Duncan Grazier, Chief Technology Officer; and (ii) for 2023, Brian Camire, General Counsel and Duncan Grazier, Chief Technology Officer; and (iii) for 2022, Arden Lee, Chief Financial Officer; Messrs. Camire and Grazier; Juanjo Feijoo, former Chief Operating Officer and Justin Dean, former Chief Technology Officer and Chief Information Officer. |
4. | The dollar amounts reported represent the average amount of CAP to Non-PEO NEOs, as computed in accordance with Item 402(v) of Regulation S-K. The dollar amounts do not reflect the actual average amount of compensation earned by or paid to Non-PEO NEOs during the applicable year adjusted in accordance with the requirements of Item 402(v) of Regulation S-K. |
5. | The dollar amounts reported represent the cumulative Total Shareholder Return (“TSR”) on a fixed investment of $100 in the Company’s Class A Common Stock, including the cumulative amount of dividends, for the measurement period assuming dividend reinvestment. For this year’s disclosure, the Company has updated the start date of the measurement period from the Closing Date of the Business Combination to December 31, 2021 to align with the Company’s fiscal year and standard market practice. As a result, TSR values for 2022 and 2023 presented in this year’s table may differ from the TSR values shown for those years in the prior year’s Pay Versus Performance disclosure. The Company believes this change enhances comparability going forward and will apply this methodology consistently in future disclosures. |
6. | The dollar amounts for Net Income (Loss) reported represent the amount reflected in the Company’s audited financial statements for the applicable year. |
7. | For fiscal year 2024, the CAP to our PEO and the average CAP to the Non-PEO NEOs reflect the following adjustments made to the total compensation amounts reported in the Summary Compensation Table for fiscal year 2024, computed in accordance with Item 402(v) of Regulation S-K: |
Fiscal Year | Mr. Francis (PEO) 2024 | Non-PEO NEOs (Average) 2024 | ||||||
Summary Compensation Table total | 7,509,027 | 599,267 | ||||||
Less: Grant Date Fair Value of Stock Awards Columns in the Summary Compensation Table for Applicable Fiscal Year* | (4,993,750) | — | ||||||
± Fair Value at Applicable Fiscal Year-End of Awards Granted during Applicable Fiscal Year that Remain Unvested as of Applicable Fiscal Year End* | 10,350,410 | — | ||||||
± Change in Fair Value from the end of the Prior Fiscal Year to the end of the Applicable Fiscal Year of Awards Granted during Prior Fiscal Year that were Outstanding and Unvested as of Applicable Fiscal Year End* | — | 84,081 | ||||||
± Vesting Date Fair Value of Awards Granted in Applicable Fiscal Year that Vested During Applicable Fiscal Year* | — | — | ||||||
± Change in Fair Value from the end of the Prior Fiscal Year to the Vesting Date of Awards Granted during Prior Fiscal Year that Vested During Applicable Fiscal Year* | 10,094 | 56,141 | ||||||
- Fair Value at Prior Year End of Awards Granted during Prior Fiscal Year that were Forfeited during Applicable Fiscal Year* | — | (104,632) | ||||||
Other earnings paid on equity awards prior to the vesting date | — | — | ||||||
CAP | 12,875,782 | 634,857 | ||||||
* | The valuation assumptions used to calculate fair values did not materially differ from those disclosed at the time of grant. |
1. | The dollar amounts reported are total compensation reported for Messrs. Francis (our Chairperson of the Board and Principal Executive Officer since November 7, 2022) and Beals (our former Chief Executive Officer and former Principal Executive Officer from January 1, 2022 through November 7, 2022) for each corresponding year in the “Total” column of the Summary Compensation Table. Refer to “Executive Compensation—Summary Compensation Table. |
3. | The dollar amounts reported represent the average of the amounts reported for Non-PEO NEOs in the “Total” column of the Summary Compensation Table in each applicable year. The Non-PEO NEOs included for purposes of calculating the average amounts in each applicable year are as follows: (i) for 2024, Brian Camire, General Counsel, Susan Echard. Chief Financial Officer and Duncan Grazier, Chief Technology Officer; and (ii) for 2023, Brian Camire, General Counsel and Duncan Grazier, Chief Technology Officer; and (iii) for 2022, Arden Lee, Chief Financial Officer; Messrs. Camire and Grazier; Juanjo Feijoo, former Chief Operating Officer and Justin Dean, former Chief Technology Officer and Chief Information Officer. |
7. | For fiscal year 2024, the CAP to our PEO and the average CAP to the Non-PEO NEOs reflect the following adjustments made to the total compensation amounts reported in the Summary Compensation Table for fiscal year 2024, computed in accordance with Item 402(v) of Regulation S-K: |
Fiscal Year | Mr. Francis (PEO) 2024 | Non-PEO NEOs (Average) 2024 | ||||||
Summary Compensation Table total | 7,509,027 | 599,267 | ||||||
Less: Grant Date Fair Value of Stock Awards Columns in the Summary Compensation Table for Applicable Fiscal Year* | (4,993,750) | — | ||||||
± Fair Value at Applicable Fiscal Year-End of Awards Granted during Applicable Fiscal Year that Remain Unvested as of Applicable Fiscal Year End* | 10,350,410 | — | ||||||
± Change in Fair Value from the end of the Prior Fiscal Year to the end of the Applicable Fiscal Year of Awards Granted during Prior Fiscal Year that were Outstanding and Unvested as of Applicable Fiscal Year End* | — | 84,081 | ||||||
± Vesting Date Fair Value of Awards Granted in Applicable Fiscal Year that Vested During Applicable Fiscal Year* | — | — | ||||||
± Change in Fair Value from the end of the Prior Fiscal Year to the Vesting Date of Awards Granted during Prior Fiscal Year that Vested During Applicable Fiscal Year* | 10,094 | 56,141 | ||||||
- Fair Value at Prior Year End of Awards Granted during Prior Fiscal Year that were Forfeited during Applicable Fiscal Year* | — | (104,632) | ||||||
Other earnings paid on equity awards prior to the vesting date | — | — | ||||||
CAP | 12,875,782 | 634,857 | ||||||
* | The valuation assumptions used to calculate fair values did not materially differ from those disclosed at the time of grant. |
The graph below illustrates the relationship between CAP to our PEOs and CAP to our Non-PEO NEOs.

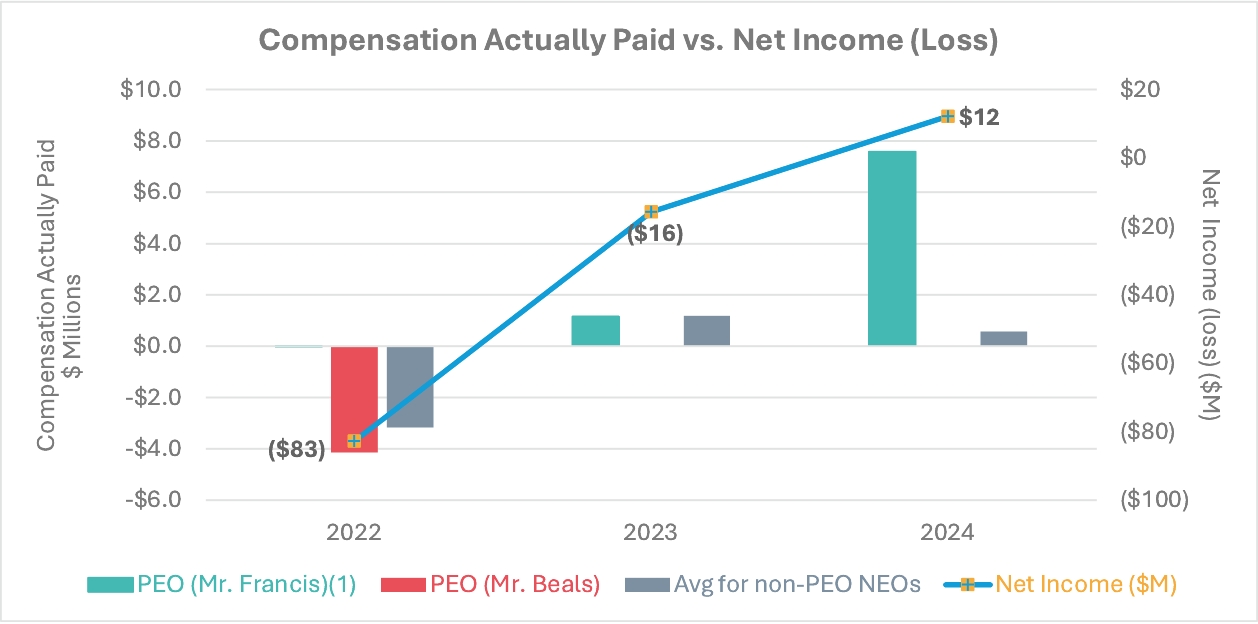
The graph below illustrates the relationship between Net (loss) Income and PEO CAP and Average Non-PEO NEOs CAP.