Shareholder Report
Feb. 28, 2025
USD ($)
Holding
What were the Fund’s costs for the last year ?
(based on a hypothetical $10,000 investment)
| Share Class | Costs of a $10,000 investment | Costs paid as a percentage of a $10,000 investment |
| Class A* | $110 | 1.03% |
| * |
During the period, fees were waived and/or expenses reimbursed pursuant to an agreement with the Fund’s investment adviser, BNY Mellon Investment Adviser, Inc. If this agreement is not extended in the future, expenses could be higher.
|
How did the Fund perform last year ?
-
For the 12-month period ended February 28, 2025, the Fund’s Class A shares returned 12.69%.
-
In comparison, the Russell 1000® Growth Index returned 19.75% for the same period.
What affected the Fund’s performance?
-
U.S. equities were most impacted by rising inflation, which led to interest rates hikes by the Federal Reserve. Geopolitical tensions, particularly the conflict in Ukraine, fueled volatility and investor uncertainty.
-
The technology-related industries faced sell-offs due to concerns over valuations and future growth prospects.
-
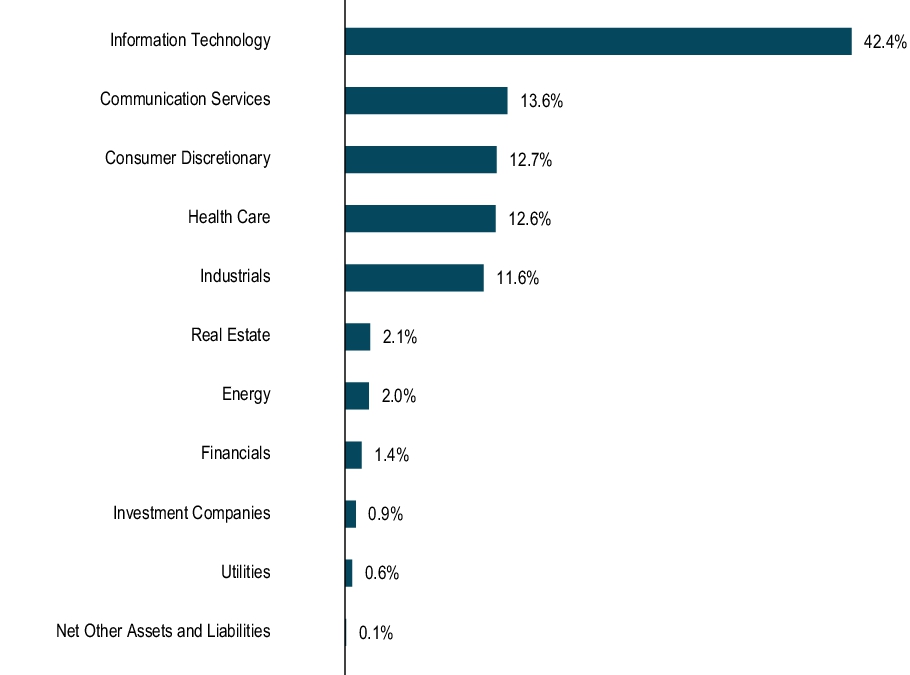
The Fund benefited most from selections across the Information Technology and Communications Services sectors, especially among Artificial Intelligence-related and Internet-related companies, respectively.
-
The sectors that detracted most were Health care, Financials, and Consumer Staples. In Health care, our overweight allocation and stock selection both weighed on relative results. In Financials and Consumer Staples, stock selections were the primary hindrance.
| Not FDIC Insured. Not Bank-Guaranteed. May Lose Value |
How did the Fund perform over the past 10 years?
The Fund’s past performance is not a good predictor of the Fund’s future performance. The graph and table do not reflect the deduction of taxes that a shareholder would pay on fund distributions or redemption of fund shares.
Cumulative Performance from March 1 , 2015 through February 28, 2025
Initial Investment of $10,000
Initial Investment of $10,000
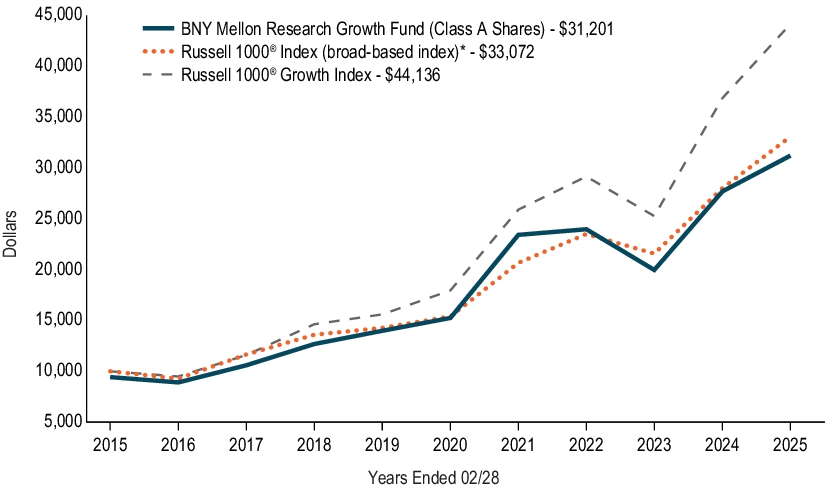
The above graph compares a hypothetical $10,000 investment in the Fund’s Class A shares to a hypothetical investment of $10,000 made in each of the Russell 1000® Index (a broad-based index) and Russell 1000® Growth Index on 2/28/2015. The performance shown takes into account the maximum initial sales charge on Class A shares and applicable fees and expenses of the Fund, including management fees and other expenses. The Fund’s performance also assumes the reinvestment of dividends and capital gains. Unlike the Fund, the indexes are not subject to charges, fees and other expenses. Investors cannot invest directly in any index.
AVERAGE ANNUAL TOTAL RETURNS (AS OF 2/28/25 )
| Class A Shares | 1YR | 5YR | 10YR | |||
| with Maximum Sales Charge - 5.75% | 6.20% | 14.03% | 12.05% | |||
| without Sales Charge | 12.69% | 15.40% | 12.71% | |||
| Russell 1000® Index (broad-based index)* | 18.11% | 16.54% | 12.71% | |||
| Russell 1000® Growth Index | 19.75% | 19.71% | 16.01% |
|
*
|
In accordance with regulatory changes requiring the Fund’s primary benchmark to represent the overall applicable market, the Fund’s primary prospectus benchmark changed to the indicated benchmark effective as of February 28, 2025.
|
KEY FUND STATISTICS (AS OF 2/28/25 )
Fund Size (Millions) |
Number of Holdings |
Total Advisory Fee Paid During Period |
Annual Portfolio Turnover |
| $1,602 | 52 | $12,241,650 | 27.94% |
| Not FDIC Insured. Not Bank-Guaranteed. May Lose Value |
Portfolio Holdings (as of 2/28/25 )
Top Ten Holdings (Based on Net Assets) *

* Excludes money market funds or other short-term securities held for the investment of cash and cash collateral for securities loaned, if any.
Sector Allocation (Based on Net Assets)

| Not FDIC Insured. Not Bank-Guaranteed. May Lose Value |
Top Ten Holdings (Based on Net Assets) *
* Excludes money market funds or other short-term securities held for the investment of cash and cash collateral for securities loaned, if any.
What were the Fund’s costs for the last year ?
(based on a hypothetical $10,000 investment)
| Share Class | Costs of a $10,000 investment | Costs paid as a percentage of a $10,000 investment |
| Class C* | $189 | 1.78% |
| * |
During the period, fees were waived and/or expenses reimbursed pursuant to an agreement with the Fund’s investment adviser, BNY Mellon Investment Adviser, Inc. If this agreement is not extended in the future, expenses could be higher.
|
How did the Fund perform last year ?
-
For the 12-month period ended February 28, 2025, the Fund’s Class C shares returned 11.84%.
-
In comparison, the Russell 1000® Growth Index returned 19.75% for the same period.
What affected the Fund’s performance?
-
U.S. equities were most impacted by rising inflation, which led to interest rates hikes by the Federal Reserve. Geopolitical tensions, particularly the conflict in Ukraine, fueled volatility and investor uncertainty.
-
The technology-related industries faced sell-offs due to concerns over valuations and future growth prospects.
-
The Fund benefited most from selections across the Information Technology and Communications Services sectors, especially among Artificial Intelligence-related and Internet-related companies, respectively.
-
The sectors that detracted most were Health care, Financials, and Consumer Staples. In Health care, our overweight allocation and stock selection both weighed on relative results. In Financials and Consumer Staples, stock selections were the primary hindrance.
Not FDIC Insured. Not Bank-Guaranteed. May Lose Value
How did the Fund perform over the past 10 years?
The Fund’s past performance is not a good predictor of the Fund’s future performance. The graph and table do not reflect the deduction of taxes that a shareholder would pay on fund distributions or redemption of fund shares.
Cumulative Performance from March 1 , 2015 through February 28, 2025
Initial Investment of $10,000
Initial Investment of $10,000
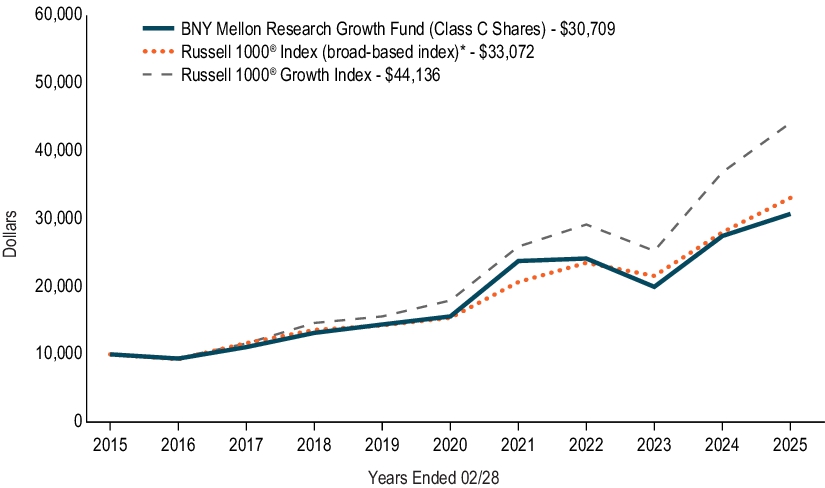
The above graph compares a hypothetical $10,000 investment in the Fund’s Class C shares to a hypothetical investment of $10,000 made in each of the Russell 1000® Index (a broad-based index) and Russell 1000® Growth Index on 2/28/2015. The performance shown takes into account the maximum deferred sales charge on Class C shares and applicable fees and expenses of the Fund, including management fees, 12b-1 fees and other expenses. The Fund’s performance also assumes the reinvestment of dividends and capital gains. Unlike the Fund, the indexes are not subject to charges, fees and other expenses. Investors cannot invest directly in any index.
AVERAGE ANNUAL TOTAL RETURNS (AS OF 2/28/25 )
| Class C Shares | 1YR | 5YR | 10YR | |||
| with Maximum Deferred Sales Charge - 1.00% | 10.84% |
**
|
14.52% | 11.87% | ||
| without Deferred Sales Charge | 11.84% | 14.52% | 11.87% | |||
| Russell 1000® Index (broad-based index)* | 18.11% | 16.54% | 12.71% | |||
| Russell 1000® Growth Index | 19.75% | 19.71% | 16.01% |
|
*
|
In accordance with regulatory changes requiring the Fund’s primary benchmark to represent the overall applicable market, the Fund’s primary prospectus benchmark changed to the indicated benchmark effective as of February 28, 2025.
|
|
**
|
The maximum contingent deferred sales charge for Class C shares is 1.00% for shares redeemed within one year of the date purchased.
|
KEY FUND STATISTICS (AS OF 2/28/25 )
Fund Size (Millions) |
Number of Holdings |
Total Advisory Fee Paid During Period |
Annual Portfolio Turnover |
| $1,602 | 52 | $12,241,650 | 27.94% |
| Not FDIC Insured. Not Bank-Guaranteed. May Lose Value |
Portfolio Holdings (as of 2/28/25 )
Top Ten Holdings (Based on Net Assets) *

* Excludes money market funds or other short-term securities held for the investment of cash and cash collateral for securities loaned, if any.
Sector Allocation (Based on Net Assets)
| Not FDIC Insured. Not Bank-Guaranteed. May Lose Value |
Top Ten Holdings (Based on Net Assets) *
* Excludes money market funds or other short-term securities held for the investment of cash and cash collateral for securities loaned, if any.
What were the Fund’s costs for the last year ?
(based on a hypothetical $10,000 investment)
| Share Class | Costs of a $10,000 investment | Costs paid as a percentage of a $10,000 investment |
| Class I* | $83 | 0.78% |
| * |
During the period, fees were waived and/or expenses reimbursed pursuant to an agreement with the Fund’s investment adviser, BNY Mellon Investment Adviser, Inc. If this agreement is not extended in the future, expenses could be higher.
|
How did the Fund perform last year ?
-
For the 12-month period ended February 28, 2025, the Fund’s Class I shares returned 12.96%.
-
In comparison, the Russell 1000® Growth Index returned 19.75% for the same period.
What affected the Fund’s performance?
-
U.S. equities were most impacted by rising inflation, which led to interest rates hikes by the Federal Reserve. Geopolitical tensions, particularly the conflict in Ukraine, fueled volatility and investor uncertainty.
-
The technology-related industries faced sell-offs due to concerns over valuations and future growth prospects.
-
The Fund benefited most from selections across the Information Technology and Communications Services sectors, especially among Artificial Intelligence-related and Internet-related companies, respectively.
-
The sectors that detracted most were Health care, Financials, and Consumer Staples. In Health care, our overweight allocation and stock selection both weighed on relative results. In Financials and Consumer Staples, stock selections were the primary hindrance.
Not FDIC Insured. Not Bank-Guaranteed. May Lose Value
How did the Fund perform over the past 10 years?
The Fund’s past performance is not a good predictor of the Fund’s future performance. The graph and table do not reflect the deduction of taxes that a shareholder would pay on fund distributions or redemption of fund shares.
Cumulative Performance from March 1 , 2015 through February 28, 2025
Initial Investment of $10,000
Initial Investment of $10,000

The above graph compares a hypothetical $10,000 investment in the Fund’s Class I shares to a hypothetical investment of $10,000 made in each of the Russell 1000® Index (a broad-based index) and Russell 1000® Growth Index on 2/28/2015. The performance shown takes into account applicable fees and expenses of the Fund, including management fees and other expenses. The Fund’s performance also assumes the reinvestment of dividends and capital gains. Unlike the Fund, the indexes are not subject to charges, fees and other expenses. Investors cannot invest directly in any index.
AVERAGE ANNUAL TOTAL RETURNS (AS OF 2/28/25 )
| Share Class | 1YR | 5YR | 10YR | |||
| Class I | 12.96% | 15.68% | 13.00% | |||
| Russell 1000® Index (broad-based index)* | 18.11% | 16.54% | 12.71% | |||
| Russell 1000® Growth Index | 19.75% | 19.71% | 16.01% |
|
*
|
In accordance with regulatory changes requiring the Fund’s primary benchmark to represent the overall applicable market, the Fund’s primary prospectus benchmark changed to the indicated benchmark effective as of February 28, 2025.
|
KEY FUND STATISTICS (AS OF 2/28/25 )
Fund Size (Millions) |
Number of Holdings |
Total Advisory Fee Paid During Period |
Annual Portfolio Turnover |
| $1,602 | 52 | $12,241,650 | 27.94% |
| Not FDIC Insured. Not Bank-Guaranteed. May Lose Value |
Portfolio Holdings (as of 2/28/25 )
Top Ten Holdings (Based on Net Assets) *

* Excludes money market funds or other short-term securities held for the investment of cash and cash collateral for securities loaned, if any.
Sector Allocation (Based on Net Assets)

| Not FDIC Insured. Not Bank-Guaranteed. May Lose Value |
Top Ten Holdings (Based on Net Assets) *
* Excludes money market funds or other short-term securities held for the investment of cash and cash collateral for securities loaned, if any.
What were the Fund’s costs for the last year ?
(based on a hypothetical $10,000 investment)
| Share Class | Costs of a $10,000 investment | Costs paid as a percentage of a $10,000 investment |
| Class Y* | $83 | 0.78% |
| * |
During the period, fees were waived and/or expenses reimbursed pursuant to an agreement with the Fund’s investment adviser, BNY Mellon Investment Adviser, Inc. If this agreement is not extended in the future, expenses could be higher.
|
How did the Fund perform last year ?
-
For the 12-month period ended February 28, 2025, the Fund’s Class Y shares returned 13.01%.
-
In comparison, the Russell 1000® Growth Index returned 19.75% for the same period.
What affected the Fund’s performance?
-
U.S. equities were most impacted by rising inflation, which led to interest rates hikes by the Federal Reserve. Geopolitical tensions, particularly the conflict in Ukraine, fueled volatility and investor uncertainty.
-
The technology-related industries faced sell-offs due to concerns over valuations and future growth prospects.
-
The Fund benefited most from selections across the Information Technology and Communications Services sectors, especially among Artificial Intelligence-related and Internet-related companies, respectively.
-
The sectors that detracted most were Health care, Financials, and Consumer Staples. In Health care, our overweight allocation and stock selection both weighed on relative results. In Financials and Consumer Staples, stock selections were the primary hindrance.
Not FDIC Insured. Not Bank-Guaranteed. May Lose Value
How did the Fund perform over the past 10 years?
The Fund’s past performance is not a good predictor of the Fund’s future performance. The graph and table do not reflect the deduction of taxes that a shareholder would pay on fund distributions or redemption of fund shares.
Cumulative Performance from March 1 , 2015 through February 28, 2025
Initial Investment of $1,000,000
Initial Investment of $1,000,000
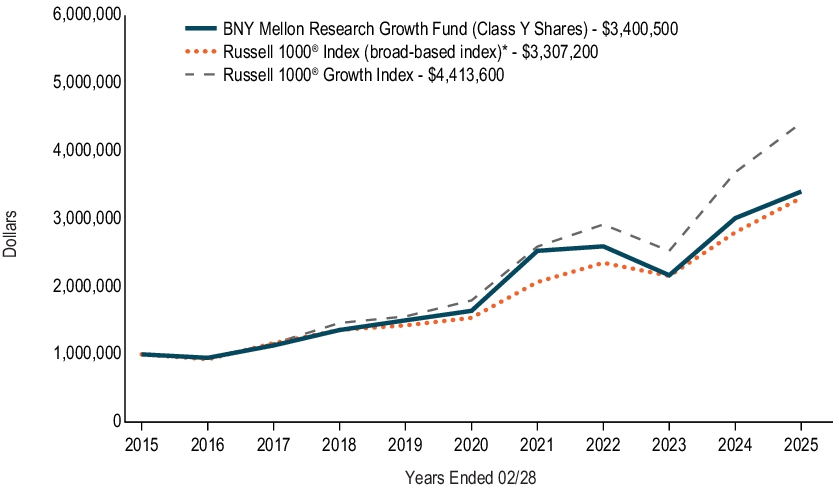
The above graph compares a hypothetical $1,000,000 investment in the Fund’s Class Y shares to a hypothetical investment of $1,000,000 made in each of the Russell 1000® Index (a broad-based index) and Russell 1000® Growth Index on 2/28/2015. The performance shown takes into account applicable fees and expenses of the Fund, including management fees and other expenses. The Fund’s performance also assumes the reinvestment of dividends and capital gains. Unlike the Fund, the indexes are not subject to charges, fees and other expenses. Investors cannot invest directly in any index.
AVERAGE ANNUAL TOTAL RETURNS (AS OF 2/28/25 )
| Share Class | 1YR | 5YR | 10YR | |||
| Class Y | 13.01% | 15.68% | 13.02% | |||
| Russell 1000® Index (broad-based index)* | 18.11% | 16.54% | 12.71% | |||
| Russell 1000® Growth Index | 19.75% | 19.71% | 16.01% |
|
*
|
In accordance with regulatory changes requiring the Fund’s primary benchmark to represent the overall applicable market, the Fund’s primary prospectus benchmark changed to the indicated benchmark effective as of February 28, 2025.
|
KEY FUND STATISTICS (AS OF 2/28/25 )
Fund Size (Millions) |
Number of Holdings |
Total Advisory Fee Paid During Period |
Annual Portfolio Turnover |
| $1,602 | 52 | $12,241,650 | 27.94% |
| Not FDIC Insured. Not Bank-Guaranteed. May Lose Value |
Portfolio Holdings (as of 2/28/25 )
Top Ten Holdings (Based on Net Assets) *

* Excludes money market funds or other short-term securities held for the investment of cash and cash collateral for securities loaned, if any.
Sector Allocation (Based on Net Assets)

| Not FDIC Insured. Not Bank-Guaranteed. May Lose Value |
Top Ten Holdings (Based on Net Assets) *
* Excludes money market funds or other short-term securities held for the investment of cash and cash collateral for securities loaned, if any.
What were the Fund’s costs for the last year ?
(based on a hypothetical $10,000 investment)
| Share Class | Costs of a $10,000 investment | Costs paid as a percentage of a $10,000 investment |
| Class Z* | $88 | 0.83% |
| * |
During the period, fees were waived and/or expenses reimbursed pursuant to an agreement with the Fund’s investment adviser, BNY Mellon Investment Adviser, Inc. If this agreement is not extended in the future, expenses could be higher.
|
How did the Fund perform last year ?
-
For the 12-month period ended February 28, 2025, the Fund’s Class Z shares returned 12.91%.
-
In comparison, the Russell 1000® Growth Index returned 19.75% for the same period.
What affected the Fund’s performance?
-
U.S. equities were most impacted by rising inflation, which led to interest rates hikes by the Federal Reserve. Geopolitical tensions, particularly the conflict in Ukraine, fueled volatility and investor uncertainty.
-
The technology-related industries faced sell-offs due to concerns over valuations and future growth prospects.
-
The Fund benefited most from selections across the Information Technology and Communications Services sectors, especially among Artificial Intelligence-related and Internet-related companies, respectively.
-
The sectors that detracted most were Health care, Financials, and Consumer Staples. In Health care, our overweight allocation and stock selection both weighed on relative results. In Financials and Consumer Staples, stock selections were the primary hindrance.
Not FDIC Insured. Not Bank-Guaranteed. May Lose Value
How did the Fund perform over the past 10 years?
The Fund’s past performance is not a good predictor of the Fund’s future performance. The graph and table do not reflect the deduction of taxes that a shareholder would pay on fund distributions or redemption of fund shares.
Cumulative Performance from March 1 , 2015 through February 28, 2025
Initial Investment of $10,000
Initial Investment of $10,000
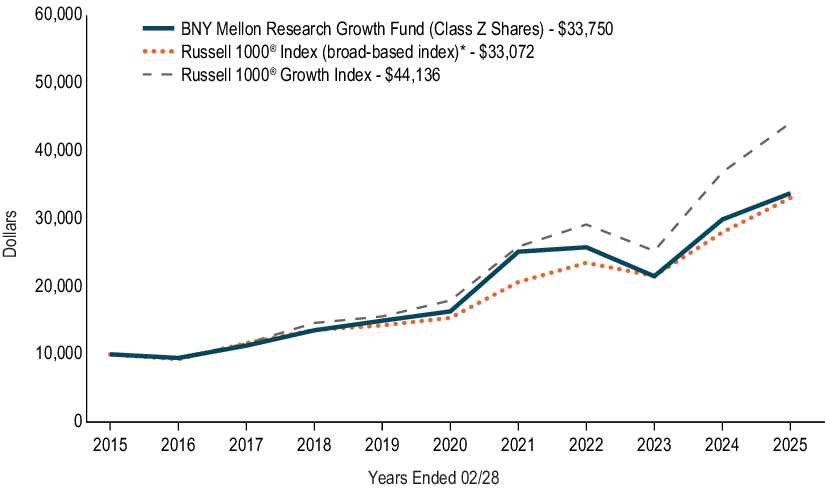
The above graph compares a hypothetical $10,000 investment in the Fund’s Class Z shares to a hypothetical investment of $10,000 made in each of the Russell 1000® Index (a broad-based index) and Russell 1000® Growth Index on 2/28/2015. The performance shown takes into account applicable fees and expenses of the Fund, including management fees and other expenses. The Fund’s performance also assumes the reinvestment of dividends and capital gains. Unlike the Fund, the indexes are not subject to charges, fees and other expenses. Investors cannot invest directly in any index.
AVERAGE ANNUAL TOTAL RETURNS (AS OF 2/28/25 )
| Share Class | 1YR | 5YR | 10YR | |||
| Class Z | 12.91% | 15.62% | 12.94% | |||
| Russell 1000® Index (broad-based index)* | 18.11% | 16.54% | 12.71% | |||
| Russell 1000® Growth Index | 19.75% | 19.71% | 16.01% |
|
*
|
In accordance with regulatory changes requiring the Fund’s primary benchmark to represent the overall applicable market, the Fund’s primary prospectus benchmark changed to the indicated benchmark effective as of February 28, 2025.
|
KEY FUND STATISTICS (AS OF 2/28/25 )
Fund Size (Millions) |
Number of Holdings |
Total Advisory Fee Paid During Period |
Annual Portfolio Turnover |
| $1,602 | 52 | $12,241,650 | 27.94% |
| Not FDIC Insured. Not Bank-Guaranteed. May Lose Value |
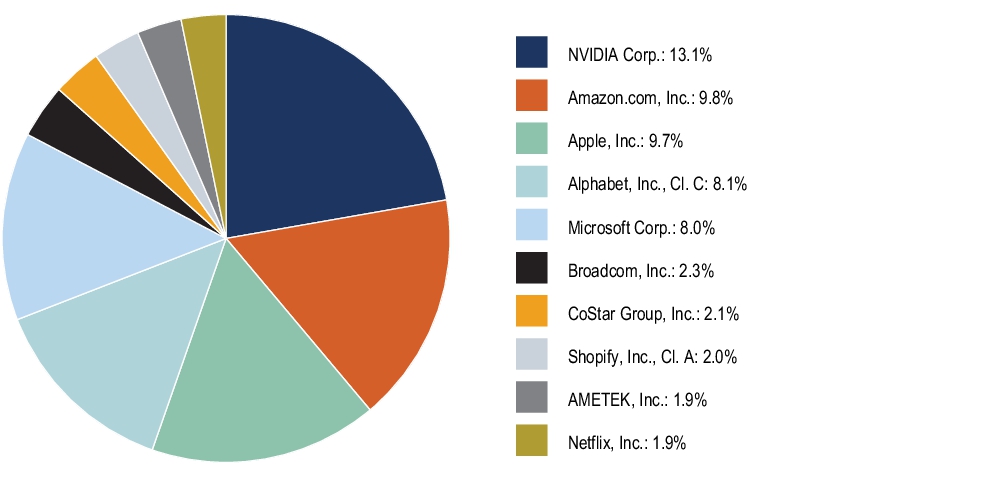
Portfolio Holdings (as of 2/28/25 )
Top Ten Holdings (Based on Net Assets) *
* Excludes money market funds or other short-term securities held for the investment of cash and cash collateral for securities loaned, if any.
Sector Allocation (Based on Net Assets)

| Not FDIC Insured. Not Bank-Guaranteed. May Lose Value |
Top Ten Holdings (Based on Net Assets) *
* Excludes money market funds or other short-term securities held for the investment of cash and cash collateral for securities loaned, if any.
| [1] | During the period, fees were waived and/or expenses reimbursed pursuant to an agreement with the Fund’s investment adviser, BNY Mellon Investment Adviser, Inc. If this agreement is not extended in the future, expenses could be higher. |
| [2] | During the period, fees were waived and/or expenses reimbursed pursuant to an agreement with the Fund’s investment adviser, BNY Mellon Investment Adviser, Inc. If this agreement is not extended in the future, expenses could be higher. |
| [3] | During the period, fees were waived and/or expenses reimbursed pursuant to an agreement with the Fund’s investment adviser, BNY Mellon Investment Adviser, Inc. If this agreement is not extended in the future, expenses could be higher. |
| [4] | During the period, fees were waived and/or expenses reimbursed pursuant to an agreement with the Fund’s investment adviser, BNY Mellon Investment Adviser, Inc. If this agreement is not extended in the future, expenses could be higher. |
| [5] | During the period, fees were waived and/or expenses reimbursed pursuant to an agreement with the Fund’s investment adviser, BNY Mellon Investment Adviser, Inc. If this agreement is not extended in the future, expenses could be higher. |