Pay vs Performance Disclosure
Dec. 31, 2024
USD ($)
Dec. 31, 2023
USD ($)
Dec. 31, 2022
USD ($)
Dec. 31, 2021
USD ($)
Dec. 31, 2020
USD ($)
Dec. 31, 2024
Dec. 16, 2022
Value of Initial Fixed $100 Investment Based on: | ||||||||||||||||||||
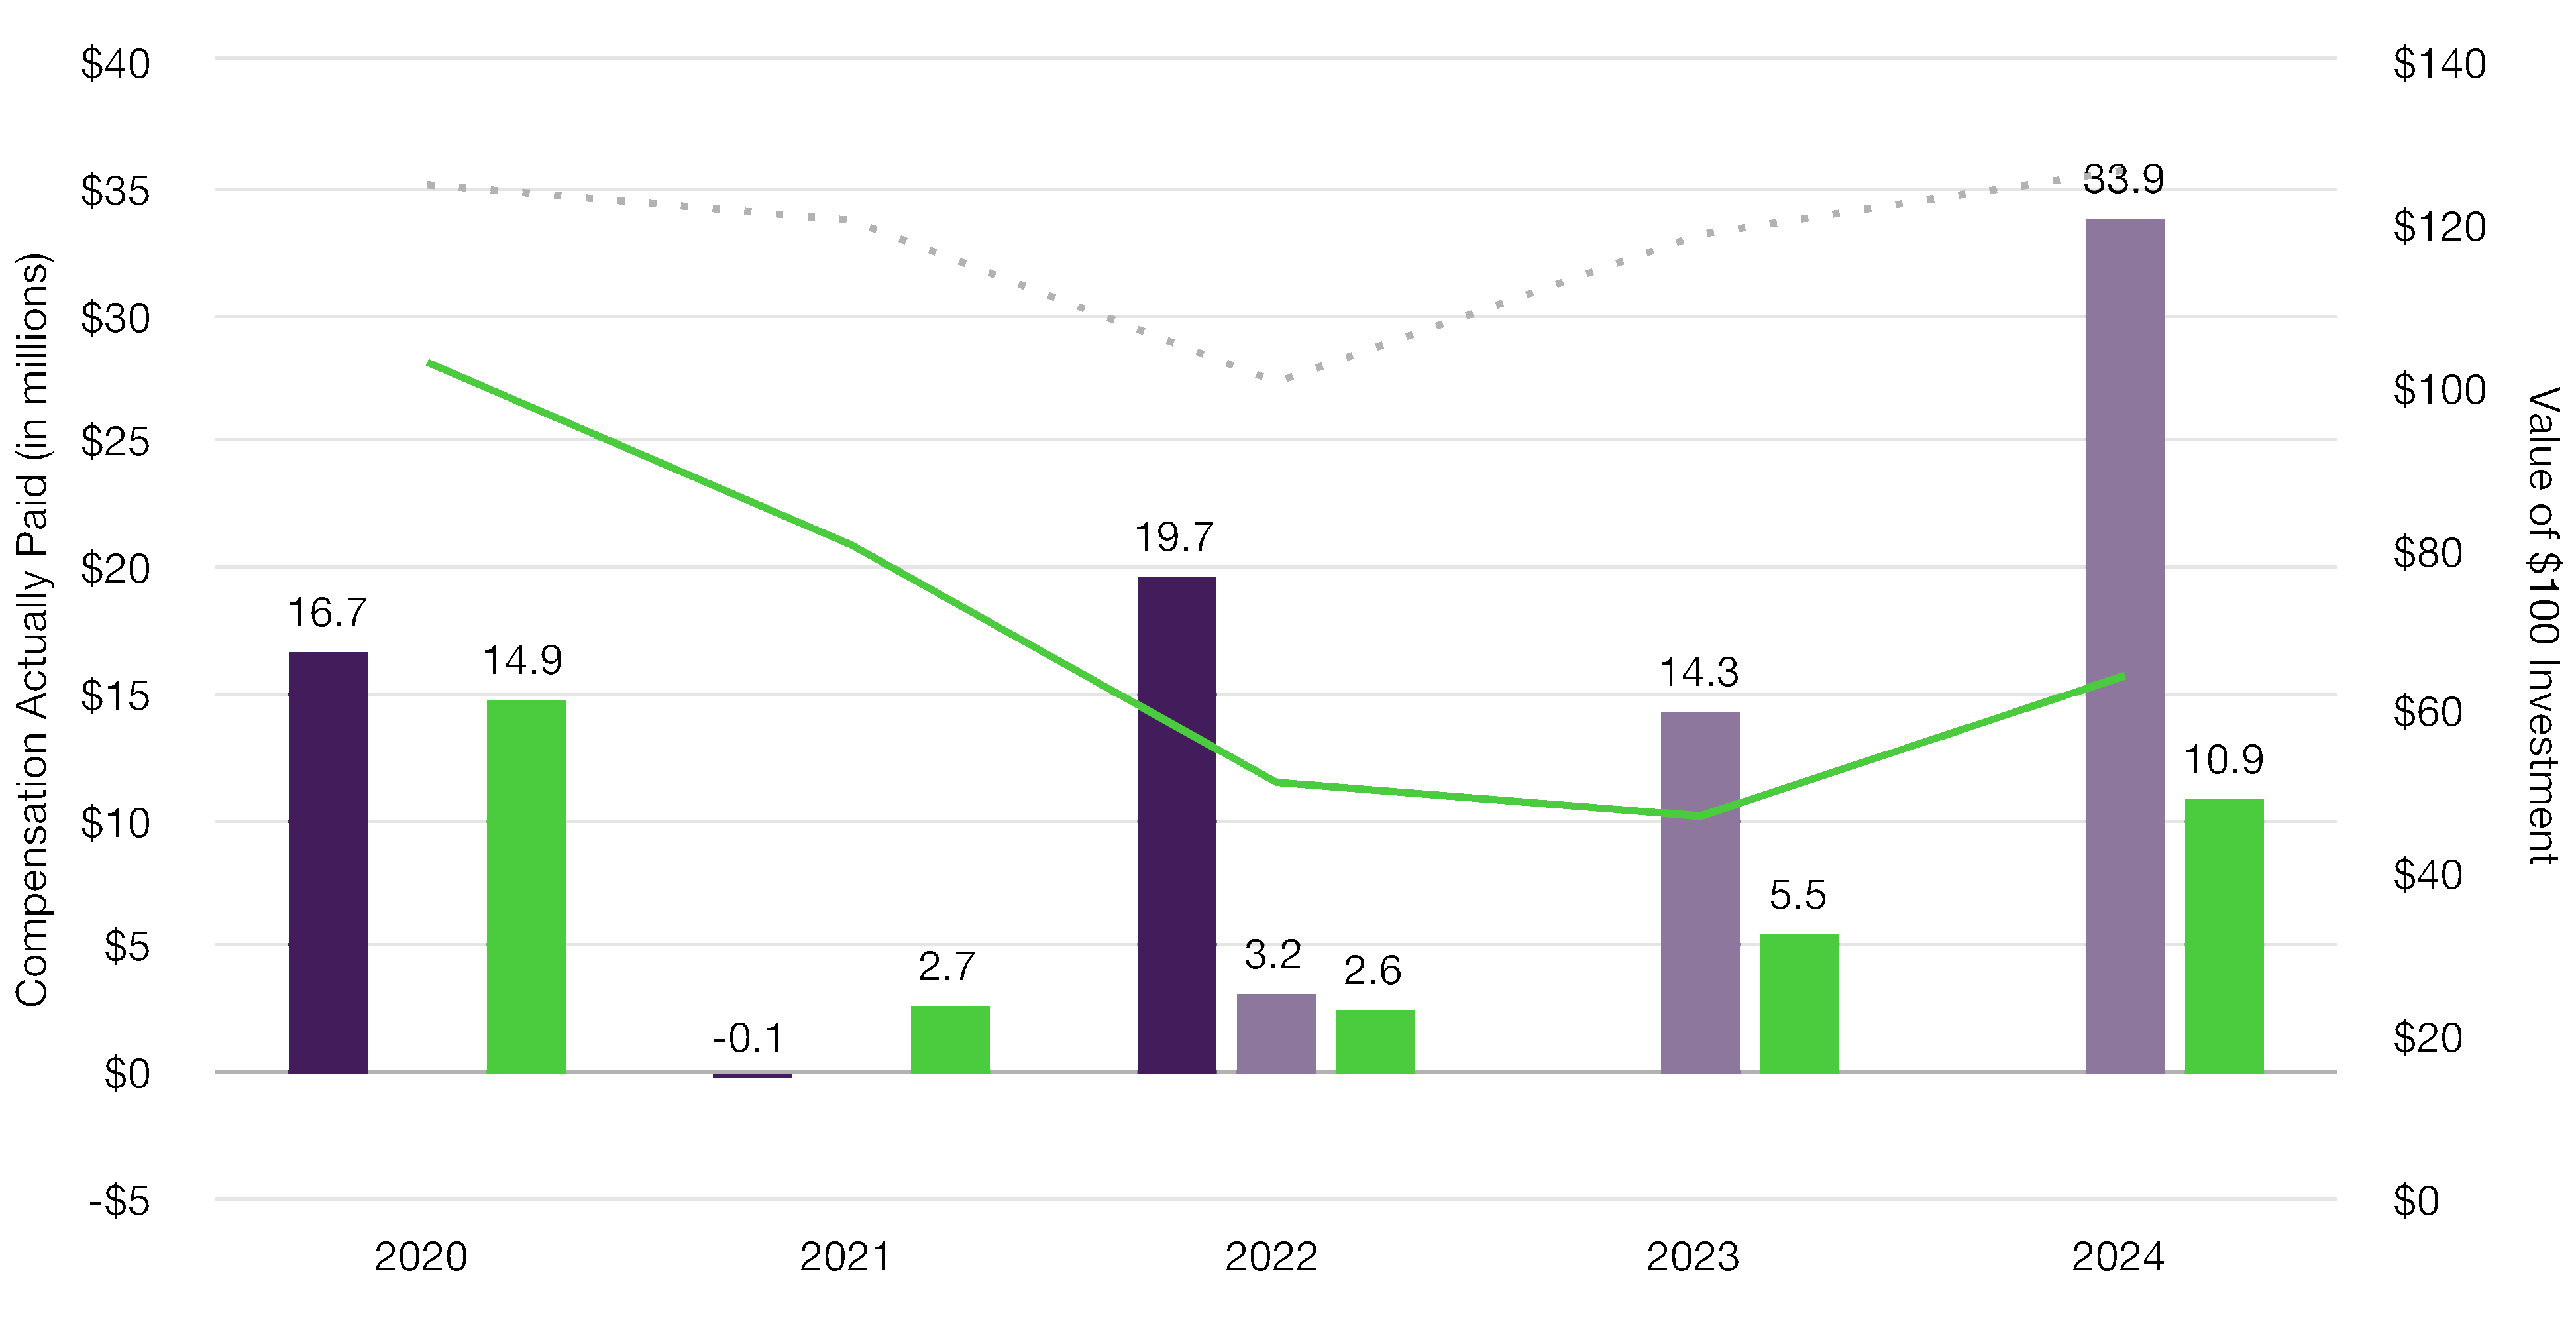
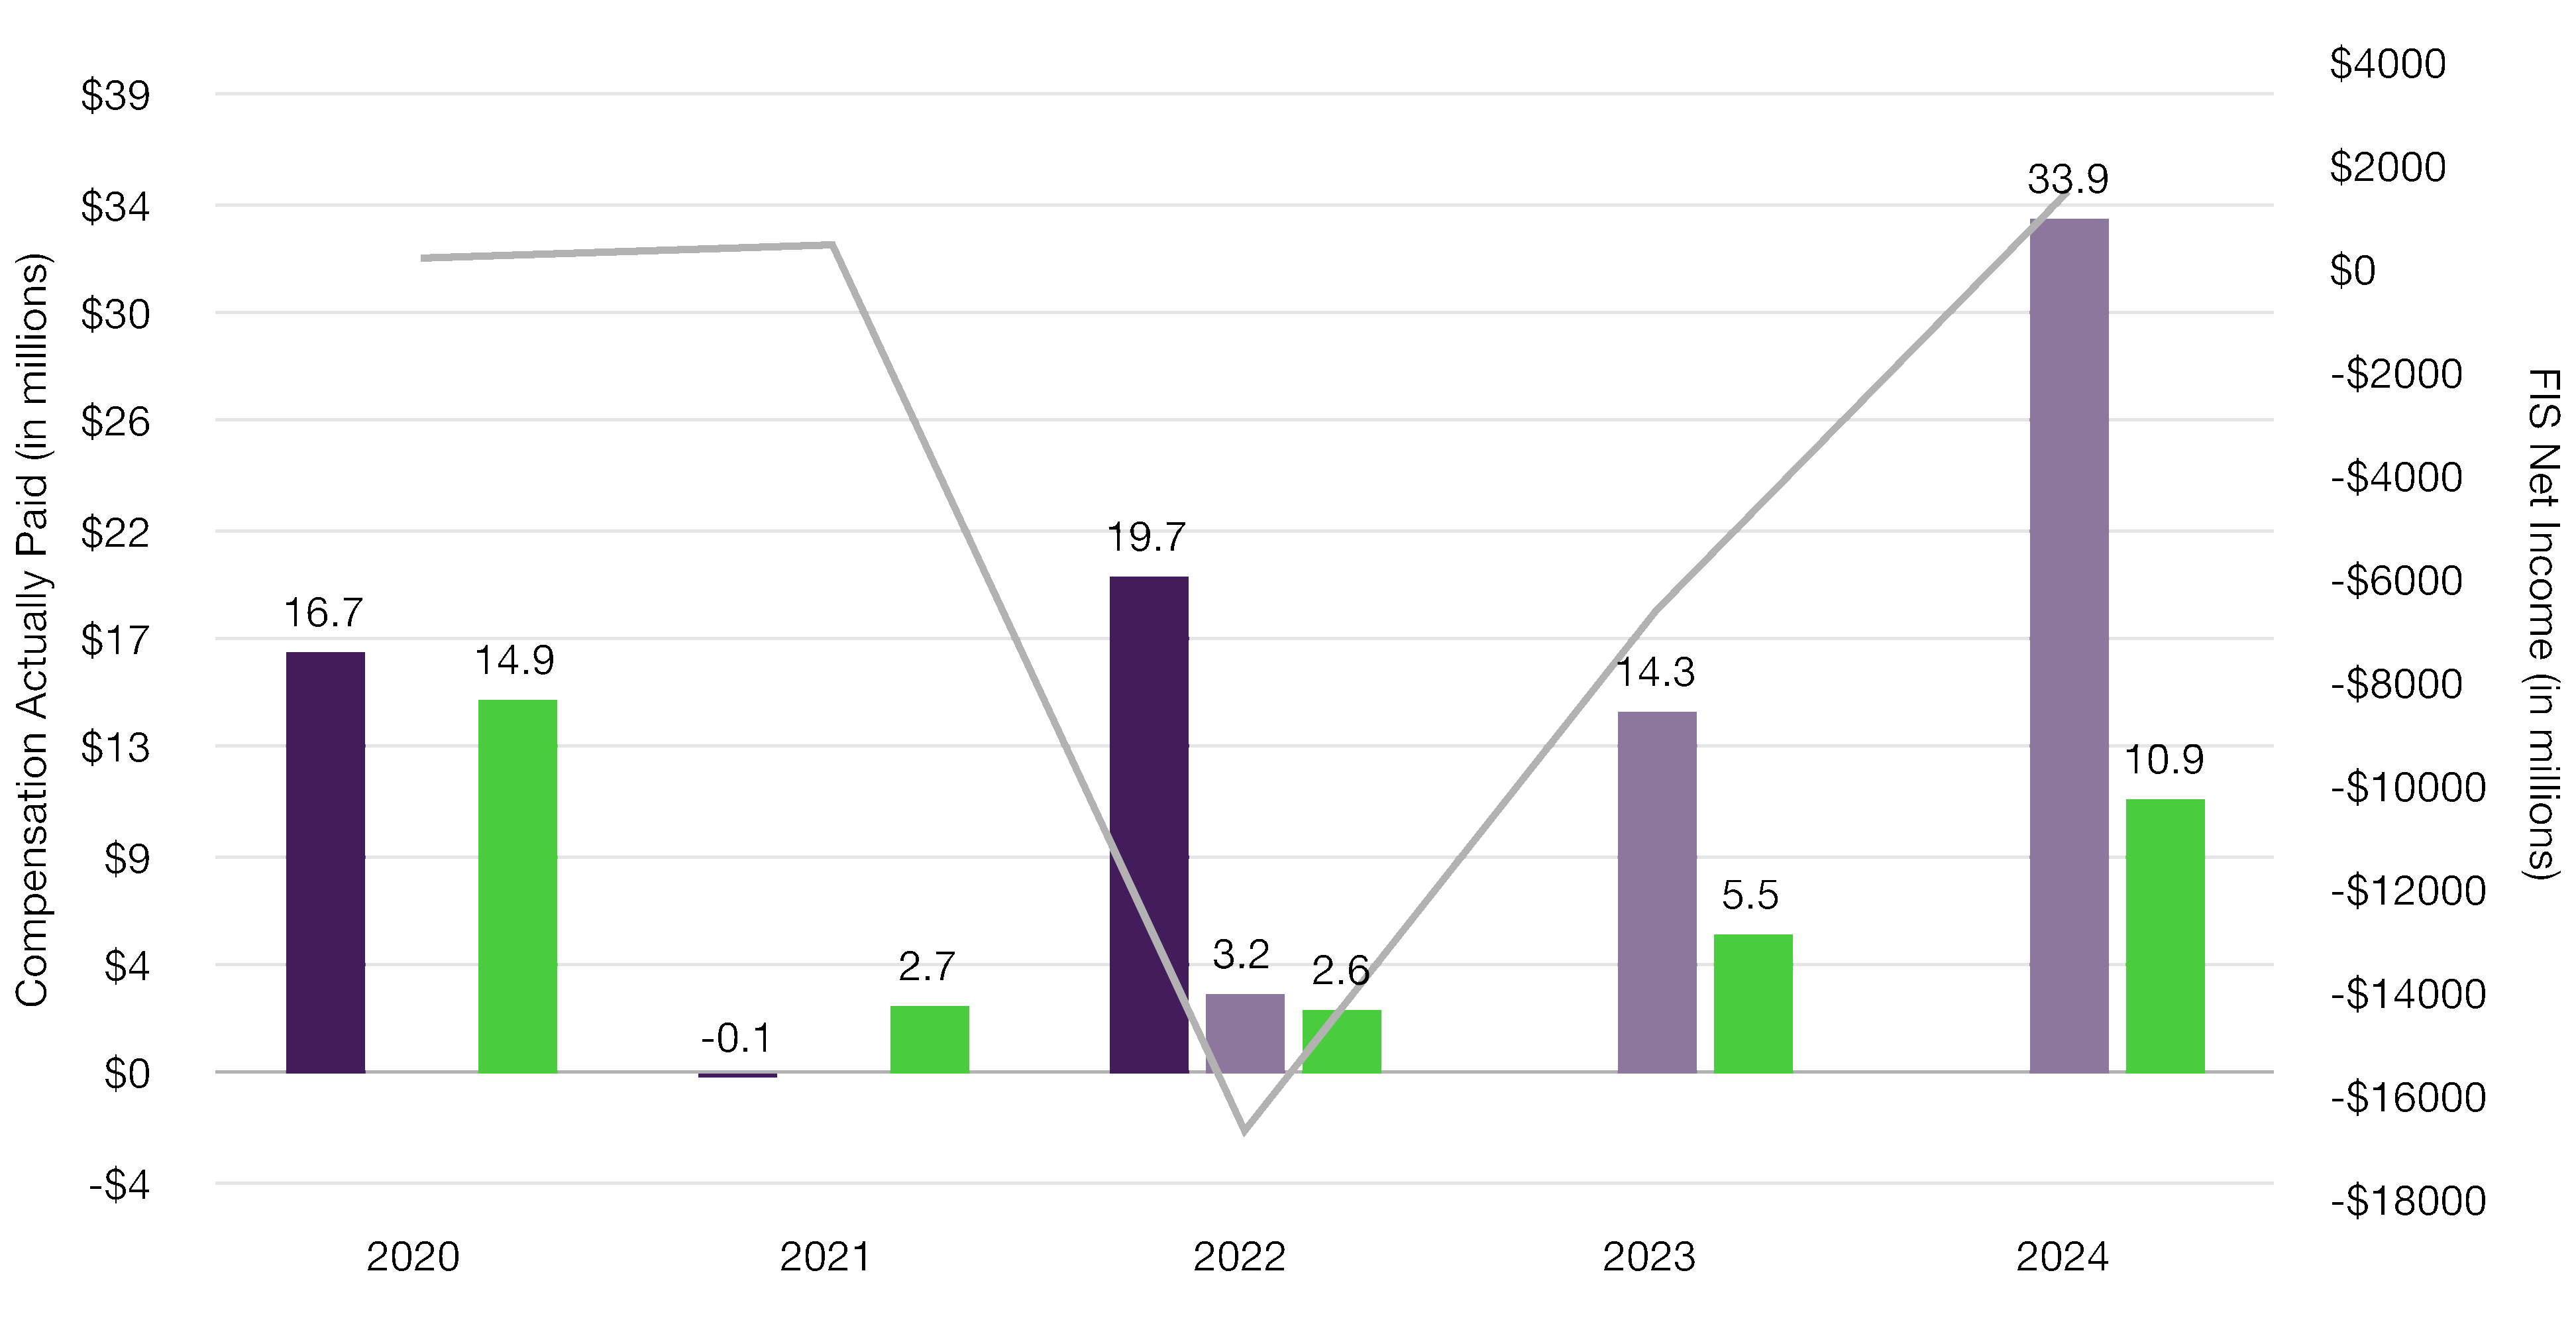
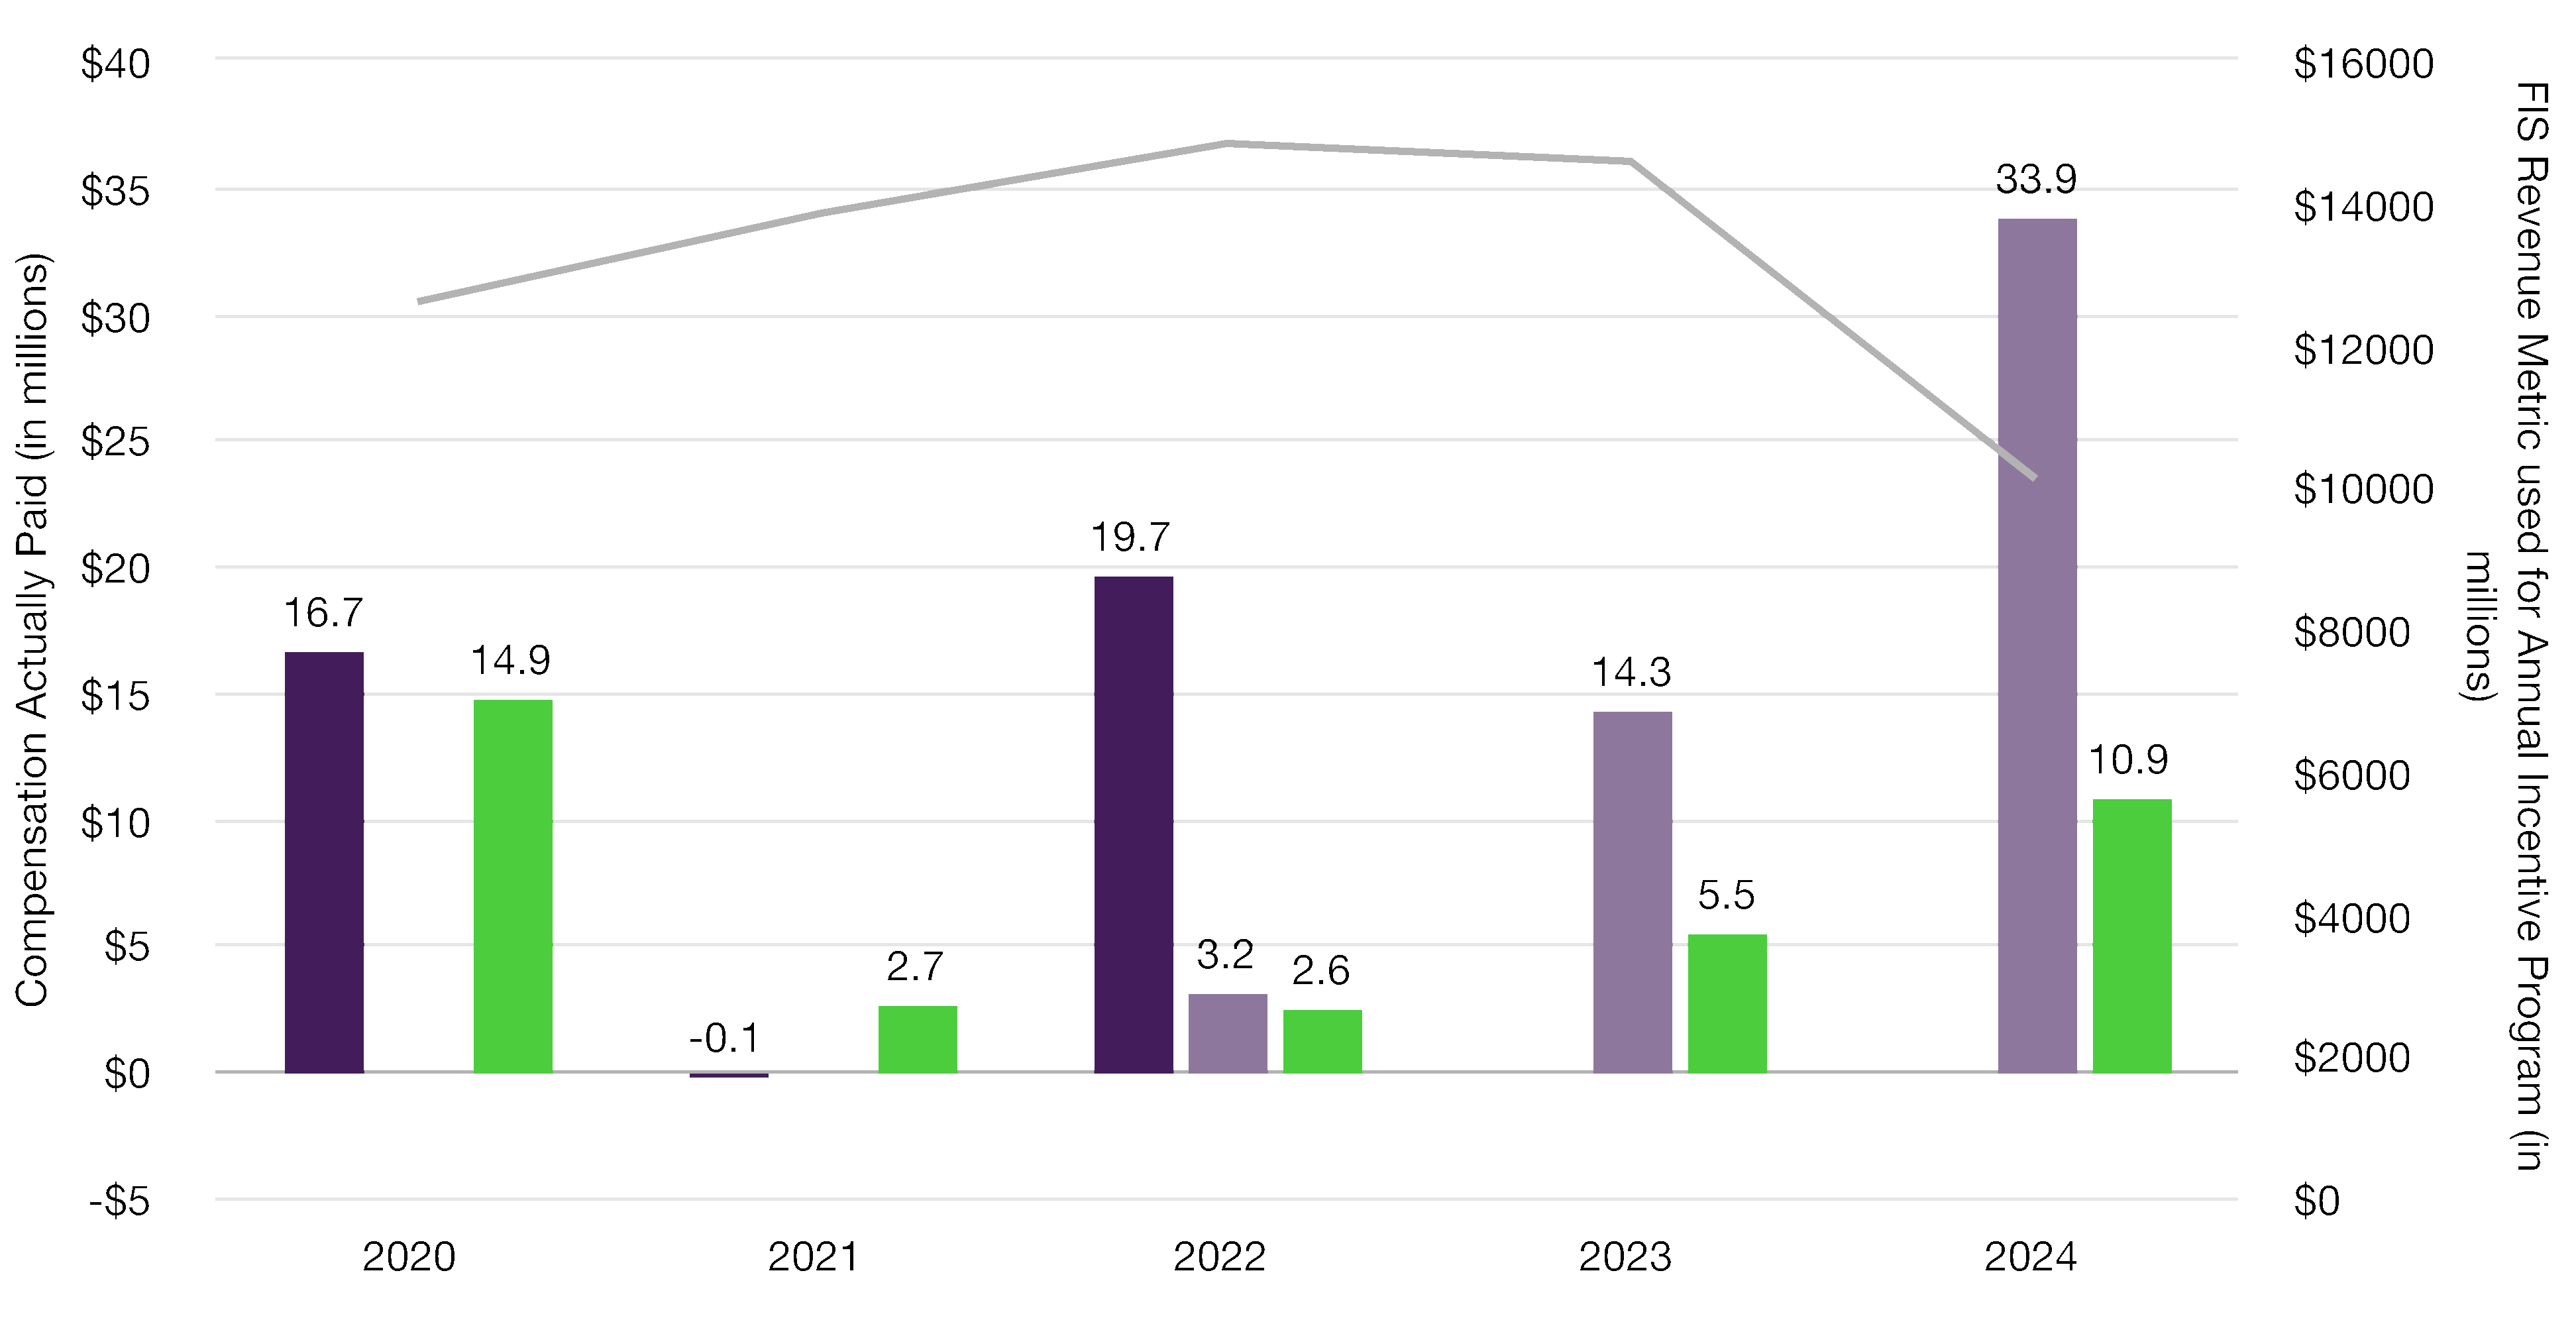
Year | Summary Compensation Table Total for PEO#1(b)(1) (1) | Summary Compensation Table Total for PEO#2(b)(2) (2) | Compensation Actually Paid to PEO#1(c)(1) (3) | Compensation Actually Paid to PEO#2(c)(2) (4) | Average Summary Compensation Table Total for Non-PEO NEOs (d) | Average Compensation Actually Paid to Non-PEO NEOs (e)(10) | Total Shareholder Return (f)(11) | Peer Group Total Shareholder Return(g) (12) | Net Income (in millions)(h) (13) | Revenue Metric Used for Annual Incentive Program (in millions) (i) (14) | ||||||||||
2024(5) | n/a | $21,243,485 | n/a | $33,854,155 | $7,134,815 | $10,873,143 | $64.14 | $126.45 | $1,450 | $10,101 | ||||||||||
2023(6) | n/a | $19,433,742 | n/a | $14,340,414 | $6,589,111 | $5,523,077 | $46.83 | $118.52 | $(6,655) | $14,581 | ||||||||||
2022(7) | $45,321,374 | $15,830,864 | $19,650,428 | $3,210,304 | $8,545,905 | $2,582,104 | $51.00 | $100.28 | $(16,752) | $14,817 | ||||||||||
2021(8) | $25,023,771 | n/a | $(110,502) | n/a | $10,257,289 | $2,697,249 | $80.26 | $120.19 | $417 | $13,843 | ||||||||||
2020(9) | $17,905,009 | n/a | $16,684,741 | n/a | $16,506,772 | $14,866,207 | $102.76 | $124.60 | $158 | $12,591 | ||||||||||
December 16, 2022.
2024 reflects the average compensation information for Mses. Tsai and Williams, Messrs. Kehoe and Bhathena.(6)2023 reflects the average compensation information for Mses. Tsai and Williams, Messrs. Gileadi, Hoag and Kehoe.
(7)2022 reflects the average compensation information for Mses. Tsai and Williams, Messrs. Gileadi, Hoag and Woodall.
(8)2021 reflects the average compensation information for Ms. Ferris, Messrs. Boyd, Lowthers, Ramji and Woodall.
(9)2020 reflects the average compensation information for Ms. Ferris, Messrs. Boyd, Heimbouch, Lowthers, Ramji, and Woodall.
above, adjusted as set forth in the table below as determined in accordance with the applicable SEC rules.
“Compensation Actually Paid” to Ms. Ferris in each of 2024, 2023 and 2022 reflects the respective amounts set forth in column (b)(2) of the table above, adjusted as set forth in the table below as determined in accordance with the applicable SEC rules.
Year | 2020 | 2021 | 2022 | 2022 | 2023 | 2024 |
PEO | Gary A. Norcross | Gary A. Norcross | Gary A. Norcross | Stephanie L. Ferris | Stephanie L. Ferris | Stephanie L. Ferris |
Summary Compensation Table (SCT) Total ($) | 17,905,009 | 25,023,771 | 45,321,374 | 15,830,864 | 19,433,742 | 21,243,485 |
Deduct: Amounts Reported under the “Stock Awards” Column in the SCT ($) | (12,385,502) | (14,339,482) | (30,599,876) | (12,922,017) | (9,005,347) | (17,571,281) |
Deduct: Amounts Reported under the “Option Awards” Column in the SCT ($) | (3,749,992) | (4,250,002) | – | (1,999,990) | (6,479,998) | – |
Increase: Fair Value of Awards Granted during the year that remain Outstanding and Unvested as of year-end ($) | 19,776,819 | 13,333,489 | – | 7,191,400 | 14,036,961 | 21,316,738 |
Increase: Fair Value of Awards Granted during the year that Vested during the year ($) | – | – | 14,537,377 | – | – | – |
Increase/deduct: Change in Fair Value from prior Year-end to current Year-end of Awards Granted Prior to year that were Outstanding and Unvested as of year-end ($)(a) | 1,083,491 | (13,943,099) | – | (3,327,604) | (2,282,258) | 7,224,427 |
Increase/deduct: Change in Fair Value from Prior Year-end to Vesting Date of Awards Granted Prior to year that Vested during year ($) | (5,609,821) | 439,855 | (9,231,661) | – | (55,507) | 1,640,786 |
Deduct: Fair Value of Awards Granted Prior to year that were Forfeited during year ($) | (335,263) | (6,375,034) | (376,786) | (1,562,349) | (1,307,179) | – |
Compensation Actually Paid ($) | 16,684,741 | (110,502) | 19,650,428 | 3,210,304 | 14,340,414 | 33,854,155 |
(a)The values for 2023 and 2022 have been updated from those presented in last year’s proxy statement to adjust for how the change in fair value of
awards is calculated to conform with SEC rules.
Categories with no values are excluded from the table above, which include: deduction for change in the actuarial present values, increase for
service cost for pension plans, increase for prior service cost for pension plans, increase based upon incremental fair value of awards modified
during year, and increase based on dividends or other earnings paid during year prior to the vesting date of an award. The fair value of the stock
options was determined using the Black-Scholes option pricing model. Adjustments have been made using stock option fair values as of each
measurement date using the stock price, term, volatility, dividend yield, and risk-free rate as of the measurement date. The fair value of
performance stock units with market condition was determined using the Monte Carlo model. The fair value of the performance stock units
without market condition was determined using the stock price at each measurement date and is based on (i) actual achievement of performance
conditions for performance period completed or (ii) probable outcome of performance conditions as of each measurement date for performance
periods not completed. For the fair value of time-vested restricted stock units, grant date fair values are based on stock price as of each
measurement date. The fair value calculation used herein is consistent with the fair value methodology used to account for share-based payments
in our financial statements.
set forth in column (d) of the table above, adjusted as set forth in the table below as determined in accordance with the applicable SEC rules.
Year Non-PEO NEO | 2020 Average | 2021 Average | 2022 Average | 2023 Average | 2024 Average |
(9) | (8) | (7) | (6) | (5) | |
SCT Total ($) | 16,506,772 | 10,257,289 | 8,545,905 | 6,589,111 | 7,134,815 |
Deduct: Amounts Reported under the “Stock Awards” Column in SCT Total ($) | (3,801,637) | (3,948,192) | (5,423,849) | (3,534,107) | (4,768,787) |
Deduct: Amounts Reported under the “Option Awards” Column in SCT Total ($) | (917,720) | (1,138,876) | (829,998) | (936,002) | – |
Increase: Fair Value of Awards Granted during the year that remain Outstanding and Unvested as of year-end ($) | 4,504,649 | 3,761,408 | 2,868,422 | 4,422,045 | 5,908,305 |
Increase: Fair Value of Awards Granted during the year that Vested during year ($) | 991,118 | – | 126,369 | – | – |
Increase/deduct: Change in Fair Value from prior Year-end to current Year-end of Awards Granted Prior to year that were Outstanding and Unvested as of year-end ($)(a) | 149,092 | (3,579,308) | (1,113,287) | (584,867) | 1,881,119 |
Increase/deduct: Change in Fair Value from Prior Year-end to Vesting Date of Awards Granted Prior to year that Vested during year ($) | 364,656 | (15,284) | (598,284) | (82,400) | 717,691 |
Deduct: Fair Value of Awards Granted Prior to year that were Forfeited during year ($) | (2,930,723) | (2,639,788) | (993,174) | (350,703) | – |
Compensation Actually Paid ($) | 14,866,207 | 2,697,249 | 2,582,104 | 5,523,077 | 10,873,143 |
(a)The values for 2023 and 2022 have been updated from those presented in last year’s proxy statement to adjust for how the change in fair value of
awards is calculated to conform with SEC rules.
Categories with no values are excluded from the table above, which include: deduction for change in the actuarial present values, increase for
service cost for pension plans, increase based upon incremental fair value of awards modified during year, and increase based on dividends or
other earnings paid during year prior to the vesting date of an award. The fair value of the stock options was determined using the Black-Scholes
option pricing model. Adjustments have been made using stock option fair values as of each measurement date using the stock price, term,
volatility, dividend yield, and risk-free rate as of the measurement date. The fair value of performance stock units with market condition was
determined using the Monte Carlo model. The fair value of the performance stock units without market condition was determined using stock
price at each measurement date and is based on (i) actual achievement of performance conditions for performance period completed or (ii)
probable outcome of performance conditions as of each measurement date for performance periods not completed. For the fair value of time-
vested restricted stock units, grant date fair values are based on stock price as of each measurement date. The fair value calculation used herein
is consistent with the fair value methodology used to account for share-based payments in our financial statements.
 | PEO #1 |  | PEO #2 |  | Avg. NEO |  | FIS TSR |  | Peer TSR |
| PEO #1 | | PEO #2 | | Avg. NEO |  | Net Income |
| PEO #1 | | PEO #2 | | Avg. NEO | | FIS Revenue Metric used for Annual Incentive Program |
| PEO #1 | | PEO #2 | | Avg. NEO | | FIS TSR | | Peer TSR |
Paid to the NEOs
The following is a list of financial performance measures, which in our assessment represent the most important financial
performance measures used by the Company to link compensation actually paid to the named executive officers
for 2024.
•Revenue metric used for annual cash incentive program
•EBITDA metric used for annual cash incentive program
•Annual Adjusted Revenue Growth
•Annual Adjusted EPS Growth
•Future Forward cash savings as calculated for 2024 annual cash incentive program
•Relative total shareholder return
December 31, 2019 and ending on December 31 of each year 2024, 2023, 2022, 2021 and 2020, respectively, assuming the value of the investment in
our common stock was $100.
(12)For the relevant fiscal year, represents the cumulative TSR of the S&P Supercap Data Processing & Outsourced Services Index (the same industry
index we use for purposes of the comparative total shareholder return graph in our Annual Report on Form 10-K for the year ended December 31,
2024) including reinvestment of dividends.
(13)Reflects “Net Income” in the Company's Consolidated Income Statements included in the Company’s Annual Reports on Form 10-K for each of the
years ended December 31, 2024, 2023, 2022, 2021 and 2020. Net Income for the years ended December 31, 2023 and 2022 have been revised to
correct immaterial misstatements identified during 2024. A summary of revisions to the previously reported financial statements is included in Note 24
to our consolidated financial statements for the fiscal year ended December 31, 2024, included in our Annual Report on the Form 10-K filed with the
SEC on February 13, 2025.
impact of foreign currency exchange rates. For years prior to 2024, the revenue metric is based on GAAP revenue as well as revenue from
discontinued operations, adjusted for the impact of foreign currency exchange rates. This metric is an important measure of the growth of the
Company, our ability to satisfy our customers and to gain new customers, and the effectiveness of our products and solutions. Revenue metric for
2023 and 2022 have been revised to correct immaterial misstatements identified during 2024. A summary of revisions to the previously reported
financial statements is included in Note 24 to our consolidated financial statements for the fiscal year ended December 31, 2024, included in our
Annual Report on the Form 10-K filed with the SEC on February 13, 2025.