Shareholder Report
Feb. 28, 2025
USD ($)
Holding
FUND EXPENSES
What were the fund costs for the last year?
| (based on a hypothetical $10,000 investment) | ||
| Class Name | Costs of a $10,000 investment | Costs paid as a percentage of a $10,000 investment |
| A | $79 | 0.77% |
MANAGEMENT'S DISCUSSION OF FUND PERFORMANCE
-
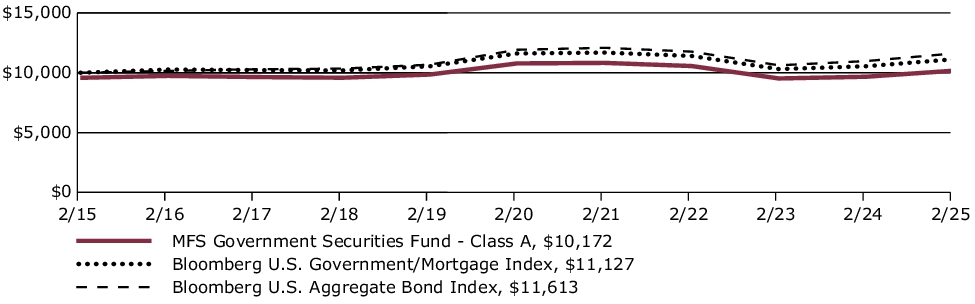
For the twelve months ended February 28, 2025, Class A shares of the MFS Government Securities Fund (fund) provided a total return of 5.23%, at net asset value. This compares with a return of 5.81% for the fund’s benchmark, the Bloomberg U.S. Aggregate Bond Index. The fund's other benchmark, the Bloomberg U.S. Government/Mortgage Index, generated a return of 5.53%.
-
Moderating inflation pressures allowed many global central banks to ease monetary policy during the period. However, the pace of disinflation slowed toward the end of the period, particularly in the US.
-
Geopolitical strains remained high amid ongoing conflicts in Ukraine and in the Middle East, while relations between China and the US remained tense, especially regarding trade. At the end of the period, China unveiled a sizable stimulus package aimed at shoring up its property sector and the finances of highly indebted local governments while the Trump administration threatened to impose considerable tariffs on its trading partners.
-
Global equity markets reached record levels late in the period as they withstood the adversity of the unsettled geopolitical climate and a higher interest rate environment but eased back from those highs as policy uncertainty rose. Healthy earnings growth continued though advances in artificial intelligence called into question, at least temporarily, the need for extraordinary levels of infrastructure investment to support the technology.
-
Global bond yields climbed off mid-period lows on the back of the US election results, resilient economic growth, concerns that global disinflationary progress may have stalled and a rising term premium. Reflecting increased inflation uncertainty, market expectations for future Federal Reserve interest rate cuts in 2025 were largely pared back while other major global central banks, notably the ECB, Bank of Canada and Bank of England, continued their gradual easing cycles. Already compressed credit spreads tightened further as corporate fundamentals remained sound. Bond market volatility, as measured by the Merrill Lynch Option Volatility Estimate (MOVE) index, declined in the fourth quarter after peaking before the US election, but climbed late February amongst heightened tariff uncertainty.
-
Top contributors to performance relative to the Bloomberg U.S. Government/Mortgage Index:
-
The fund's underweight exposure to the treasury sector, and out-of-benchmark exposure to both the Commercial Mortgage-Backed Security (CMBS) and Collateralized Loan Obligation (CLO) sectors, benefited relative performance.
-
-
Top detractors from performance relative to the Bloomberg U.S. Government/Mortgage Index:
-
Yield curve positioning weakened relative results.
-
FUND PERFORMANCE
The fund’s past performance is not a good predictor of the fund’s future performance. The graph and table below do not reflect the deduction of taxes that a shareholder would pay on fund distributions or the redemption of fund shares. The graph and table below assume reinvestment of dividends and capital gain distributions.
Growth of a Hypothetical $10,000 Investment
This graph shows the performance of a hypothetical $10,000 investment in Class A over a ten year period or since inception, if shorter, in comparison to (i) a broad measure of market performance and (ii) an additional index that MFS believes more closely reflects the market segments in which the fund invests. This graph includes the deduction of the maximum applicable sales charge.
Average Annual Total Returns through 2/28/25
This table shows the average annual total returns of the class of shares noted for the periods shown, both with (if any) and without sales charges. It also shows the average annual total returns of (i) a broad measure of market performance and (ii) an additional index that MFS believes more closely reflects the market segments in which the fund invests, over the same periods.
| Share Class | 1-yr | 5-yr | 10-yr |
| A without sales charge | 5.23% | (1.15)% | 0.61% |
| A with initial sales charge (4.25%) | 0.75% | (2.01)% | 0.17% |
| Comparative Benchmark(s) | |||
| Bloomberg U.S. Aggregate Bond Index +∆ | 5.81% | (0.52)% | 1.51% |
| Bloomberg U.S. Government/Mortgage Index +∆ | 5.53% | (0.85)% | 1.07% |
|
+ |
Effective May 1, 2024, the Bloomberg U.S. Aggregate Bond Index replaced the Bloomberg U.S. Government/Mortgage Index as a broad measure of market performance in accordance with new regulatory disclosure requirements. The fund continues to use the Bloomberg U.S. Government/Mortgage Index as an additional benchmark that MFS believes more closely reflects the market segments in which the fund invests. |
|
∆ |
Source: FactSet Research Systems Inc. |
Visit mfs.com/perf/a for more recent performance information.
FUND STATISTICS AS OF 2/28/25
| Net Assets ($): | 2,002,629,208 | Average Effective Maturity (yrs): | 6.5 | |
| Total Number of Holdings: | 822 | Average Effective Duration (yrs): | 6.3 | |
| Total Management Fee ($)#: | 7,481,801 | |||
| Portfolio Turnover Rate (%): | 195 |
# Includes the effect of any management fee waivers, if applicable.
Where the fund holds derivatives, they are not included in the total number of portfolio holdings.
PORTFOLIO COMPOSITION (BASED ON TOTAL INVESTMENTS AS OF 2/28/25)
Portfolio structure
| Fixed Income | 98.9% |
| Money Market Funds | 1.1% |
Composition including fixed income credit quality
| AAA | 7.2% |
| AA | 1.0% |
| A | 0.5% |
| BBB | 0.0% |
| U.S. Government | 25.2% |
| Federal Agencies | 65.0% |
| Money Market Funds | 1.1% |
Ratings are assigned using Moody’s, Fitch, and Standard & Poor’s and applying a hierarchy: If all 3 agencies rate a security, the middle rating is assigned; if 2 agencies rate a security, the lower rating is assigned. If none of the 3 agencies rate a security, we use DBRS Morningstar. If none of the 4 agencies rate a security, we use Kroll Bond Rating Agency. Ratings are shown in the S&P and Fitch scale (e.g., AAA). All ratings are subject to change.
Ratings are assigned using Moody’s, Fitch, and Standard & Poor’s and applying a hierarchy: If all 3 agencies rate a security, the middle rating is assigned; if 2 agencies rate a security, the lower rating is assigned. If none of the 3 agencies rate a security, we use DBRS Morningstar. If none of the 4 agencies rate a security, we use Kroll Bond Rating Agency. Ratings are shown in the S&P and Fitch scale (e.g., AAA). All ratings are subject to change.
FUND EXPENSES
What were the fund costs for the last year?
| (based on a hypothetical $10,000 investment) | ||
| Class Name | Costs of a $10,000 investment | Costs paid as a percentage of a $10,000 investment |
| B | $155 | 1.52% |
MANAGEMENT'S DISCUSSION OF FUND PERFORMANCE
-
For the twelve months ended February 28, 2025, Class B shares of the MFS Government Securities Fund (fund) provided a total return of 4.45%, at net asset value. This compares with a return of 5.81% for the fund’s benchmark, the Bloomberg U.S. Aggregate Bond Index. The fund's other benchmark, the Bloomberg U.S. Government/Mortgage Index, generated a return of 5.53%.
-
Moderating inflation pressures allowed many global central banks to ease monetary policy during the period. However, the pace of disinflation slowed toward the end of the period, particularly in the US.
-
Geopolitical strains remained high amid ongoing conflicts in Ukraine and in the Middle East, while relations between China and the US remained tense, especially regarding trade. At the end of the period, China unveiled a sizable stimulus package aimed at shoring up its property sector and the finances of highly indebted local governments while the Trump administration threatened to impose considerable tariffs on its trading partners.
-
Global equity markets reached record levels late in the period as they withstood the adversity of the unsettled geopolitical climate and a higher interest rate environment but eased back from those highs as policy uncertainty rose. Healthy earnings growth continued though advances in artificial intelligence called into question, at least temporarily, the need for extraordinary levels of infrastructure investment to support the technology.
-
Global bond yields climbed off mid-period lows on the back of the US election results, resilient economic growth, concerns that global disinflationary progress may have stalled and a rising term premium. Reflecting increased inflation uncertainty, market expectations for future Federal Reserve interest rate cuts in 2025 were largely pared back while other major global central banks, notably the ECB, Bank of Canada and Bank of England, continued their gradual easing cycles. Already compressed credit spreads tightened further as corporate fundamentals remained sound. Bond market volatility, as measured by the Merrill Lynch Option Volatility Estimate (MOVE) index, declined in the fourth quarter after peaking before the US election, but climbed late February amongst heightened tariff uncertainty.
-
Top contributors to performance relative to the Bloomberg U.S. Government/Mortgage Index:
-
The fund's underweight exposure to the treasury sector, and out-of-benchmark exposure to both the Commercial Mortgage-Backed Security (CMBS) and Collateralized Loan Obligation (CLO) sectors, benefited relative performance.
-
-
Top detractors from performance relative to the Bloomberg U.S. Government/Mortgage Index:
-
Yield curve positioning weakened relative results.
-
FUND PERFORMANCE
The fund’s past performance is not a good predictor of the fund’s future performance. The graph and table below do not reflect the deduction of taxes that a shareholder would pay on fund distributions or the redemption of fund shares. The graph and table below assume reinvestment of dividends and capital gain distributions.
Growth of a Hypothetical $10,000 Investment
This graph shows the performance of a hypothetical $10,000 investment in Class B over a ten year period or since inception, if shorter, in comparison to (i) a broad measure of market performance and (ii) an additional index that MFS believes more closely reflects the market segments in which the fund invests.

Average Annual Total Returns through 2/28/25
This table shows the average annual total returns of the class of shares noted for the periods shown, both with (if any) and without sales charges. It also shows the average annual total returns of (i) a broad measure of market performance and (ii) an additional index that MFS believes more closely reflects the market segments in which the fund invests, over the same periods.
| Share Class | 1-yr | 5-yr | 10-yr |
| B without sales charge | 4.45% | (1.90)% | (0.15)% |
| B with CDSC (declining over six years from 4% to 0%)× | 0.45% | (2.26)% | (0.15)% |
| Comparative Benchmark(s) | |||
| Bloomberg U.S. Aggregate Bond Index +∆ | 5.81% | (0.52)% | 1.51% |
| Bloomberg U.S. Government/Mortgage Index +∆ | 5.53% | (0.85)% | 1.07% |
|
+
|
Effective May 1, 2024, the Bloomberg U.S. Aggregate Bond Index replaced the Bloomberg U.S. Government/Mortgage Index as a broad measure of market performance in accordance with new regulatory disclosure requirements. The fund continues to use the Bloomberg U.S. Government/Mortgage Index as an additional benchmark that MFS believes more closely reflects the market segments in which the fund invests.
|
|
∆
|
Source: FactSet Research Systems Inc.
|
|
×
|
Assuming redemption at the end of the applicable period.
|
Visit mfs.com/perf/b for more recent performance information.
FUND STATISTICS AS OF 2/28/25
| Net Assets ($): | 2,002,629,208 | Average Effective Maturity (yrs): | 6.5 | |
| Total Number of Holdings: | 822 | Average Effective Duration (yrs): | 6.3 | |
| Total Management Fee ($)#: | 7,481,801 | |||
| Portfolio Turnover Rate (%): | 195 |
# Includes the effect of any management fee waivers, if applicable.
Where the fund holds derivatives, they are not included in the total number of portfolio holdings.
PORTFOLIO COMPOSITION (BASED ON TOTAL INVESTMENTS AS OF 2/28/25)
Portfolio structure
| Fixed Income | 98.9% |
| Money Market Funds | 1.1% |
Composition including fixed income credit quality
| AAA | 7.2% |
| AA | 1.0% |
| A | 0.5% |
| BBB | 0.0% |
| U.S. Government | 25.2% |
| Federal Agencies | 65.0% |
| Money Market Funds | 1.1% |
Ratings are assigned using Moody’s, Fitch, and Standard & Poor’s and applying a hierarchy: If all 3 agencies rate a security, the middle rating is assigned; if 2 agencies rate a security, the lower rating is assigned. If none of the 3 agencies rate a security, we use DBRS Morningstar. If none of the 4 agencies rate a security, we use Kroll Bond Rating Agency. Ratings are shown in the S&P and Fitch scale (e.g., AAA). All ratings are subject to change.
Ratings are assigned using Moody’s, Fitch, and Standard & Poor’s and applying a hierarchy: If all 3 agencies rate a security, the middle rating is assigned; if 2 agencies rate a security, the lower rating is assigned. If none of the 3 agencies rate a security, we use DBRS Morningstar. If none of the 4 agencies rate a security, we use Kroll Bond Rating Agency. Ratings are shown in the S&P and Fitch scale (e.g., AAA). All ratings are subject to change.
FUND EXPENSES
What were the fund costs for the last year?
| (based on a hypothetical $10,000 investment) | ||
| Class Name | Costs of a $10,000 investment | Costs paid as a percentage of a $10,000 investment |
| C | $155 | 1.52% |
MANAGEMENT'S DISCUSSION OF FUND PERFORMANCE
-
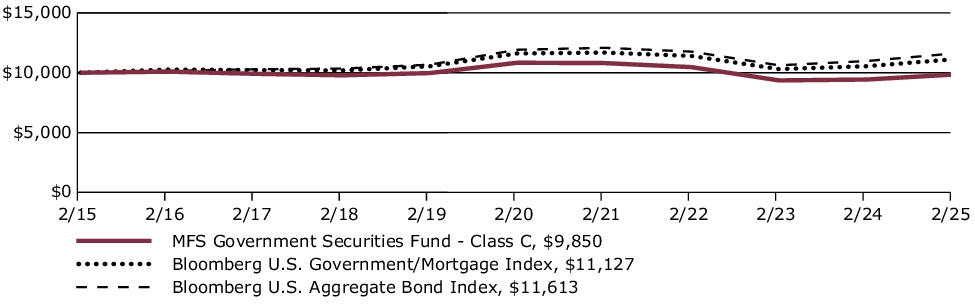
For the twelve months ended February 28, 2025, Class C shares of the MFS Government Securities Fund (fund) provided a total return of 4.44%, at net asset value. This compares with a return of 5.81% for the fund’s benchmark, the Bloomberg U.S. Aggregate Bond Index. The fund's other benchmark, the Bloomberg U.S. Government/Mortgage Index, generated a return of 5.53%.
-
Moderating inflation pressures allowed many global central banks to ease monetary policy during the period. However, the pace of disinflation slowed toward the end of the period, particularly in the US.
-
Geopolitical strains remained high amid ongoing conflicts in Ukraine and in the Middle East, while relations between China and the US remained tense, especially regarding trade. At the end of the period, China unveiled a sizable stimulus package aimed at shoring up its property sector and the finances of highly indebted local governments while the Trump administration threatened to impose considerable tariffs on its trading partners.
-
Global equity markets reached record levels late in the period as they withstood the adversity of the unsettled geopolitical climate and a higher interest rate environment but eased back from those highs as policy uncertainty rose. Healthy earnings growth continued though advances in artificial intelligence called into question, at least temporarily, the need for extraordinary levels of infrastructure investment to support the technology.
-
Global bond yields climbed off mid-period lows on the back of the US election results, resilient economic growth, concerns that global disinflationary progress may have stalled and a rising term premium. Reflecting increased inflation uncertainty, market expectations for future Federal Reserve interest rate cuts in 2025 were largely pared back while other major global central banks, notably the ECB, Bank of Canada and Bank of England, continued their gradual easing cycles. Already compressed credit spreads tightened further as corporate fundamentals remained sound. Bond market volatility, as measured by the Merrill Lynch Option Volatility Estimate (MOVE) index, declined in the fourth quarter after peaking before the US election, but climbed late February amongst heightened tariff uncertainty.
-
Top contributors to performance relative to the Bloomberg U.S. Government/Mortgage Index:
-
The fund's underweight exposure to the treasury sector, and out-of-benchmark exposure to both the Commercial Mortgage-Backed Security (CMBS) and Collateralized Loan Obligation (CLO) sectors, benefited relative performance.
-
-
Top detractors from performance relative to the Bloomberg U.S. Government/Mortgage Index:
-
Yield curve positioning weakened relative results.
-
FUND PERFORMANCE
The fund’s past performance is not a good predictor of the fund’s future performance. The graph and table below do not reflect the deduction of taxes that a shareholder would pay on fund distributions or the redemption of fund shares. The graph and table below assume reinvestment of dividends and capital gain distributions.
Growth of a Hypothetical $10,000 Investment
This graph shows the performance of a hypothetical $10,000 investment in Class C over a ten year period or since inception, if shorter, in comparison to (i) a broad measure of market performance and (ii) an additional index that MFS believes more closely reflects the market segments in which the fund invests.
Average Annual Total Returns through 2/28/25
This table shows the average annual total returns of the class of shares noted for the periods shown, both with (if any) and without sales charges. It also shows the average annual total returns of (i) a broad measure of market performance and (ii) an additional index that MFS believes more closely reflects the market segments in which the fund invests, over the same periods.
| Share Class | 1-yr | 5-yr | 10-yr |
| C without sales charge | 4.44% | (1.89)% | (0.15)% |
| C with CDSC (1% for 12 months)× | 3.44% | (1.89)% | (0.15)% |
| Comparative Benchmark(s) | |||
| Bloomberg U.S. Aggregate Bond Index +∆ | 5.81% | (0.52)% | 1.51% |
| Bloomberg U.S. Government/Mortgage Index +∆ | 5.53% | (0.85)% | 1.07% |
|
+
|
Effective May 1, 2024, the Bloomberg U.S. Aggregate Bond Index replaced the Bloomberg U.S. Government/Mortgage Index as a broad measure of market performance in accordance with new regulatory disclosure requirements. The fund continues to use the Bloomberg U.S. Government/Mortgage Index as an additional benchmark that MFS believes more closely reflects the market segments in which the fund invests.
|
|
∆
|
Source: FactSet Research Systems Inc.
|
|
×
|
Assuming redemption at the end of the applicable period.
|
Visit mfs.com/perf/c for more recent performance information.
FUND STATISTICS AS OF 2/28/25
| Net Assets ($): | 2,002,629,208 | Average Effective Maturity (yrs): | 6.5 | |
| Total Number of Holdings: | 822 | Average Effective Duration (yrs): | 6.3 | |
| Total Management Fee ($)#: | 7,481,801 | |||
| Portfolio Turnover Rate (%): | 195 |
# Includes the effect of any management fee waivers, if applicable.
Where the fund holds derivatives, they are not included in the total number of portfolio holdings.
PORTFOLIO COMPOSITION (BASED ON TOTAL INVESTMENTS AS OF 2/28/25)
Portfolio structure
| Fixed Income | 98.9% |
| Money Market Funds | 1.1% |
Composition including fixed income credit quality
| AAA | 7.2% |
| AA | 1.0% |
| A | 0.5% |
| BBB | 0.0% |
| U.S. Government | 25.2% |
| Federal Agencies | 65.0% |
| Money Market Funds | 1.1% |
Ratings are assigned using Moody’s, Fitch, and Standard & Poor’s and applying a hierarchy: If all 3 agencies rate a security, the middle rating is assigned; if 2 agencies rate a security, the lower rating is assigned. If none of the 3 agencies rate a security, we use DBRS Morningstar. If none of the 4 agencies rate a security, we use Kroll Bond Rating Agency. Ratings are shown in the S&P and Fitch scale (e.g., AAA). All ratings are subject to change.
Ratings are assigned using Moody’s, Fitch, and Standard & Poor’s and applying a hierarchy: If all 3 agencies rate a security, the middle rating is assigned; if 2 agencies rate a security, the lower rating is assigned. If none of the 3 agencies rate a security, we use DBRS Morningstar. If none of the 4 agencies rate a security, we use Kroll Bond Rating Agency. Ratings are shown in the S&P and Fitch scale (e.g., AAA). All ratings are subject to change.
FUND EXPENSES
What were the fund costs for the last year?
| (based on a hypothetical $10,000 investment) | ||
| Class Name | Costs of a $10,000 investment | Costs paid as a percentage of a $10,000 investment |
| I | $53 | 0.52% |
MANAGEMENT'S DISCUSSION OF FUND PERFORMANCE
-
For the twelve months ended February 28, 2025, Class I shares of the MFS Government Securities Fund (fund) provided a total return of 5.49%, at net asset value. This compares with a return of 5.81% for the fund’s benchmark, the Bloomberg U.S. Aggregate Bond Index. The fund's other benchmark, the Bloomberg U.S. Government/Mortgage Index, generated a return of 5.53%.
-
Moderating inflation pressures allowed many global central banks to ease monetary policy during the period. However, the pace of disinflation slowed toward the end of the period, particularly in the US.
-
Geopolitical strains remained high amid ongoing conflicts in Ukraine and in the Middle East, while relations between China and the US remained tense, especially regarding trade. At the end of the period, China unveiled a sizable stimulus package aimed at shoring up its property sector and the finances of highly indebted local governments while the Trump administration threatened to impose considerable tariffs on its trading partners.
-
Global equity markets reached record levels late in the period as they withstood the adversity of the unsettled geopolitical climate and a higher interest rate environment but eased back from those highs as policy uncertainty rose. Healthy earnings growth continued though advances in artificial intelligence called into question, at least temporarily, the need for extraordinary levels of infrastructure investment to support the technology.
-
Global bond yields climbed off mid-period lows on the back of the US election results, resilient economic growth, concerns that global disinflationary progress may have stalled and a rising term premium. Reflecting increased inflation uncertainty, market expectations for future Federal Reserve interest rate cuts in 2025 were largely pared back while other major global central banks, notably the ECB, Bank of Canada and Bank of England, continued their gradual easing cycles. Already compressed credit spreads tightened further as corporate fundamentals remained sound. Bond market volatility, as measured by the Merrill Lynch Option Volatility Estimate (MOVE) index, declined in the fourth quarter after peaking before the US election, but climbed late February amongst heightened tariff uncertainty.
-
Top contributors to performance relative to the Bloomberg U.S. Government/Mortgage Index:
-
The fund's underweight exposure to the treasury sector, and out-of-benchmark exposure to both the Commercial Mortgage-Backed Security (CMBS) and Collateralized Loan Obligation (CLO) sectors, benefited relative performance.
-
-
Top detractors from performance relative to the Bloomberg U.S. Government/Mortgage Index:
-
Yield curve positioning weakened relative results.
-
FUND PERFORMANCE
The fund’s past performance is not a good predictor of the fund’s future performance. The graph and table below do not reflect the deduction of taxes that a shareholder would pay on fund distributions or the redemption of fund shares. The graph and table below assume reinvestment of dividends and capital gain distributions.
Growth of a Hypothetical $10,000 Investment
This graph shows the performance of a hypothetical $10,000 investment in Class I over a ten year period or since inception, if shorter, in comparison to (i) a broad measure of market performance and (ii) an additional index that MFS believes more closely reflects the market segments in which the fund invests.

Average Annual Total Returns through 2/28/25
This table shows the average annual total returns of the class of shares noted for the periods shown, both with (if any) and without sales charges. It also shows the average annual total returns of (i) a broad measure of market performance and (ii) an additional index that MFS believes more closely reflects the market segments in which the fund invests, over the same periods.
| Share Class | 1-yr | 5-yr | 10-yr |
| I without sales charge | 5.49% | (0.93)% | 0.84% |
| Comparative Benchmark(s) | |||
| Bloomberg U.S. Aggregate Bond Index +∆ | 5.81% | (0.52)% | 1.51% |
| Bloomberg U.S. Government/Mortgage Index +∆ | 5.53% | (0.85)% | 1.07% |
|
+ |
Effective May 1, 2024, the Bloomberg U.S. Aggregate Bond Index replaced the Bloomberg U.S. Government/Mortgage Index as a broad measure of market performance in accordance with new regulatory disclosure requirements. The fund continues to use the Bloomberg U.S. Government/Mortgage Index as an additional benchmark that MFS believes more closely reflects the market segments in which the fund invests. |
|
∆ |
Source: FactSet Research Systems Inc. |
Visit mfs.com/perf/i for more recent performance information.
FUND STATISTICS AS OF 2/28/25
| Net Assets ($): | 2,002,629,208 | Average Effective Maturity (yrs): | 6.5 | |
| Total Number of Holdings: | 822 | Average Effective Duration (yrs): | 6.3 | |
| Total Management Fee ($)#: | 7,481,801 | |||
| Portfolio Turnover Rate (%): | 195 |
# Includes the effect of any management fee waivers, if applicable.
Where the fund holds derivatives, they are not included in the total number of portfolio holdings.
PORTFOLIO COMPOSITION (BASED ON TOTAL INVESTMENTS AS OF 2/28/25)
Portfolio structure
| Fixed Income | 98.9% |
| Money Market Funds | 1.1% |
Composition including fixed income credit quality
| AAA | 7.2% |
| AA | 1.0% |
| A | 0.5% |
| BBB | 0.0% |
| U.S. Government | 25.2% |
| Federal Agencies | 65.0% |
| Money Market Funds | 1.1% |
Ratings are assigned using Moody’s, Fitch, and Standard & Poor’s and applying a hierarchy: If all 3 agencies rate a security, the middle rating is assigned; if 2 agencies rate a security, the lower rating is assigned. If none of the 3 agencies rate a security, we use DBRS Morningstar. If none of the 4 agencies rate a security, we use Kroll Bond Rating Agency. Ratings are shown in the S&P and Fitch scale (e.g., AAA). All ratings are subject to change.
Ratings are assigned using Moody’s, Fitch, and Standard & Poor’s and applying a hierarchy: If all 3 agencies rate a security, the middle rating is assigned; if 2 agencies rate a security, the lower rating is assigned. If none of the 3 agencies rate a security, we use DBRS Morningstar. If none of the 4 agencies rate a security, we use Kroll Bond Rating Agency. Ratings are shown in the S&P and Fitch scale (e.g., AAA). All ratings are subject to change.
FUND EXPENSES
What were the fund costs for the last year?
| (based on a hypothetical $10,000 investment) | ||
| Class Name | Costs of a $10,000 investment | Costs paid as a percentage of a $10,000 investment |
| R1 | $155 | 1.52% |
MANAGEMENT'S DISCUSSION OF FUND PERFORMANCE
-
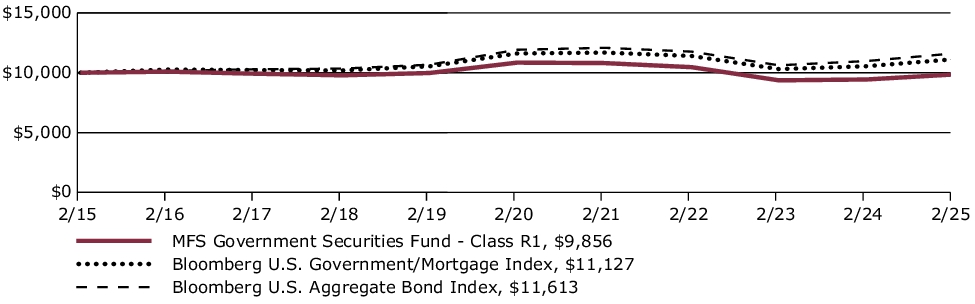
For the twelve months ended February 28, 2025, Class R1 shares of the MFS Government Securities Fund (fund) provided a total return of 4.45%, at net asset value. This compares with a return of 5.81% for the fund’s benchmark, the Bloomberg U.S. Aggregate Bond Index. The fund's other benchmark, the Bloomberg U.S. Government/Mortgage Index, generated a return of 5.53%.
-
Moderating inflation pressures allowed many global central banks to ease monetary policy during the period. However, the pace of disinflation slowed toward the end of the period, particularly in the US.
-
Geopolitical strains remained high amid ongoing conflicts in Ukraine and in the Middle East, while relations between China and the US remained tense, especially regarding trade. At the end of the period, China unveiled a sizable stimulus package aimed at shoring up its property sector and the finances of highly indebted local governments while the Trump administration threatened to impose considerable tariffs on its trading partners.
-
Global equity markets reached record levels late in the period as they withstood the adversity of the unsettled geopolitical climate and a higher interest rate environment but eased back from those highs as policy uncertainty rose. Healthy earnings growth continued though advances in artificial intelligence called into question, at least temporarily, the need for extraordinary levels of infrastructure investment to support the technology.
-
Global bond yields climbed off mid-period lows on the back of the US election results, resilient economic growth, concerns that global disinflationary progress may have stalled and a rising term premium. Reflecting increased inflation uncertainty, market expectations for future Federal Reserve interest rate cuts in 2025 were largely pared back while other major global central banks, notably the ECB, Bank of Canada and Bank of England, continued their gradual easing cycles. Already compressed credit spreads tightened further as corporate fundamentals remained sound. Bond market volatility, as measured by the Merrill Lynch Option Volatility Estimate (MOVE) index, declined in the fourth quarter after peaking before the US election, but climbed late February amongst heightened tariff uncertainty.
-
Top contributors to performance relative to the Bloomberg U.S. Government/Mortgage Index:
-
The fund's underweight exposure to the treasury sector, and out-of-benchmark exposure to both the Commercial Mortgage-Backed Security (CMBS) and Collateralized Loan Obligation (CLO) sectors, benefited relative performance.
-
-
Top detractors from performance relative to the Bloomberg U.S. Government/Mortgage Index:
-
Yield curve positioning weakened relative results.
-
FUND PERFORMANCE
The fund’s past performance is not a good predictor of the fund’s future performance. The graph and table below do not reflect the deduction of taxes that a shareholder would pay on fund distributions or the redemption of fund shares. The graph and table below assume reinvestment of dividends and capital gain distributions.
Growth of a Hypothetical $10,000 Investment
This graph shows the performance of a hypothetical $10,000 investment in Class R1 over a ten year period or since inception, if shorter, in comparison to (i) a broad measure of market performance and (ii) an additional index that MFS believes more closely reflects the market segments in which the fund invests.
Average Annual Total Returns through 2/28/25
This table shows the average annual total returns of the class of shares noted for the periods shown, both with (if any) and without sales charges. It also shows the average annual total returns of (i) a broad measure of market performance and (ii) an additional index that MFS believes more closely reflects the market segments in which the fund invests, over the same periods.
| Share Class | 1-yr | 5-yr | 10-yr |
| R1 without sales charge | 4.45% | (1.90)% | (0.15)% |
| Comparative Benchmark(s) | |||
| Bloomberg U.S. Aggregate Bond Index +∆ | 5.81% | (0.52)% | 1.51% |
| Bloomberg U.S. Government/Mortgage Index +∆ | 5.53% | (0.85)% | 1.07% |
|
+ |
Effective May 1, 2024, the Bloomberg U.S. Aggregate Bond Index replaced the Bloomberg U.S. Government/Mortgage Index as a broad measure of market performance in accordance with new regulatory disclosure requirements. The fund continues to use the Bloomberg U.S. Government/Mortgage Index as an additional benchmark that MFS believes more closely reflects the market segments in which the fund invests. |
|
∆ |
Source: FactSet Research Systems Inc. |
Visit mfs.com/perf/r1 for more recent performance information.
FUND STATISTICS AS OF 2/28/25
| Net Assets ($): | 2,002,629,208 | Average Effective Maturity (yrs): | 6.5 | |
| Total Number of Holdings: | 822 | Average Effective Duration (yrs): | 6.3 | |
| Total Management Fee ($)#: | 7,481,801 | |||
| Portfolio Turnover Rate (%): | 195 |
# Includes the effect of any management fee waivers, if applicable.
Where the fund holds derivatives, they are not included in the total number of portfolio holdings.
PORTFOLIO COMPOSITION (BASED ON TOTAL INVESTMENTS AS OF 2/28/25)
Portfolio structure
| Fixed Income | 98.9% |
| Money Market Funds | 1.1% |
Composition including fixed income credit quality
| AAA | 7.2% |
| AA | 1.0% |
| A | 0.5% |
| BBB | 0.0% |
| U.S. Government | 25.2% |
| Federal Agencies | 65.0% |
| Money Market Funds | 1.1% |
Ratings are assigned using Moody’s, Fitch, and Standard & Poor’s and applying a hierarchy: If all 3 agencies rate a security, the middle rating is assigned; if 2 agencies rate a security, the lower rating is assigned. If none of the 3 agencies rate a security, we use DBRS Morningstar. If none of the 4 agencies rate a security, we use Kroll Bond Rating Agency. Ratings are shown in the S&P and Fitch scale (e.g., AAA). All ratings are subject to change.
Ratings are assigned using Moody’s, Fitch, and Standard & Poor’s and applying a hierarchy: If all 3 agencies rate a security, the middle rating is assigned; if 2 agencies rate a security, the lower rating is assigned. If none of the 3 agencies rate a security, we use DBRS Morningstar. If none of the 4 agencies rate a security, we use Kroll Bond Rating Agency. Ratings are shown in the S&P and Fitch scale (e.g., AAA). All ratings are subject to change.
FUND EXPENSES
What were the fund costs for the last year?
| (based on a hypothetical $10,000 investment) | ||
| Class Name | Costs of a $10,000 investment | Costs paid as a percentage of a $10,000 investment |
| R2 | $105 | 1.02% |
MANAGEMENT'S DISCUSSION OF FUND PERFORMANCE
-
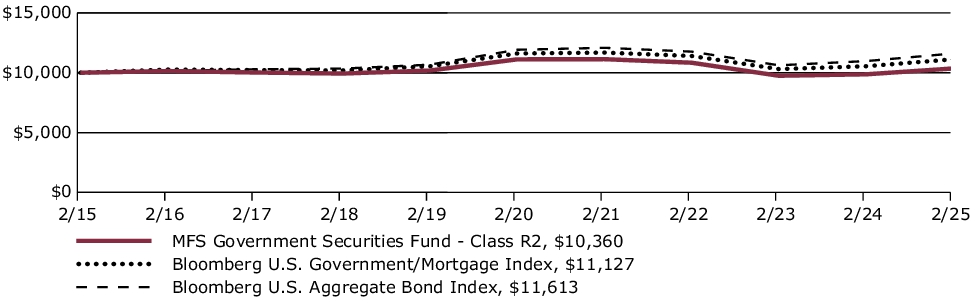
For the twelve months ended February 28, 2025, Class R2 shares of the MFS Government Securities Fund (fund) provided a total return of 4.97%, at net asset value. This compares with a return of 5.81% for the fund’s benchmark, the Bloomberg U.S. Aggregate Bond Index. The fund's other benchmark, the Bloomberg U.S. Government/Mortgage Index, generated a return of 5.53%.
-
Moderating inflation pressures allowed many global central banks to ease monetary policy during the period. However, the pace of disinflation slowed toward the end of the period, particularly in the US.
-
Geopolitical strains remained high amid ongoing conflicts in Ukraine and in the Middle East, while relations between China and the US remained tense, especially regarding trade. At the end of the period, China unveiled a sizable stimulus package aimed at shoring up its property sector and the finances of highly indebted local governments while the Trump administration threatened to impose considerable tariffs on its trading partners.
-
Global equity markets reached record levels late in the period as they withstood the adversity of the unsettled geopolitical climate and a higher interest rate environment but eased back from those highs as policy uncertainty rose. Healthy earnings growth continued though advances in artificial intelligence called into question, at least temporarily, the need for extraordinary levels of infrastructure investment to support the technology.
-
Global bond yields climbed off mid-period lows on the back of the US election results, resilient economic growth, concerns that global disinflationary progress may have stalled and a rising term premium. Reflecting increased inflation uncertainty, market expectations for future Federal Reserve interest rate cuts in 2025 were largely pared back while other major global central banks, notably the ECB, Bank of Canada and Bank of England, continued their gradual easing cycles. Already compressed credit spreads tightened further as corporate fundamentals remained sound. Bond market volatility, as measured by the Merrill Lynch Option Volatility Estimate (MOVE) index, declined in the fourth quarter after peaking before the US election, but climbed late February amongst heightened tariff uncertainty.
-
Top contributors to performance relative to the Bloomberg U.S. Government/Mortgage Index:
-
The fund's underweight exposure to the treasury sector, and out-of-benchmark exposure to both the Commercial Mortgage-Backed Security (CMBS) and Collateralized Loan Obligation (CLO) sectors, benefited relative performance.
-
-
Top detractors from performance relative to the Bloomberg U.S. Government/Mortgage Index:
-
Yield curve positioning weakened relative results.
-
FUND PERFORMANCE
The fund’s past performance is not a good predictor of the fund’s future performance. The graph and table below do not reflect the deduction of taxes that a shareholder would pay on fund distributions or the redemption of fund shares. The graph and table below assume reinvestment of dividends and capital gain distributions.
Growth of a Hypothetical $10,000 Investment
This graph shows the performance of a hypothetical $10,000 investment in Class R2 over a ten year period or since inception, if shorter, in comparison to (i) a broad measure of market performance and (ii) an additional index that MFS believes more closely reflects the market segments in which the fund invests.
Average Annual Total Returns through 2/28/25
This table shows the average annual total returns of the class of shares noted for the periods shown, both with (if any) and without sales charges. It also shows the average annual total returns of (i) a broad measure of market performance and (ii) an additional index that MFS believes more closely reflects the market segments in which the fund invests, over the same periods.
| Share Class | 1-yr | 5-yr | 10-yr |
| R2 without sales charge | 4.97% | (1.41)% | 0.35% |
| Comparative Benchmark(s) | |||
| Bloomberg U.S. Aggregate Bond Index +∆ | 5.81% | (0.52)% | 1.51% |
| Bloomberg U.S. Government/Mortgage Index +∆ | 5.53% | (0.85)% | 1.07% |
|
+ |
Effective May 1, 2024, the Bloomberg U.S. Aggregate Bond Index replaced the Bloomberg U.S. Government/Mortgage Index as a broad measure of market performance in accordance with new regulatory disclosure requirements. The fund continues to use the Bloomberg U.S. Government/Mortgage Index as an additional benchmark that MFS believes more closely reflects the market segments in which the fund invests. |
|
∆ |
Source: FactSet Research Systems Inc. |
Visit mfs.com/perf/r2 for more recent performance information.
FUND STATISTICS AS OF 2/28/25
| Net Assets ($): | 2,002,629,208 | Average Effective Maturity (yrs): | 6.5 | |
| Total Number of Holdings: | 822 | Average Effective Duration (yrs): | 6.3 | |
| Total Management Fee ($)#: | 7,481,801 | |||
| Portfolio Turnover Rate (%): | 195 |
# Includes the effect of any management fee waivers, if applicable.
Where the fund holds derivatives, they are not included in the total number of portfolio holdings.
PORTFOLIO COMPOSITION (BASED ON TOTAL INVESTMENTS AS OF 2/28/25)
Portfolio structure
| Fixed Income | 98.9% |
| Money Market Funds | 1.1% |
Composition including fixed income credit quality
| AAA | 7.2% |
| AA | 1.0% |
| A | 0.5% |
| BBB | 0.0% |
| U.S. Government | 25.2% |
| Federal Agencies | 65.0% |
| Money Market Funds | 1.1% |
Ratings are assigned using Moody’s, Fitch, and Standard & Poor’s and applying a hierarchy: If all 3 agencies rate a security, the middle rating is assigned; if 2 agencies rate a security, the lower rating is assigned. If none of the 3 agencies rate a security, we use DBRS Morningstar. If none of the 4 agencies rate a security, we use Kroll Bond Rating Agency. Ratings are shown in the S&P and Fitch scale (e.g., AAA). All ratings are subject to change.
Ratings are assigned using Moody’s, Fitch, and Standard & Poor’s and applying a hierarchy: If all 3 agencies rate a security, the middle rating is assigned; if 2 agencies rate a security, the lower rating is assigned. If none of the 3 agencies rate a security, we use DBRS Morningstar. If none of the 4 agencies rate a security, we use Kroll Bond Rating Agency. Ratings are shown in the S&P and Fitch scale (e.g., AAA). All ratings are subject to change.
FUND EXPENSES
What were the fund costs for the last year?
| (based on a hypothetical $10,000 investment) | ||
| Class Name | Costs of a $10,000 investment | Costs paid as a percentage of a $10,000 investment |
| R3 | $79 | 0.77% |
MANAGEMENT'S DISCUSSION OF FUND PERFORMANCE
-
For the twelve months ended February 28, 2025, Class R3 shares of the MFS Government Securities Fund (fund) provided a total return of 5.23%, at net asset value. This compares with a return of 5.81% for the fund’s benchmark, the Bloomberg U.S. Aggregate Bond Index. The fund's other benchmark, the Bloomberg U.S. Government/Mortgage Index, generated a return of 5.53%.
-
Moderating inflation pressures allowed many global central banks to ease monetary policy during the period. However, the pace of disinflation slowed toward the end of the period, particularly in the US.
-
Geopolitical strains remained high amid ongoing conflicts in Ukraine and in the Middle East, while relations between China and the US remained tense, especially regarding trade. At the end of the period, China unveiled a sizable stimulus package aimed at shoring up its property sector and the finances of highly indebted local governments while the Trump administration threatened to impose considerable tariffs on its trading partners.
-
Global equity markets reached record levels late in the period as they withstood the adversity of the unsettled geopolitical climate and a higher interest rate environment but eased back from those highs as policy uncertainty rose. Healthy earnings growth continued though advances in artificial intelligence called into question, at least temporarily, the need for extraordinary levels of infrastructure investment to support the technology.
-
Global bond yields climbed off mid-period lows on the back of the US election results, resilient economic growth, concerns that global disinflationary progress may have stalled and a rising term premium. Reflecting increased inflation uncertainty, market expectations for future Federal Reserve interest rate cuts in 2025 were largely pared back while other major global central banks, notably the ECB, Bank of Canada and Bank of England, continued their gradual easing cycles. Already compressed credit spreads tightened further as corporate fundamentals remained sound. Bond market volatility, as measured by the Merrill Lynch Option Volatility Estimate (MOVE) index, declined in the fourth quarter after peaking before the US election, but climbed late February amongst heightened tariff uncertainty.
-
Top contributors to performance relative to the Bloomberg U.S. Government/Mortgage Index:
-
The fund's underweight exposure to the treasury sector, and out-of-benchmark exposure to both the Commercial Mortgage-Backed Security (CMBS) and Collateralized Loan Obligation (CLO) sectors, benefited relative performance.
-
-
Top detractors from performance relative to the Bloomberg U.S. Government/Mortgage Index:
-
Yield curve positioning weakened relative results.
-
FUND PERFORMANCE
The fund’s past performance is not a good predictor of the fund’s future performance. The graph and table below do not reflect the deduction of taxes that a shareholder would pay on fund distributions or the redemption of fund shares. The graph and table below assume reinvestment of dividends and capital gain distributions.
Growth of a Hypothetical $10,000 Investment
This graph shows the performance of a hypothetical $10,000 investment in Class R3 over a ten year period or since inception, if shorter, in comparison to (i) a broad measure of market performance and (ii) an additional index that MFS believes more closely reflects the market segments in which the fund invests.

Average Annual Total Returns through 2/28/25
This table shows the average annual total returns of the class of shares noted for the periods shown, both with (if any) and without sales charges. It also shows the average annual total returns of (i) a broad measure of market performance and (ii) an additional index that MFS believes more closely reflects the market segments in which the fund invests, over the same periods.
| Share Class | 1-yr | 5-yr | 10-yr |
| R3 without sales charge | 5.23% | (1.16)% | 0.60% |
| Comparative Benchmark(s) | |||
| Bloomberg U.S. Aggregate Bond Index +∆ | 5.81% | (0.52)% | 1.51% |
| Bloomberg U.S. Government/Mortgage Index +∆ | 5.53% | (0.85)% | 1.07% |
|
+ |
Effective May 1, 2024, the Bloomberg U.S. Aggregate Bond Index replaced the Bloomberg U.S. Government/Mortgage Index as a broad measure of market performance in accordance with new regulatory disclosure requirements. The fund continues to use the Bloomberg U.S. Government/Mortgage Index as an additional benchmark that MFS believes more closely reflects the market segments in which the fund invests. |
|
∆ |
Source: FactSet Research Systems Inc. |
Visit mfs.com/perf/r3 for more recent performance information.
FUND STATISTICS AS OF 2/28/25
| Net Assets ($): | 2,002,629,208 | Average Effective Maturity (yrs): | 6.5 | |
| Total Number of Holdings: | 822 | Average Effective Duration (yrs): | 6.3 | |
| Total Management Fee ($)#: | 7,481,801 | |||
| Portfolio Turnover Rate (%): | 195 |
# Includes the effect of any management fee waivers, if applicable.
Where the fund holds derivatives, they are not included in the total number of portfolio holdings.
PORTFOLIO COMPOSITION (BASED ON TOTAL INVESTMENTS AS OF 2/28/25)
Portfolio structure
| Fixed Income | 98.9% |
| Money Market Funds | 1.1% |
Composition including fixed income credit quality
| AAA | 7.2% |
| AA | 1.0% |
| A | 0.5% |
| BBB | 0.0% |
| U.S. Government | 25.2% |
| Federal Agencies | 65.0% |
| Money Market Funds | 1.1% |
Ratings are assigned using Moody’s, Fitch, and Standard & Poor’s and applying a hierarchy: If all 3 agencies rate a security, the middle rating is assigned; if 2 agencies rate a security, the lower rating is assigned. If none of the 3 agencies rate a security, we use DBRS Morningstar. If none of the 4 agencies rate a security, we use Kroll Bond Rating Agency. Ratings are shown in the S&P and Fitch scale (e.g., AAA). All ratings are subject to change.
Ratings are assigned using Moody’s, Fitch, and Standard & Poor’s and applying a hierarchy: If all 3 agencies rate a security, the middle rating is assigned; if 2 agencies rate a security, the lower rating is assigned. If none of the 3 agencies rate a security, we use DBRS Morningstar. If none of the 4 agencies rate a security, we use Kroll Bond Rating Agency. Ratings are shown in the S&P and Fitch scale (e.g., AAA). All ratings are subject to change.
FUND EXPENSES
What were the fund costs for the last year?
| (based on a hypothetical $10,000 investment) | ||
| Class Name | Costs of a $10,000 investment | Costs paid as a percentage of a $10,000 investment |
| R4 | $53 | 0.52% |
MANAGEMENT'S DISCUSSION OF FUND PERFORMANCE
-
For the twelve months ended February 28, 2025, Class R4 shares of the MFS Government Securities Fund (fund) provided a total return of 5.49%, at net asset value. This compares with a return of 5.81% for the fund’s benchmark, the Bloomberg U.S. Aggregate Bond Index. The fund's other benchmark, the Bloomberg U.S. Government/Mortgage Index, generated a return of 5.53%.
-
Moderating inflation pressures allowed many global central banks to ease monetary policy during the period. However, the pace of disinflation slowed toward the end of the period, particularly in the US.
-
Geopolitical strains remained high amid ongoing conflicts in Ukraine and in the Middle East, while relations between China and the US remained tense, especially regarding trade. At the end of the period, China unveiled a sizable stimulus package aimed at shoring up its property sector and the finances of highly indebted local governments while the Trump administration threatened to impose considerable tariffs on its trading partners.
-
Global equity markets reached record levels late in the period as they withstood the adversity of the unsettled geopolitical climate and a higher interest rate environment but eased back from those highs as policy uncertainty rose. Healthy earnings growth continued though advances in artificial intelligence called into question, at least temporarily, the need for extraordinary levels of infrastructure investment to support the technology.
-
Global bond yields climbed off mid-period lows on the back of the US election results, resilient economic growth, concerns that global disinflationary progress may have stalled and a rising term premium. Reflecting increased inflation uncertainty, market expectations for future Federal Reserve interest rate cuts in 2025 were largely pared back while other major global central banks, notably the ECB, Bank of Canada and Bank of England, continued their gradual easing cycles. Already compressed credit spreads tightened further as corporate fundamentals remained sound. Bond market volatility, as measured by the Merrill Lynch Option Volatility Estimate (MOVE) index, declined in the fourth quarter after peaking before the US election, but climbed late February amongst heightened tariff uncertainty.
-
Top contributors to performance relative to the Bloomberg U.S. Government/Mortgage Index:
-
The fund's underweight exposure to the treasury sector, and out-of-benchmark exposure to both the Commercial Mortgage-Backed Security (CMBS) and Collateralized Loan Obligation (CLO) sectors, benefited relative performance.
-
-
Top detractors from performance relative to the Bloomberg U.S. Government/Mortgage Index:
-
Yield curve positioning weakened relative results.
-
FUND PERFORMANCE
The fund’s past performance is not a good predictor of the fund’s future performance. The graph and table below do not reflect the deduction of taxes that a shareholder would pay on fund distributions or the redemption of fund shares. The graph and table below assume reinvestment of dividends and capital gain distributions.
Growth of a Hypothetical $10,000 Investment
This graph shows the performance of a hypothetical $10,000 investment in Class R4 over a ten year period or since inception, if shorter, in comparison to (i) a broad measure of market performance and (ii) an additional index that MFS believes more closely reflects the market segments in which the fund invests.
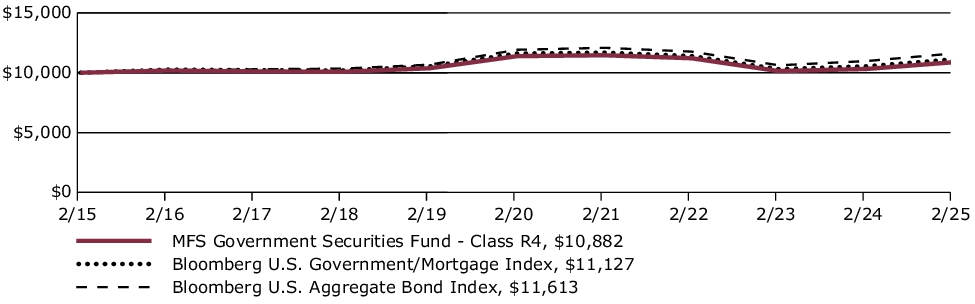
Average Annual Total Returns through 2/28/25
This table shows the average annual total returns of the class of shares noted for the periods shown, both with (if any) and without sales charges. It also shows the average annual total returns of (i) a broad measure of market performance and (ii) an additional index that MFS believes more closely reflects the market segments in which the fund invests, over the same periods.
| Share Class | 1-yr | 5-yr | 10-yr |
| R4 without sales charge | 5.49% | (0.91)% | 0.85% |
| Comparative Benchmark(s) | |||
| Bloomberg U.S. Aggregate Bond Index +∆ | 5.81% | (0.52)% | 1.51% |
| Bloomberg U.S. Government/Mortgage Index +∆ | 5.53% | (0.85)% | 1.07% |
|
+ |
Effective May 1, 2024, the Bloomberg U.S. Aggregate Bond Index replaced the Bloomberg U.S. Government/Mortgage Index as a broad measure of market performance in accordance with new regulatory disclosure requirements. The fund continues to use the Bloomberg U.S. Government/Mortgage Index as an additional benchmark that MFS believes more closely reflects the market segments in which the fund invests. |
|
∆ |
Source: FactSet Research Systems Inc. |
Visit mfs.com/perf/r4 for more recent performance information.
FUND STATISTICS AS OF 2/28/25
| Net Assets ($): | 2,002,629,208 | Average Effective Maturity (yrs): | 6.5 | |
| Total Number of Holdings: | 822 | Average Effective Duration (yrs): | 6.3 | |
| Total Management Fee ($)#: | 7,481,801 | |||
| Portfolio Turnover Rate (%): | 195 |
# Includes the effect of any management fee waivers, if applicable.
Where the fund holds derivatives, they are not included in the total number of portfolio holdings.
PORTFOLIO COMPOSITION (BASED ON TOTAL INVESTMENTS AS OF 2/28/25)
Portfolio structure
| Fixed Income | 98.9% |
| Money Market Funds | 1.1% |
Composition including fixed income credit quality
| AAA | 7.2% |
| AA | 1.0% |
| A | 0.5% |
| BBB | 0.0% |
| U.S. Government | 25.2% |
| Federal Agencies | 65.0% |
| Money Market Funds | 1.1% |
Ratings are assigned using Moody’s, Fitch, and Standard & Poor’s and applying a hierarchy: If all 3 agencies rate a security, the middle rating is assigned; if 2 agencies rate a security, the lower rating is assigned. If none of the 3 agencies rate a security, we use DBRS Morningstar. If none of the 4 agencies rate a security, we use Kroll Bond Rating Agency. Ratings are shown in the S&P and Fitch scale (e.g., AAA). All ratings are subject to change.
Ratings are assigned using Moody’s, Fitch, and Standard & Poor’s and applying a hierarchy: If all 3 agencies rate a security, the middle rating is assigned; if 2 agencies rate a security, the lower rating is assigned. If none of the 3 agencies rate a security, we use DBRS Morningstar. If none of the 4 agencies rate a security, we use Kroll Bond Rating Agency. Ratings are shown in the S&P and Fitch scale (e.g., AAA). All ratings are subject to change.
FUND EXPENSES
What were the fund costs for the last year?
| (based on a hypothetical $10,000 investment) | ||
| Class Name | Costs of a $10,000 investment | Costs paid as a percentage of a $10,000 investment |
| R6 | $43 | 0.42% |
MANAGEMENT'S DISCUSSION OF FUND PERFORMANCE
-
For the twelve months ended February 28, 2025, Class R6 shares of the MFS Government Securities Fund (fund) provided a total return of 5.59%, at net asset value. This compares with a return of 5.81% for the fund’s benchmark, the Bloomberg U.S. Aggregate Bond Index. The fund's other benchmark, the Bloomberg U.S. Government/Mortgage Index, generated a return of 5.53%.
-
Moderating inflation pressures allowed many global central banks to ease monetary policy during the period. However, the pace of disinflation slowed toward the end of the period, particularly in the US.
-
Geopolitical strains remained high amid ongoing conflicts in Ukraine and in the Middle East, while relations between China and the US remained tense, especially regarding trade. At the end of the period, China unveiled a sizable stimulus package aimed at shoring up its property sector and the finances of highly indebted local governments while the Trump administration threatened to impose considerable tariffs on its trading partners.
-
Global equity markets reached record levels late in the period as they withstood the adversity of the unsettled geopolitical climate and a higher interest rate environment but eased back from those highs as policy uncertainty rose. Healthy earnings growth continued though advances in artificial intelligence called into question, at least temporarily, the need for extraordinary levels of infrastructure investment to support the technology.
-
Global bond yields climbed off mid-period lows on the back of the US election results, resilient economic growth, concerns that global disinflationary progress may have stalled and a rising term premium. Reflecting increased inflation uncertainty, market expectations for future Federal Reserve interest rate cuts in 2025 were largely pared back while other major global central banks, notably the ECB, Bank of Canada and Bank of England, continued their gradual easing cycles. Already compressed credit spreads tightened further as corporate fundamentals remained sound. Bond market volatility, as measured by the Merrill Lynch Option Volatility Estimate (MOVE) index, declined in the fourth quarter after peaking before the US election, but climbed late February amongst heightened tariff uncertainty.
-
Top contributors to performance relative to the Bloomberg U.S. Government/Mortgage Index:
-
The fund's underweight exposure to the treasury sector, and out-of-benchmark exposure to both the Commercial Mortgage-Backed Security (CMBS) and Collateralized Loan Obligation (CLO) sectors, benefited relative performance.
-
-
Top detractors from performance relative to the Bloomberg U.S. Government/Mortgage Index:
-
Yield curve positioning weakened relative results.
-
FUND PERFORMANCE
The fund’s past performance is not a good predictor of the fund’s future performance. The graph and table below do not reflect the deduction of taxes that a shareholder would pay on fund distributions or the redemption of fund shares. The graph and table below assume reinvestment of dividends and capital gain distributions.
Growth of a Hypothetical $10,000 Investment
This graph shows the performance of a hypothetical $10,000 investment in Class R6 over a ten year period or since inception, if shorter, in comparison to (i) a broad measure of market performance and (ii) an additional index that MFS believes more closely reflects the market segments in which the fund invests.
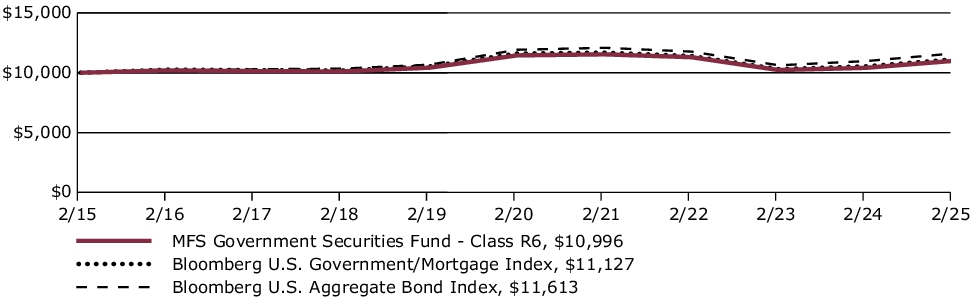
Average Annual Total Returns through 2/28/25
This table shows the average annual total returns of the class of shares noted for the periods shown, both with (if any) and without sales charges. It also shows the average annual total returns of (i) a broad measure of market performance and (ii) an additional index that MFS believes more closely reflects the market segments in which the fund invests, over the same periods.
| Share Class | 1-yr | 5-yr | 10-yr |
| R6 without sales charge | 5.59% | (0.81)% | 0.95% |
| Comparative Benchmark(s) | |||
| Bloomberg U.S. Aggregate Bond Index +∆ | 5.81% | (0.52)% | 1.51% |
| Bloomberg U.S. Government/Mortgage Index +∆ | 5.53% | (0.85)% | 1.07% |
|
+ |
Effective May 1, 2024, the Bloomberg U.S. Aggregate Bond Index replaced the Bloomberg U.S. Government/Mortgage Index as a broad measure of market performance in accordance with new regulatory disclosure requirements. The fund continues to use the Bloomberg U.S. Government/Mortgage Index as an additional benchmark that MFS believes more closely reflects the market segments in which the fund invests. |
|
∆ |
Source: FactSet Research Systems Inc. |
Visit mfs.com/perf/r6 for more recent performance information.
FUND STATISTICS AS OF 2/28/25
| Net Assets ($): | 2,002,629,208 | Average Effective Maturity (yrs): | 6.5 | |
| Total Number of Holdings: | 822 | Average Effective Duration (yrs): | 6.3 | |
| Total Management Fee ($)#: | 7,481,801 | |||
| Portfolio Turnover Rate (%): | 195 |
# Includes the effect of any management fee waivers, if applicable.
Where the fund holds derivatives, they are not included in the total number of portfolio holdings.
PORTFOLIO COMPOSITION (BASED ON TOTAL INVESTMENTS AS OF 2/28/25)
Portfolio structure
| Fixed Income | 98.9% |
| Money Market Funds | 1.1% |
Composition including fixed income credit quality
| AAA | 7.2% |
| AA | 1.0% |
| A | 0.5% |
| BBB | 0.0% |
| U.S. Government | 25.2% |
| Federal Agencies | 65.0% |
| Money Market Funds | 1.1% |
Ratings are assigned using Moody’s, Fitch, and Standard & Poor’s and applying a hierarchy: If all 3 agencies rate a security, the middle rating is assigned; if 2 agencies rate a security, the lower rating is assigned. If none of the 3 agencies rate a security, we use DBRS Morningstar. If none of the 4 agencies rate a security, we use Kroll Bond Rating Agency. Ratings are shown in the S&P and Fitch scale (e.g., AAA). All ratings are subject to change.
Ratings are assigned using Moody’s, Fitch, and Standard & Poor’s and applying a hierarchy: If all 3 agencies rate a security, the middle rating is assigned; if 2 agencies rate a security, the lower rating is assigned. If none of the 3 agencies rate a security, we use DBRS Morningstar. If none of the 4 agencies rate a security, we use Kroll Bond Rating Agency. Ratings are shown in the S&P and Fitch scale (e.g., AAA). All ratings are subject to change.
FUND EXPENSES
What were the fund costs for the last year?
| (based on a hypothetical $10,000 investment) | ||
| Class Name | Costs of a $10,000 investment ~ | Costs paid as a percentage of a $10,000 investment ~ |
| A | $93 | 0.89% |
˜ Expenses are direct expenses and do not include underlying fund fees and expenses.
MANAGEMENT'S DISCUSSION OF FUND PERFORMANCE
-
The MFS Diversified Income Fund (fund) includes investments in lower quality debt instruments, U.S. government securities, emerging market debt instruments, dividend-paying equity securities, and real estate-related instruments.
-
For the twelve months ended February 28, 2025, Class A shares of the fund provided a total return of 8.52%, at net asset value. This compares with a return of 18.41% for the fund’s benchmark, the Standard & Poor's 500 Stock Index. The fund’s other benchmark, the MFS Diversified Income Fund Blended Index (Blended Index), generated a return of 10.36%. The Blended Index reflects the blended returns of broad asset class indices, with percentage allocations to each index designed to resemble the broad asset class allocations of the fund. The market indices and related percentage allocations used to compile the Blended Index are set forth under Fund Performance.
-
Moderating inflation pressures allowed many global central banks to ease monetary policy during the period. However, the pace of disinflation slowed toward the end of the period, particularly in the US.
-
Geopolitical strains remained high amid ongoing conflicts in Ukraine and in the Middle East, while relations between China and the US remained tense, especially regarding trade. At the end of the period, China unveiled a sizable stimulus package aimed at shoring up its property sector and the finances of highly indebted local governments while the Trump administration threatened to impose considerable tariffs on its trading partners.
-
Global equity markets reached record levels late in the period as they withstood the adversity of the unsettled geopolitical climate and a higher interest rate environment but eased back from those highs as policy uncertainty rose. Healthy earnings growth continued though advances in artificial intelligence called into question, at least temporarily, the need for extraordinary levels of infrastructure investment to support the technology.
-
Global bond yields climbed off mid-period lows on the back of the US election results, resilient economic growth, concerns that global disinflationary progress may have stalled and a rising term premium. Reflecting increased inflation uncertainty, market expectations for future Federal Reserve interest rate cuts in 2025 were largely pared back while other major global central banks, notably the ECB, Bank of Canada and Bank of England, continued their gradual easing cycles. Already compressed credit spreads tightened further as corporate fundamentals remained sound. Bond market volatility, as measured by the Merrill Lynch Option Volatility Estimate (MOVE) index, declined in the fourth quarter after peaking before the US election, but climbed late February amongst heightened tariff uncertainty.
-
Top contributors to performance relative to the MFS Diversified Income Fund Blended Index:
-
Security selection within the emerging markets debt segment contributed to relative returns.
-
-
Top detractors from performance relative to the MFS Diversified Income Fund Blended Index:
-
Security selection and an underweight exposure to the REITS segment weighed on relative returns.
-
The fund's overweight allocation to the US government bond segment also weakened relative performance.
-
FUND PERFORMANCE
The fund’s past performance is not a good predictor of the fund’s future performance. The graph and table below do not reflect the deduction of taxes that a shareholder would pay on fund distributions or the redemption of fund shares. The graph and table below assume reinvestment of dividends and capital gain distributions.
Growth of a Hypothetical $10,000 Investment
This graph shows the performance of a hypothetical $10,000 investment in Class A over a ten year period or since inception, if shorter, in comparison to (i) a broad measure of market performance and (ii) an additional index that MFS believes more closely reflects the market segments in which the fund invests. This graph includes the deduction of the maximum applicable sales charge.
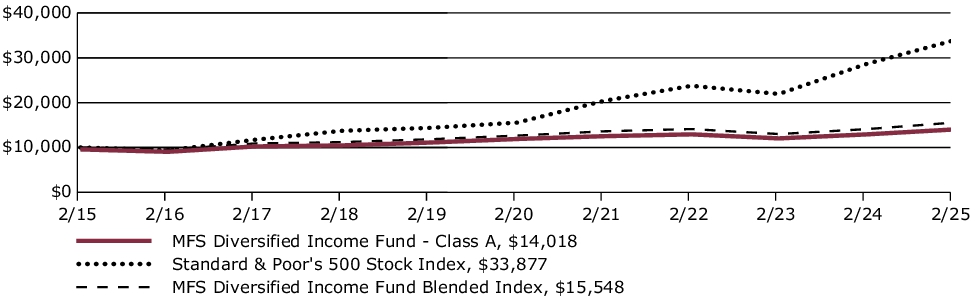
Average Annual Total Returns through 2/28/25
This table shows the average annual total returns of the class of shares noted for the periods shown, both with (if any) and without sales charges. It also shows the average annual total returns of (i) a broad measure of market performance and (ii) an additional index that MFS believes more closely reflects the market segments in which the fund invests, over the same periods.
| Share Class | 1-yr | 5-yr | 10-yr |
| A without sales charge | 8.52% | 3.34% | 3.89% |
| A with initial sales charge (4.25%) | 3.90% | 2.44% | 3.44% |
| Comparative Benchmark(s) | |||
| Standard & Poor's 500 Stock Index ∆ | 18.41% | 16.85% | 12.98% |
| MFS Diversified Income Fund Blended Index ∆ | 10.36% | 4.21% | 4.51% |
|
∆ |
Source: FactSet Research Systems Inc. |
Visit mfs.com/perf/a for more recent performance information.
FUND STATISTICS AS OF 2/28/25
| Net Assets ($): | 2,013,925,358 | Total Management Fee ($)#: | 11,463,961 | |
| Total Number of Holdings: | 1,413 | Portfolio Turnover Rate (%): | 48 |
# Includes the effect of any management fee waivers, if applicable.
Where the fund holds derivatives, they are not included in the total number of portfolio holdings.
PORTFOLIO COMPOSITION (BASED ON TOTAL INVESTMENTS AS OF 2/28/25)
Portfolio structure
| Fixed Income ~ | 66.3% |
| Equities | 32.3% |
| Money Market Funds | 1.4% |
Equity sectors
| Real Estate | 12.6% |
| Consumer Staples | 3.6% |
| Financials | 3.6% |
| Health Care | 2.8% |
| Consumer Discretionary | 1.7% |
| Energy | 1.5% |
| Industrials | 1.5% |
| Information Technology | 1.5% |
| Materials | 1.2% |
| Communication Services | 1.1% |
| Utilities | 0.9% |
| Index Options | 0.3% |
| Equity Warrants | 0.0% |
Composition including fixed income credit quality
| AAA | 1.7% |
| AA | 1.8% |
| A | 7.4% |
| BBB | 11.4% |
| BB | 14.9% |
| B | 10.9% |
| CCC | 4.0% |
| CC | 0.2% |
| C | 0.2% |
| U.S. Governments | 3.7% |
| Federal Agencies | 9.8% |
| Not Rated | 0.3% |
| Non-Fixed Income | 32.3% |
| Money Market Funds | 1.4% |
MFS uses the Global Industry Classification Standard (GICS®) for sector/industry reporting. MFS has applied its own internal sector/industry classification methodology for equity securities and non-equity securities that are unclassified by GICS.
Ratings are assigned using Moody’s, Fitch, and Standard & Poor’s and applying a hierarchy: If all 3 agencies rate a security, the middle rating is assigned; if 2 agencies rate a security, the lower rating is assigned. If none of the 3 agencies rate a security, we use DBRS Morningstar. If none of the 4 agencies rate a security, we use Kroll Bond Rating Agency. Ratings are shown in the S&P and Fitch scale (e.g., AAA). All ratings are subject to change.
The fund invests a portion of its assets in the MFS High Yield Pooled Portfolio. Percentages include the indirect exposure to the underlying holdings of the MFS High Yield Pooled Portfolio and not the direct exposure from investing in the MFS High Yield Pooled Portfolio itself.
~ The fund invests a portion of its assets in Exchange-Traded Funds (ETFs) or Options on ETFs to gain fixed income exposure. Percentages include the direct exposure from investing in ETFs or Options on ETFs and not the indirect exposure to the underlying holdings.
Ratings are assigned using Moody’s, Fitch, and Standard & Poor’s and applying a hierarchy: If all 3 agencies rate a security, the middle rating is assigned; if 2 agencies rate a security, the lower rating is assigned. If none of the 3 agencies rate a security, we use DBRS Morningstar. If none of the 4 agencies rate a security, we use Kroll Bond Rating Agency. Ratings are shown in the S&P and Fitch scale (e.g., AAA). All ratings are subject to change.
FUND EXPENSES
What were the fund costs for the last year?
| (based on a hypothetical $10,000 investment) | ||
| Class Name | Costs of a $10,000 investment ~ | Costs paid as a percentage of a $10,000 investment ~ |
| C | $170 | 1.64% |
˜ Expenses are direct expenses and do not include underlying fund fees and expenses.
MANAGEMENT'S DISCUSSION OF FUND PERFORMANCE
-
The MFS Diversified Income Fund (fund) includes investments in lower quality debt instruments, U.S. government securities, emerging market debt instruments, dividend-paying equity securities, and real estate-related instruments.
-
For the twelve months ended February 28, 2025, Class C shares of the fund provided a total return of 7.71%, at net asset value. This compares with a return of 18.41% for the fund’s benchmark, the Standard & Poor's 500 Stock Index. The fund’s other benchmark, the MFS Diversified Income Fund Blended Index (Blended Index), generated a return of 10.36%. The Blended Index reflects the blended returns of broad asset class indices, with percentage allocations to each index designed to resemble the broad asset class allocations of the fund. The market indices and related percentage allocations used to compile the Blended Index are set forth under Fund Performance.
-
Moderating inflation pressures allowed many global central banks to ease monetary policy during the period. However, the pace of disinflation slowed toward the end of the period, particularly in the US.
-
Geopolitical strains remained high amid ongoing conflicts in Ukraine and in the Middle East, while relations between China and the US remained tense, especially regarding trade. At the end of the period, China unveiled a sizable stimulus package aimed at shoring up its property sector and the finances of highly indebted local governments while the Trump administration threatened to impose considerable tariffs on its trading partners.
-
Global equity markets reached record levels late in the period as they withstood the adversity of the unsettled geopolitical climate and a higher interest rate environment but eased back from those highs as policy uncertainty rose. Healthy earnings growth continued though advances in artificial intelligence called into question, at least temporarily, the need for extraordinary levels of infrastructure investment to support the technology.
-
Global bond yields climbed off mid-period lows on the back of the US election results, resilient economic growth, concerns that global disinflationary progress may have stalled and a rising term premium. Reflecting increased inflation uncertainty, market expectations for future Federal Reserve interest rate cuts in 2025 were largely pared back while other major global central banks, notably the ECB, Bank of Canada and Bank of England, continued their gradual easing cycles. Already compressed credit spreads tightened further as corporate fundamentals remained sound. Bond market volatility, as measured by the Merrill Lynch Option Volatility Estimate (MOVE) index, declined in the fourth quarter after peaking before the US election, but climbed late February amongst heightened tariff uncertainty.
-
Top contributors to performance relative to the MFS Diversified Income Fund Blended Index:
-
Security selection within the emerging markets debt segment contributed to relative returns.
-
-
Top detractors from performance relative to the MFS Diversified Income Fund Blended Index:
-
Security selection and an underweight exposure to the REITS segment weighed on relative returns.
-
The fund's overweight allocation to the US government bond segment also weakened relative performance.
-
FUND PERFORMANCE
The fund’s past performance is not a good predictor of the fund’s future performance. The graph and table below do not reflect the deduction of taxes that a shareholder would pay on fund distributions or the redemption of fund shares. The graph and table below assume reinvestment of dividends and capital gain distributions.
Growth of a Hypothetical $10,000 Investment
This graph shows the performance of a hypothetical $10,000 investment in Class C over a ten year period or since inception, if shorter, in comparison to (i) a broad measure of market performance and (ii) an additional index that MFS believes more closely reflects the market segments in which the fund invests.
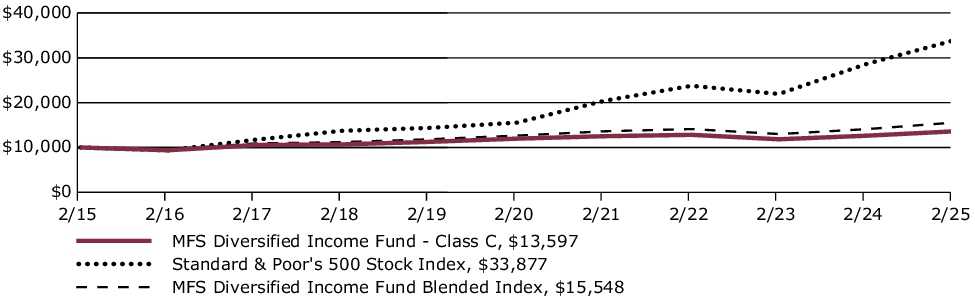
Average Annual Total Returns through 2/28/25
This table shows the average annual total returns of the class of shares noted for the periods shown, both with (if any) and without sales charges. It also shows the average annual total returns of (i) a broad measure of market performance and (ii) an additional index that MFS believes more closely reflects the market segments in which the fund invests, over the same periods.
| Share Class | 1-yr | 5-yr | 10-yr |
| C without sales charge | 7.71% | 2.58% | 3.12% |
| C with CDSC (1% for 12 months)× | 6.71% | 2.58% | 3.12% |
| Comparative Benchmark(s) | |||
| Standard & Poor's 500 Stock Index ∆ | 18.41% | 16.85% | 12.98% |
| MFS Diversified Income Fund Blended Index ∆ | 10.36% | 4.21% | 4.51% |
|
∆
|
Source: FactSet Research Systems Inc.
|
|
×
|
Assuming redemption at the end of the applicable period.
|
Visit mfs.com/perf/c for more recent performance information.
FUND STATISTICS AS OF 2/28/25
| Net Assets ($): | 2,013,925,358 | Total Management Fee ($)#: | 11,463,961 | |
| Total Number of Holdings: | 1,413 | Portfolio Turnover Rate (%): | 48 |
# Includes the effect of any management fee waivers, if applicable.
Where the fund holds derivatives, they are not included in the total number of portfolio holdings.
PORTFOLIO COMPOSITION (BASED ON TOTAL INVESTMENTS AS OF 2/28/25)
Portfolio structure
| Fixed Income ~ | 66.3% |
| Equities | 32.3% |
| Money Market Funds | 1.4% |
Equity sectors
| Real Estate | 12.6% |
| Consumer Staples | 3.6% |
| Financials | 3.6% |
| Health Care | 2.8% |
| Consumer Discretionary | 1.7% |
| Energy | 1.5% |
| Industrials | 1.5% |
| Information Technology | 1.5% |
| Materials | 1.2% |
| Communication Services | 1.1% |
| Utilities | 0.9% |
| Index Options | 0.3% |
| Equity Warrants | 0.0% |
Composition including fixed income credit quality
| AAA | 1.7% |
| AA | 1.8% |
| A | 7.4% |
| BBB | 11.4% |
| BB | 14.9% |
| B | 10.9% |
| CCC | 4.0% |
| CC | 0.2% |
| C | 0.2% |
| U.S. Governments | 3.7% |
| Federal Agencies | 9.8% |
| Not Rated | 0.3% |
| Non-Fixed Income | 32.3% |
| Money Market Funds | 1.4% |
MFS uses the Global Industry Classification Standard (GICS®) for sector/industry reporting. MFS has applied its own internal sector/industry classification methodology for equity securities and non-equity securities that are unclassified by GICS.
Ratings are assigned using Moody’s, Fitch, and Standard & Poor’s and applying a hierarchy: If all 3 agencies rate a security, the middle rating is assigned; if 2 agencies rate a security, the lower rating is assigned. If none of the 3 agencies rate a security, we use DBRS Morningstar. If none of the 4 agencies rate a security, we use Kroll Bond Rating Agency. Ratings are shown in the S&P and Fitch scale (e.g., AAA). All ratings are subject to change.
The fund invests a portion of its assets in the MFS High Yield Pooled Portfolio. Percentages include the indirect exposure to the underlying holdings of the MFS High Yield Pooled Portfolio and not the direct exposure from investing in the MFS High Yield Pooled Portfolio itself.
~ The fund invests a portion of its assets in Exchange-Traded Funds (ETFs) or Options on ETFs to gain fixed income exposure. Percentages include the direct exposure from investing in ETFs or Options on ETFs and not the indirect exposure to the underlying holdings.
Ratings are assigned using Moody’s, Fitch, and Standard & Poor’s and applying a hierarchy: If all 3 agencies rate a security, the middle rating is assigned; if 2 agencies rate a security, the lower rating is assigned. If none of the 3 agencies rate a security, we use DBRS Morningstar. If none of the 4 agencies rate a security, we use Kroll Bond Rating Agency. Ratings are shown in the S&P and Fitch scale (e.g., AAA). All ratings are subject to change.
FUND EXPENSES
What were the fund costs for the last year?
| (based on a hypothetical $10,000 investment) | ||
| Class Name | Costs of a $10,000 investment ~ | Costs paid as a percentage of a $10,000 investment ~ |
| I | $67 | 0.64% |
˜ Expenses are direct expenses and do not include underlying fund fees and expenses.
MANAGEMENT'S DISCUSSION OF FUND PERFORMANCE
-
The MFS Diversified Income Fund (fund) includes investments in lower quality debt instruments, U.S. government securities, emerging market debt instruments, dividend-paying equity securities, and real estate-related instruments.
-
For the twelve months ended February 28, 2025, Class I shares of the fund provided a total return of 8.78%, at net asset value. This compares with a return of 18.41% for the fund’s benchmark, the Standard & Poor's 500 Stock Index. The fund’s other benchmark, the MFS Diversified Income Fund Blended Index (Blended Index), generated a return of 10.36%. The Blended Index reflects the blended returns of broad asset class indices, with percentage allocations to each index designed to resemble the broad asset class allocations of the fund. The market indices and related percentage allocations used to compile the Blended Index are set forth under Fund Performance.
-
Moderating inflation pressures allowed many global central banks to ease monetary policy during the period. However, the pace of disinflation slowed toward the end of the period, particularly in the US.
-
Geopolitical strains remained high amid ongoing conflicts in Ukraine and in the Middle East, while relations between China and the US remained tense, especially regarding trade. At the end of the period, China unveiled a sizable stimulus package aimed at shoring up its property sector and the finances of highly indebted local governments while the Trump administration threatened to impose considerable tariffs on its trading partners.
-
Global equity markets reached record levels late in the period as they withstood the adversity of the unsettled geopolitical climate and a higher interest rate environment but eased back from those highs as policy uncertainty rose. Healthy earnings growth continued though advances in artificial intelligence called into question, at least temporarily, the need for extraordinary levels of infrastructure investment to support the technology.
-
Global bond yields climbed off mid-period lows on the back of the US election results, resilient economic growth, concerns that global disinflationary progress may have stalled and a rising term premium. Reflecting increased inflation uncertainty, market expectations for future Federal Reserve interest rate cuts in 2025 were largely pared back while other major global central banks, notably the ECB, Bank of Canada and Bank of England, continued their gradual easing cycles. Already compressed credit spreads tightened further as corporate fundamentals remained sound. Bond market volatility, as measured by the Merrill Lynch Option Volatility Estimate (MOVE) index, declined in the fourth quarter after peaking before the US election, but climbed late February amongst heightened tariff uncertainty.
-
Top contributors to performance relative to the MFS Diversified Income Fund Blended Index:
-
Security selection within the emerging markets debt segment contributed to relative returns.
-
-
Top detractors from performance relative to the MFS Diversified Income Fund Blended Index:
-
Security selection and an underweight exposure to the REITS segment weighed on relative returns.
-
The fund's overweight allocation to the US government bond segment also weakened relative performance.
-
FUND PERFORMANCE
The fund’s past performance is not a good predictor of the fund’s future performance. The graph and table below do not reflect the deduction of taxes that a shareholder would pay on fund distributions or the redemption of fund shares. The graph and table below assume reinvestment of dividends and capital gain distributions.
Growth of a Hypothetical $10,000 Investment
This graph shows the performance of a hypothetical $10,000 investment in Class I over a ten year period or since inception, if shorter, in comparison to (i) a broad measure of market performance and (ii) an additional index that MFS believes more closely reflects the market segments in which the fund invests.

Average Annual Total Returns through 2/28/25
This table shows the average annual total returns of the class of shares noted for the periods shown, both with (if any) and without sales charges. It also shows the average annual total returns of (i) a broad measure of market performance and (ii) an additional index that MFS believes more closely reflects the market segments in which the fund invests, over the same periods.
| Share Class | 1-yr | 5-yr | 10-yr |
| I without sales charge | 8.78% | 3.59% | 4.14% |
| Comparative Benchmark(s) | |||
| Standard & Poor's 500 Stock Index ∆ | 18.41% | 16.85% | 12.98% |
| MFS Diversified Income Fund Blended Index ∆ | 10.36% | 4.21% | 4.51% |
|
∆ |
Source: FactSet Research Systems Inc. |
Visit mfs.com/perf/i for more recent performance information.
FUND STATISTICS AS OF 2/28/25
| Net Assets ($): | 2,013,925,358 | Total Management Fee ($)#: | 11,463,961 | |
| Total Number of Holdings: | 1,413 | Portfolio Turnover Rate (%): | 48 |
# Includes the effect of any management fee waivers, if applicable.
Where the fund holds derivatives, they are not included in the total number of portfolio holdings.
PORTFOLIO COMPOSITION (BASED ON TOTAL INVESTMENTS AS OF 2/28/25)
Portfolio structure
| Fixed Income ~ | 66.3% |
| Equities | 32.3% |
| Money Market Funds | 1.4% |
Equity sectors
| Real Estate | 12.6% |
| Consumer Staples | 3.6% |
| Financials | 3.6% |
| Health Care | 2.8% |
| Consumer Discretionary | 1.7% |
| Energy | 1.5% |
| Industrials | 1.5% |
| Information Technology | 1.5% |
| Materials | 1.2% |
| Communication Services | 1.1% |
| Utilities | 0.9% |
| Index Options | 0.3% |
| Equity Warrants | 0.0% |
Composition including fixed income credit quality
| AAA | 1.7% |
| AA | 1.8% |
| A | 7.4% |
| BBB | 11.4% |
| BB | 14.9% |
| B | 10.9% |
| CCC | 4.0% |
| CC | 0.2% |
| C | 0.2% |
| U.S. Governments | 3.7% |
| Federal Agencies | 9.8% |
| Not Rated | 0.3% |
| Non-Fixed Income | 32.3% |
| Money Market Funds | 1.4% |
MFS uses the Global Industry Classification Standard (GICS®) for sector/industry reporting. MFS has applied its own internal sector/industry classification methodology for equity securities and non-equity securities that are unclassified by GICS.
Ratings are assigned using Moody’s, Fitch, and Standard & Poor’s and applying a hierarchy: If all 3 agencies rate a security, the middle rating is assigned; if 2 agencies rate a security, the lower rating is assigned. If none of the 3 agencies rate a security, we use DBRS Morningstar. If none of the 4 agencies rate a security, we use Kroll Bond Rating Agency. Ratings are shown in the S&P and Fitch scale (e.g., AAA). All ratings are subject to change.
The fund invests a portion of its assets in the MFS High Yield Pooled Portfolio. Percentages include the indirect exposure to the underlying holdings of the MFS High Yield Pooled Portfolio and not the direct exposure from investing in the MFS High Yield Pooled Portfolio itself.
~ The fund invests a portion of its assets in Exchange-Traded Funds (ETFs) or Options on ETFs to gain fixed income exposure. Percentages include the direct exposure from investing in ETFs or Options on ETFs and not the indirect exposure to the underlying holdings.
Ratings are assigned using Moody’s, Fitch, and Standard & Poor’s and applying a hierarchy: If all 3 agencies rate a security, the middle rating is assigned; if 2 agencies rate a security, the lower rating is assigned. If none of the 3 agencies rate a security, we use DBRS Morningstar. If none of the 4 agencies rate a security, we use Kroll Bond Rating Agency. Ratings are shown in the S&P and Fitch scale (e.g., AAA). All ratings are subject to change.
FUND EXPENSES
What were the fund costs for the last year?
| (based on a hypothetical $10,000 investment) | ||
| Class Name | Costs of a $10,000 investment ~ | Costs paid as a percentage of a $10,000 investment ~ |
| R1 | $170 | 1.64% |
˜ Expenses are direct expenses and do not include underlying fund fees and expenses.
MANAGEMENT'S DISCUSSION OF FUND PERFORMANCE
-
The MFS Diversified Income Fund (fund) includes investments in lower quality debt instruments, U.S. government securities, emerging market debt instruments, dividend-paying equity securities, and real estate-related instruments.
-
For the twelve months ended February 28, 2025, Class R1 shares of the fund provided a total return of 7.72%, at net asset value. This compares with a return of 18.41% for the fund’s benchmark, the Standard & Poor's 500 Stock Index. The fund’s other benchmark, the MFS Diversified Income Fund Blended Index (Blended Index), generated a return of 10.36%. The Blended Index reflects the blended returns of broad asset class indices, with percentage allocations to each index designed to resemble the broad asset class allocations of the fund. The market indices and related percentage allocations used to compile the Blended Index are set forth under Fund Performance.
-
Moderating inflation pressures allowed many global central banks to ease monetary policy during the period. However, the pace of disinflation slowed toward the end of the period, particularly in the US.
-
Geopolitical strains remained high amid ongoing conflicts in Ukraine and in the Middle East, while relations between China and the US remained tense, especially regarding trade. At the end of the period, China unveiled a sizable stimulus package aimed at shoring up its property sector and the finances of highly indebted local governments while the Trump administration threatened to impose considerable tariffs on its trading partners.
-
Global equity markets reached record levels late in the period as they withstood the adversity of the unsettled geopolitical climate and a higher interest rate environment but eased back from those highs as policy uncertainty rose. Healthy earnings growth continued though advances in artificial intelligence called into question, at least temporarily, the need for extraordinary levels of infrastructure investment to support the technology.
-
Global bond yields climbed off mid-period lows on the back of the US election results, resilient economic growth, concerns that global disinflationary progress may have stalled and a rising term premium. Reflecting increased inflation uncertainty, market expectations for future Federal Reserve interest rate cuts in 2025 were largely pared back while other major global central banks, notably the ECB, Bank of Canada and Bank of England, continued their gradual easing cycles. Already compressed credit spreads tightened further as corporate fundamentals remained sound. Bond market volatility, as measured by the Merrill Lynch Option Volatility Estimate (MOVE) index, declined in the fourth quarter after peaking before the US election, but climbed late February amongst heightened tariff uncertainty.
-
Top contributors to performance relative to the MFS Diversified Income Fund Blended Index:
-
Security selection within the emerging markets debt segment contributed to relative returns.
-
-
Top detractors from performance relative to the MFS Diversified Income Fund Blended Index:
-
Security selection and an underweight exposure to the REITS segment weighed on relative returns.
-
The fund's overweight allocation to the US government bond segment also weakened relative performance.
-
FUND PERFORMANCE
The fund’s past performance is not a good predictor of the fund’s future performance. The graph and table below do not reflect the deduction of taxes that a shareholder would pay on fund distributions or the redemption of fund shares. The graph and table below assume reinvestment of dividends and capital gain distributions.
Growth of a Hypothetical $10,000 Investment
This graph shows the performance of a hypothetical $10,000 investment in Class R1 over a ten year period or since inception, if shorter, in comparison to (i) a broad measure of market performance and (ii) an additional index that MFS believes more closely reflects the market segments in which the fund invests.

Average Annual Total Returns through 2/28/25
This table shows the average annual total returns of the class of shares noted for the periods shown, both with (if any) and without sales charges. It also shows the average annual total returns of (i) a broad measure of market performance and (ii) an additional index that MFS believes more closely reflects the market segments in which the fund invests, over the same periods.
| Share Class | 1-yr | 5-yr | 10-yr |
| R1 without sales charge | 7.72% | 2.56% | 3.12% |
| Comparative Benchmark(s) | |||
| Standard & Poor's 500 Stock Index ∆ | 18.41% | 16.85% | 12.98% |
| MFS Diversified Income Fund Blended Index ∆ | 10.36% | 4.21% | 4.51% |
|
∆ |
Source: FactSet Research Systems Inc. |
Visit mfs.com/perf/r1 for more recent performance information.
FUND STATISTICS AS OF 2/28/25
| Net Assets ($): | 2,013,925,358 | Total Management Fee ($)#: | 11,463,961 | |
| Total Number of Holdings: | 1,413 | Portfolio Turnover Rate (%): | 48 |
# Includes the effect of any management fee waivers, if applicable.
Where the fund holds derivatives, they are not included in the total number of portfolio holdings.
PORTFOLIO COMPOSITION (BASED ON TOTAL INVESTMENTS AS OF 2/28/25)
Portfolio structure
| Fixed Income ~ | 66.3% |
| Equities | 32.3% |
| Money Market Funds | 1.4% |
Equity sectors
| Real Estate | 12.6% |
| Consumer Staples | 3.6% |
| Financials | 3.6% |
| Health Care | 2.8% |
| Consumer Discretionary | 1.7% |
| Energy | 1.5% |
| Industrials | 1.5% |
| Information Technology | 1.5% |
| Materials | 1.2% |
| Communication Services | 1.1% |
| Utilities | 0.9% |
| Index Options | 0.3% |
| Equity Warrants | 0.0% |
Composition including fixed income credit quality
| AAA | 1.7% |
| AA | 1.8% |
| A | 7.4% |
| BBB | 11.4% |
| BB | 14.9% |
| B | 10.9% |
| CCC | 4.0% |
| CC | 0.2% |
| C | 0.2% |
| U.S. Governments | 3.7% |
| Federal Agencies | 9.8% |
| Not Rated | 0.3% |
| Non-Fixed Income | 32.3% |
| Money Market Funds | 1.4% |
MFS uses the Global Industry Classification Standard (GICS®) for sector/industry reporting. MFS has applied its own internal sector/industry classification methodology for equity securities and non-equity securities that are unclassified by GICS.
Ratings are assigned using Moody’s, Fitch, and Standard & Poor’s and applying a hierarchy: If all 3 agencies rate a security, the middle rating is assigned; if 2 agencies rate a security, the lower rating is assigned. If none of the 3 agencies rate a security, we use DBRS Morningstar. If none of the 4 agencies rate a security, we use Kroll Bond Rating Agency. Ratings are shown in the S&P and Fitch scale (e.g., AAA). All ratings are subject to change.
The fund invests a portion of its assets in the MFS High Yield Pooled Portfolio. Percentages include the indirect exposure to the underlying holdings of the MFS High Yield Pooled Portfolio and not the direct exposure from investing in the MFS High Yield Pooled Portfolio itself.
~ The fund invests a portion of its assets in Exchange-Traded Funds (ETFs) or Options on ETFs to gain fixed income exposure. Percentages include the direct exposure from investing in ETFs or Options on ETFs and not the indirect exposure to the underlying holdings.
Ratings are assigned using Moody’s, Fitch, and Standard & Poor’s and applying a hierarchy: If all 3 agencies rate a security, the middle rating is assigned; if 2 agencies rate a security, the lower rating is assigned. If none of the 3 agencies rate a security, we use DBRS Morningstar. If none of the 4 agencies rate a security, we use Kroll Bond Rating Agency. Ratings are shown in the S&P and Fitch scale (e.g., AAA). All ratings are subject to change.
FUND EXPENSES
What were the fund costs for the last year?
| (based on a hypothetical $10,000 investment) | ||
| Class Name | Costs of a $10,000 investment ~ | Costs paid as a percentage of a $10,000 investment ~ |
| R2 | $119 | 1.14% |
˜ Expenses are direct expenses and do not include underlying fund fees and expenses.
MANAGEMENT'S DISCUSSION OF FUND PERFORMANCE
-
The MFS Diversified Income Fund (fund) includes investments in lower quality debt instruments, U.S. government securities, emerging market debt instruments, dividend-paying equity securities, and real estate-related instruments.
-
For the twelve months ended February 28, 2025, Class R2 shares of the fund provided a total return of 8.25%, at net asset value. This compares with a return of 18.41% for the fund’s benchmark, the Standard & Poor's 500 Stock Index. The fund’s other benchmark, the MFS Diversified Income Fund Blended Index (Blended Index), generated a return of 10.36%. The Blended Index reflects the blended returns of broad asset class indices, with percentage allocations to each index designed to resemble the broad asset class allocations of the fund. The market indices and related percentage allocations used to compile the Blended Index are set forth under Fund Performance.
-
Moderating inflation pressures allowed many global central banks to ease monetary policy during the period. However, the pace of disinflation slowed toward the end of the period, particularly in the US.
-
Geopolitical strains remained high amid ongoing conflicts in Ukraine and in the Middle East, while relations between China and the US remained tense, especially regarding trade. At the end of the period, China unveiled a sizable stimulus package aimed at shoring up its property sector and the finances of highly indebted local governments while the Trump administration threatened to impose considerable tariffs on its trading partners.
-
Global equity markets reached record levels late in the period as they withstood the adversity of the unsettled geopolitical climate and a higher interest rate environment but eased back from those highs as policy uncertainty rose. Healthy earnings growth continued though advances in artificial intelligence called into question, at least temporarily, the need for extraordinary levels of infrastructure investment to support the technology.
-
Global bond yields climbed off mid-period lows on the back of the US election results, resilient economic growth, concerns that global disinflationary progress may have stalled and a rising term premium. Reflecting increased inflation uncertainty, market expectations for future Federal Reserve interest rate cuts in 2025 were largely pared back while other major global central banks, notably the ECB, Bank of Canada and Bank of England, continued their gradual easing cycles. Already compressed credit spreads tightened further as corporate fundamentals remained sound. Bond market volatility, as measured by the Merrill Lynch Option Volatility Estimate (MOVE) index, declined in the fourth quarter after peaking before the US election, but climbed late February amongst heightened tariff uncertainty.
-
Top contributors to performance relative to the MFS Diversified Income Fund Blended Index:
-
Security selection within the emerging markets debt segment contributed to relative returns.
-
-
Top detractors from performance relative to the MFS Diversified Income Fund Blended Index:
-
Security selection and an underweight exposure to the REITS segment weighed on relative returns.
-
The fund's overweight allocation to the US government bond segment also weakened relative performance.
-
FUND PERFORMANCE
The fund’s past performance is not a good predictor of the fund’s future performance. The graph and table below do not reflect the deduction of taxes that a shareholder would pay on fund distributions or the redemption of fund shares. The graph and table below assume reinvestment of dividends and capital gain distributions.
Growth of a Hypothetical $10,000 Investment
This graph shows the performance of a hypothetical $10,000 investment in Class R2 over a ten year period or since inception, if shorter, in comparison to (i) a broad measure of market performance and (ii) an additional index that MFS believes more closely reflects the market segments in which the fund invests.
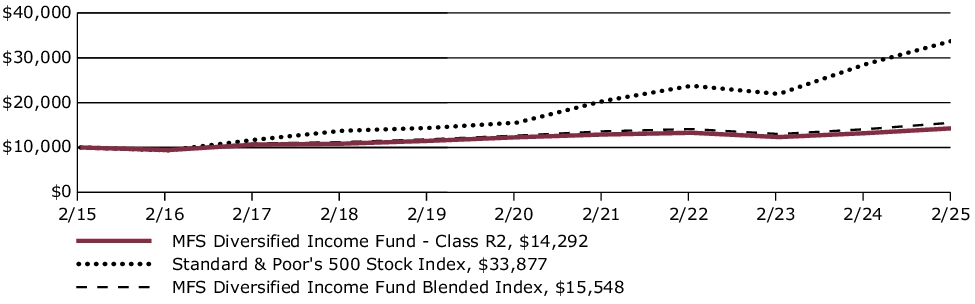
Average Annual Total Returns through 2/28/25
This table shows the average annual total returns of the class of shares noted for the periods shown, both with (if any) and without sales charges. It also shows the average annual total returns of (i) a broad measure of market performance and (ii) an additional index that MFS believes more closely reflects the market segments in which the fund invests, over the same periods.
| Share Class | 1-yr | 5-yr | 10-yr |
| R2 without sales charge | 8.25% | 3.08% | 3.64% |
| Comparative Benchmark(s) | |||
| Standard & Poor's 500 Stock Index ∆ | 18.41% | 16.85% | 12.98% |
| MFS Diversified Income Fund Blended Index ∆ | 10.36% | 4.21% | 4.51% |
|
∆ |
Source: FactSet Research Systems Inc. |
Visit mfs.com/perf/r2 for more recent performance information.
FUND STATISTICS AS OF 2/28/25
| Net Assets ($): | 2,013,925,358 | Total Management Fee ($)#: | 11,463,961 | |
| Total Number of Holdings: | 1,413 | Portfolio Turnover Rate (%): | 48 |
# Includes the effect of any management fee waivers, if applicable.
Where the fund holds derivatives, they are not included in the total number of portfolio holdings.
PORTFOLIO COMPOSITION (BASED ON TOTAL INVESTMENTS AS OF 2/28/25)
Portfolio structure
| Fixed Income ~ | 66.3% |
| Equities | 32.3% |
| Money Market Funds | 1.4% |
Equity sectors
| Real Estate | 12.6% |
| Consumer Staples | 3.6% |
| Financials | 3.6% |
| Health Care | 2.8% |
| Consumer Discretionary | 1.7% |
| Energy | 1.5% |
| Industrials | 1.5% |
| Information Technology | 1.5% |
| Materials | 1.2% |
| Communication Services | 1.1% |
| Utilities | 0.9% |
| Index Options | 0.3% |
| Equity Warrants | 0.0% |
Composition including fixed income credit quality
| AAA | 1.7% |
| AA | 1.8% |
| A | 7.4% |
| BBB | 11.4% |
| BB | 14.9% |
| B | 10.9% |
| CCC | 4.0% |
| CC | 0.2% |
| C | 0.2% |
| U.S. Governments | 3.7% |
| Federal Agencies | 9.8% |
| Not Rated | 0.3% |
| Non-Fixed Income | 32.3% |
| Money Market Funds | 1.4% |
MFS uses the Global Industry Classification Standard (GICS®) for sector/industry reporting. MFS has applied its own internal sector/industry classification methodology for equity securities and non-equity securities that are unclassified by GICS.
Ratings are assigned using Moody’s, Fitch, and Standard & Poor’s and applying a hierarchy: If all 3 agencies rate a security, the middle rating is assigned; if 2 agencies rate a security, the lower rating is assigned. If none of the 3 agencies rate a security, we use DBRS Morningstar. If none of the 4 agencies rate a security, we use Kroll Bond Rating Agency. Ratings are shown in the S&P and Fitch scale (e.g., AAA). All ratings are subject to change.
The fund invests a portion of its assets in the MFS High Yield Pooled Portfolio. Percentages include the indirect exposure to the underlying holdings of the MFS High Yield Pooled Portfolio and not the direct exposure from investing in the MFS High Yield Pooled Portfolio itself.
~ The fund invests a portion of its assets in Exchange-Traded Funds (ETFs) or Options on ETFs to gain fixed income exposure. Percentages include the direct exposure from investing in ETFs or Options on ETFs and not the indirect exposure to the underlying holdings.
Ratings are assigned using Moody’s, Fitch, and Standard & Poor’s and applying a hierarchy: If all 3 agencies rate a security, the middle rating is assigned; if 2 agencies rate a security, the lower rating is assigned. If none of the 3 agencies rate a security, we use DBRS Morningstar. If none of the 4 agencies rate a security, we use Kroll Bond Rating Agency. Ratings are shown in the S&P and Fitch scale (e.g., AAA). All ratings are subject to change.
FUND EXPENSES
What were the fund costs for the last year?
| (based on a hypothetical $10,000 investment) | ||
| Class Name | Costs of a $10,000 investment ~ | Costs paid as a percentage of a $10,000 investment ~ |
| R3 | $93 | 0.89% |
˜ Expenses are direct expenses and do not include underlying fund fees and expenses.
MANAGEMENT'S DISCUSSION OF FUND PERFORMANCE
-
The MFS Diversified Income Fund (fund) includes investments in lower quality debt instruments, U.S. government securities, emerging market debt instruments, dividend-paying equity securities, and real estate-related instruments.
-
For the twelve months ended February 28, 2025, Class R3 shares of the fund provided a total return of 8.51%, at net asset value. This compares with a return of 18.41% for the fund’s benchmark, the Standard & Poor's 500 Stock Index. The fund’s other benchmark, the MFS Diversified Income Fund Blended Index (Blended Index), generated a return of 10.36%. The Blended Index reflects the blended returns of broad asset class indices, with percentage allocations to each index designed to resemble the broad asset class allocations of the fund. The market indices and related percentage allocations used to compile the Blended Index are set forth under Fund Performance.
-
Moderating inflation pressures allowed many global central banks to ease monetary policy during the period. However, the pace of disinflation slowed toward the end of the period, particularly in the US.
-
Geopolitical strains remained high amid ongoing conflicts in Ukraine and in the Middle East, while relations between China and the US remained tense, especially regarding trade. At the end of the period, China unveiled a sizable stimulus package aimed at shoring up its property sector and the finances of highly indebted local governments while the Trump administration threatened to impose considerable tariffs on its trading partners.
-
Global equity markets reached record levels late in the period as they withstood the adversity of the unsettled geopolitical climate and a higher interest rate environment but eased back from those highs as policy uncertainty rose. Healthy earnings growth continued though advances in artificial intelligence called into question, at least temporarily, the need for extraordinary levels of infrastructure investment to support the technology.
-
Global bond yields climbed off mid-period lows on the back of the US election results, resilient economic growth, concerns that global disinflationary progress may have stalled and a rising term premium. Reflecting increased inflation uncertainty, market expectations for future Federal Reserve interest rate cuts in 2025 were largely pared back while other major global central banks, notably the ECB, Bank of Canada and Bank of England, continued their gradual easing cycles. Already compressed credit spreads tightened further as corporate fundamentals remained sound. Bond market volatility, as measured by the Merrill Lynch Option Volatility Estimate (MOVE) index, declined in the fourth quarter after peaking before the US election, but climbed late February amongst heightened tariff uncertainty.
-
Top contributors to performance relative to the MFS Diversified Income Fund Blended Index:
-
Security selection within the emerging markets debt segment contributed to relative returns.
-
-
Top detractors from performance relative to the MFS Diversified Income Fund Blended Index:
-
Security selection and an underweight exposure to the REITS segment weighed on relative returns.
-
The fund's overweight allocation to the US government bond segment also weakened relative performance.
-
FUND PERFORMANCE
The fund’s past performance is not a good predictor of the fund’s future performance. The graph and table below do not reflect the deduction of taxes that a shareholder would pay on fund distributions or the redemption of fund shares. The graph and table below assume reinvestment of dividends and capital gain distributions.
Growth of a Hypothetical $10,000 Investment
This graph shows the performance of a hypothetical $10,000 investment in Class R3 over a ten year period or since inception, if shorter, in comparison to (i) a broad measure of market performance and (ii) an additional index that MFS believes more closely reflects the market segments in which the fund invests.
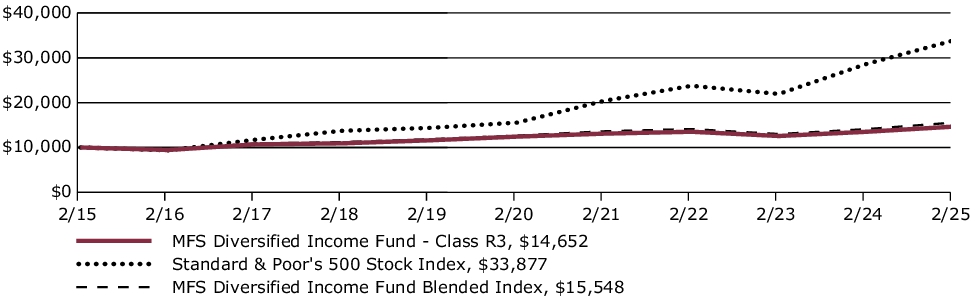
Average Annual Total Returns through 2/28/25
This table shows the average annual total returns of the class of shares noted for the periods shown, both with (if any) and without sales charges. It also shows the average annual total returns of (i) a broad measure of market performance and (ii) an additional index that MFS believes more closely reflects the market segments in which the fund invests, over the same periods.
| Share Class | 1-yr | 5-yr | 10-yr |
| R3 without sales charge | 8.51% | 3.35% | 3.89% |
| Comparative Benchmark(s) | |||
| Standard & Poor's 500 Stock Index ∆ | 18.41% | 16.85% | 12.98% |
| MFS Diversified Income Fund Blended Index ∆ | 10.36% | 4.21% | 4.51% |
|
∆ |
Source: FactSet Research Systems Inc. |
Visit mfs.com/perf/r3 for more recent performance information.
FUND STATISTICS AS OF 2/28/25
| Net Assets ($): | 2,013,925,358 | Total Management Fee ($)#: | 11,463,961 | |
| Total Number of Holdings: | 1,413 | Portfolio Turnover Rate (%): | 48 |
# Includes the effect of any management fee waivers, if applicable.
Where the fund holds derivatives, they are not included in the total number of portfolio holdings.
PORTFOLIO COMPOSITION (BASED ON TOTAL INVESTMENTS AS OF 2/28/25)
Portfolio structure
| Fixed Income ~ | 66.3% |
| Equities | 32.3% |
| Money Market Funds | 1.4% |
Equity sectors
| Real Estate | 12.6% |
| Consumer Staples | 3.6% |
| Financials | 3.6% |
| Health Care | 2.8% |
| Consumer Discretionary | 1.7% |
| Energy | 1.5% |
| Industrials | 1.5% |
| Information Technology | 1.5% |
| Materials | 1.2% |
| Communication Services | 1.1% |
| Utilities | 0.9% |
| Index Options | 0.3% |
| Equity Warrants | 0.0% |
Composition including fixed income credit quality
| AAA | 1.7% |
| AA | 1.8% |
| A | 7.4% |
| BBB | 11.4% |
| BB | 14.9% |
| B | 10.9% |
| CCC | 4.0% |
| CC | 0.2% |
| C | 0.2% |
| U.S. Governments | 3.7% |
| Federal Agencies | 9.8% |
| Not Rated | 0.3% |
| Non-Fixed Income | 32.3% |
| Money Market Funds | 1.4% |
MFS uses the Global Industry Classification Standard (GICS®) for sector/industry reporting. MFS has applied its own internal sector/industry classification methodology for equity securities and non-equity securities that are unclassified by GICS.
Ratings are assigned using Moody’s, Fitch, and Standard & Poor’s and applying a hierarchy: If all 3 agencies rate a security, the middle rating is assigned; if 2 agencies rate a security, the lower rating is assigned. If none of the 3 agencies rate a security, we use DBRS Morningstar. If none of the 4 agencies rate a security, we use Kroll Bond Rating Agency. Ratings are shown in the S&P and Fitch scale (e.g., AAA). All ratings are subject to change.
The fund invests a portion of its assets in the MFS High Yield Pooled Portfolio. Percentages include the indirect exposure to the underlying holdings of the MFS High Yield Pooled Portfolio and not the direct exposure from investing in the MFS High Yield Pooled Portfolio itself.
~ The fund invests a portion of its assets in Exchange-Traded Funds (ETFs) or Options on ETFs to gain fixed income exposure. Percentages include the direct exposure from investing in ETFs or Options on ETFs and not the indirect exposure to the underlying holdings.
Ratings are assigned using Moody’s, Fitch, and Standard & Poor’s and applying a hierarchy: If all 3 agencies rate a security, the middle rating is assigned; if 2 agencies rate a security, the lower rating is assigned. If none of the 3 agencies rate a security, we use DBRS Morningstar. If none of the 4 agencies rate a security, we use Kroll Bond Rating Agency. Ratings are shown in the S&P and Fitch scale (e.g., AAA). All ratings are subject to change.
FUND EXPENSES
What were the fund costs for the last year?
| (based on a hypothetical $10,000 investment) | ||
| Class Name | Costs of a $10,000 investment ~ | Costs paid as a percentage of a $10,000 investment ~ |
| R4 | $67 | 0.64% |
˜ Expenses are direct expenses and do not include underlying fund fees and expenses.
MANAGEMENT'S DISCUSSION OF FUND PERFORMANCE
-
The MFS Diversified Income Fund (fund) includes investments in lower quality debt instruments, U.S. government securities, emerging market debt instruments, dividend-paying equity securities, and real estate-related instruments.
-
For the twelve months ended February 28, 2025, Class R4 shares of the fund provided a total return of 8.79%, at net asset value. This compares with a return of 18.41% for the fund’s benchmark, the Standard & Poor's 500 Stock Index. The fund’s other benchmark, the MFS Diversified Income Fund Blended Index (Blended Index), generated a return of 10.36%. The Blended Index reflects the blended returns of broad asset class indices, with percentage allocations to each index designed to resemble the broad asset class allocations of the fund. The market indices and related percentage allocations used to compile the Blended Index are set forth under Fund Performance.
-
Moderating inflation pressures allowed many global central banks to ease monetary policy during the period. However, the pace of disinflation slowed toward the end of the period, particularly in the US.
-
Geopolitical strains remained high amid ongoing conflicts in Ukraine and in the Middle East, while relations between China and the US remained tense, especially regarding trade. At the end of the period, China unveiled a sizable stimulus package aimed at shoring up its property sector and the finances of highly indebted local governments while the Trump administration threatened to impose considerable tariffs on its trading partners.
-
Global equity markets reached record levels late in the period as they withstood the adversity of the unsettled geopolitical climate and a higher interest rate environment but eased back from those highs as policy uncertainty rose. Healthy earnings growth continued though advances in artificial intelligence called into question, at least temporarily, the need for extraordinary levels of infrastructure investment to support the technology.
-
Global bond yields climbed off mid-period lows on the back of the US election results, resilient economic growth, concerns that global disinflationary progress may have stalled and a rising term premium. Reflecting increased inflation uncertainty, market expectations for future Federal Reserve interest rate cuts in 2025 were largely pared back while other major global central banks, notably the ECB, Bank of Canada and Bank of England, continued their gradual easing cycles. Already compressed credit spreads tightened further as corporate fundamentals remained sound. Bond market volatility, as measured by the Merrill Lynch Option Volatility Estimate (MOVE) index, declined in the fourth quarter after peaking before the US election, but climbed late February amongst heightened tariff uncertainty.
-
Top contributors to performance relative to the MFS Diversified Income Fund Blended Index:
-
Security selection within the emerging markets debt segment contributed to relative returns.
-
-
Top detractors from performance relative to the MFS Diversified Income Fund Blended Index:
-
Security selection and an underweight exposure to the REITS segment weighed on relative returns.
-
The fund's overweight allocation to the US government bond segment also weakened relative performance.
-
FUND PERFORMANCE
The fund’s past performance is not a good predictor of the fund’s future performance. The graph and table below do not reflect the deduction of taxes that a shareholder would pay on fund distributions or the redemption of fund shares. The graph and table below assume reinvestment of dividends and capital gain distributions.
Growth of a Hypothetical $10,000 Investment
This graph shows the performance of a hypothetical $10,000 investment in Class R4 over a ten year period or since inception, if shorter, in comparison to (i) a broad measure of market performance and (ii) an additional index that MFS believes more closely reflects the market segments in which the fund invests.
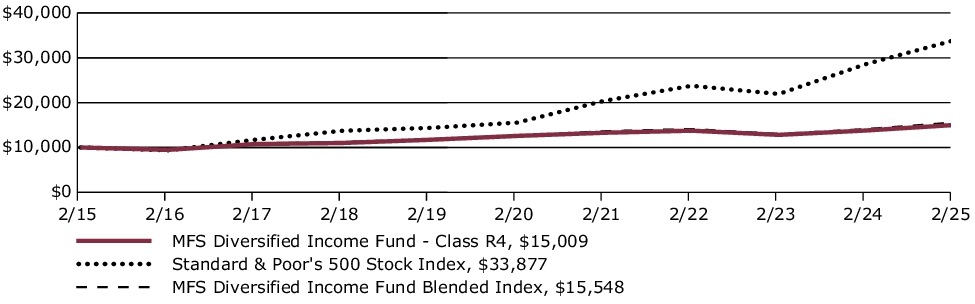
Average Annual Total Returns through 2/28/25
This table shows the average annual total returns of the class of shares noted for the periods shown, both with (if any) and without sales charges. It also shows the average annual total returns of (i) a broad measure of market performance and (ii) an additional index that MFS believes more closely reflects the market segments in which the fund invests, over the same periods.
| Share Class | 1-yr | 5-yr | 10-yr |
| R4 without sales charge | 8.79% | 3.59% | 4.14% |
| Comparative Benchmark(s) | |||
| Standard & Poor's 500 Stock Index ∆ | 18.41% | 16.85% | 12.98% |
| MFS Diversified Income Fund Blended Index ∆ | 10.36% | 4.21% | 4.51% |
|
∆ |
Source: FactSet Research Systems Inc. |
Visit mfs.com/perf/r4 for more recent performance information.
FUND STATISTICS AS OF 2/28/25
| Net Assets ($): | 2,013,925,358 | Total Management Fee ($)#: | 11,463,961 | |
| Total Number of Holdings: | 1,413 | Portfolio Turnover Rate (%): | 48 |
# Includes the effect of any management fee waivers, if applicable.
Where the fund holds derivatives, they are not included in the total number of portfolio holdings.
PORTFOLIO COMPOSITION (BASED ON TOTAL INVESTMENTS AS OF 2/28/25)
Portfolio structure
| Fixed Income ~ | 66.3% |
| Equities | 32.3% |
| Money Market Funds | 1.4% |
Equity sectors
| Real Estate | 12.6% |
| Consumer Staples | 3.6% |
| Financials | 3.6% |
| Health Care | 2.8% |
| Consumer Discretionary | 1.7% |
| Energy | 1.5% |
| Industrials | 1.5% |
| Information Technology | 1.5% |
| Materials | 1.2% |
| Communication Services | 1.1% |
| Utilities | 0.9% |
| Index Options | 0.3% |
| Equity Warrants | 0.0% |
Composition including fixed income credit quality
| AAA | 1.7% |
| AA | 1.8% |
| A | 7.4% |
| BBB | 11.4% |
| BB | 14.9% |
| B | 10.9% |
| CCC | 4.0% |
| CC | 0.2% |
| C | 0.2% |
| U.S. Governments | 3.7% |
| Federal Agencies | 9.8% |
| Not Rated | 0.3% |
| Non-Fixed Income | 32.3% |
| Money Market Funds | 1.4% |
MFS uses the Global Industry Classification Standard (GICS®) for sector/industry reporting. MFS has applied its own internal sector/industry classification methodology for equity securities and non-equity securities that are unclassified by GICS.
Ratings are assigned using Moody’s, Fitch, and Standard & Poor’s and applying a hierarchy: If all 3 agencies rate a security, the middle rating is assigned; if 2 agencies rate a security, the lower rating is assigned. If none of the 3 agencies rate a security, we use DBRS Morningstar. If none of the 4 agencies rate a security, we use Kroll Bond Rating Agency. Ratings are shown in the S&P and Fitch scale (e.g., AAA). All ratings are subject to change.
The fund invests a portion of its assets in the MFS High Yield Pooled Portfolio. Percentages include the indirect exposure to the underlying holdings of the MFS High Yield Pooled Portfolio and not the direct exposure from investing in the MFS High Yield Pooled Portfolio itself.
~ The fund invests a portion of its assets in Exchange-Traded Funds (ETFs) or Options on ETFs to gain fixed income exposure. Percentages include the direct exposure from investing in ETFs or Options on ETFs and not the indirect exposure to the underlying holdings.
Ratings are assigned using Moody’s, Fitch, and Standard & Poor’s and applying a hierarchy: If all 3 agencies rate a security, the middle rating is assigned; if 2 agencies rate a security, the lower rating is assigned. If none of the 3 agencies rate a security, we use DBRS Morningstar. If none of the 4 agencies rate a security, we use Kroll Bond Rating Agency. Ratings are shown in the S&P and Fitch scale (e.g., AAA). All ratings are subject to change.
FUND EXPENSES
What were the fund costs for the last year?
| (based on a hypothetical $10,000 investment) | ||
| Class Name | Costs of a $10,000 investment ~ | Costs paid as a percentage of a $10,000 investment ~ |
| R6 | $57 | 0.55% |
˜ Expenses are direct expenses and do not include underlying fund fees and expenses.
MANAGEMENT'S DISCUSSION OF FUND PERFORMANCE
-
The MFS Diversified Income Fund (fund) includes investments in lower quality debt instruments, U.S. government securities, emerging market debt instruments, dividend-paying equity securities, and real estate-related instruments.
-
For the twelve months ended February 28, 2025, Class R6 shares of the fund provided a total return of 8.88%, at net asset value. This compares with a return of 18.41% for the fund’s benchmark, the Standard & Poor's 500 Stock Index. The fund’s other benchmark, the MFS Diversified Income Fund Blended Index (Blended Index), generated a return of 10.36%. The Blended Index reflects the blended returns of broad asset class indices, with percentage allocations to each index designed to resemble the broad asset class allocations of the fund. The market indices and related percentage allocations used to compile the Blended Index are set forth under Fund Performance.
-
Moderating inflation pressures allowed many global central banks to ease monetary policy during the period. However, the pace of disinflation slowed toward the end of the period, particularly in the US.
-
Geopolitical strains remained high amid ongoing conflicts in Ukraine and in the Middle East, while relations between China and the US remained tense, especially regarding trade. At the end of the period, China unveiled a sizable stimulus package aimed at shoring up its property sector and the finances of highly indebted local governments while the Trump administration threatened to impose considerable tariffs on its trading partners.
-
Global equity markets reached record levels late in the period as they withstood the adversity of the unsettled geopolitical climate and a higher interest rate environment but eased back from those highs as policy uncertainty rose. Healthy earnings growth continued though advances in artificial intelligence called into question, at least temporarily, the need for extraordinary levels of infrastructure investment to support the technology.
-
Global bond yields climbed off mid-period lows on the back of the US election results, resilient economic growth, concerns that global disinflationary progress may have stalled and a rising term premium. Reflecting increased inflation uncertainty, market expectations for future Federal Reserve interest rate cuts in 2025 were largely pared back while other major global central banks, notably the ECB, Bank of Canada and Bank of England, continued their gradual easing cycles. Already compressed credit spreads tightened further as corporate fundamentals remained sound. Bond market volatility, as measured by the Merrill Lynch Option Volatility Estimate (MOVE) index, declined in the fourth quarter after peaking before the US election, but climbed late February amongst heightened tariff uncertainty.
-
Top contributors to performance relative to the MFS Diversified Income Fund Blended Index:
-
Security selection within the emerging markets debt segment contributed to relative returns.
-
-
Top detractors from performance relative to the MFS Diversified Income Fund Blended Index:
-
Security selection and an underweight exposure to the REITS segment weighed on relative returns.
-
The fund's overweight allocation to the US government bond segment also weakened relative performance.
-
FUND PERFORMANCE
The fund’s past performance is not a good predictor of the fund’s future performance. The graph and table below do not reflect the deduction of taxes that a shareholder would pay on fund distributions or the redemption of fund shares. The graph and table below assume reinvestment of dividends and capital gain distributions.
Growth of a Hypothetical $10,000 Investment
This graph shows the performance of a hypothetical $10,000 investment in Class R6 over a ten year period or since inception, if shorter, in comparison to (i) a broad measure of market performance and (ii) an additional index that MFS believes more closely reflects the market segments in which the fund invests.
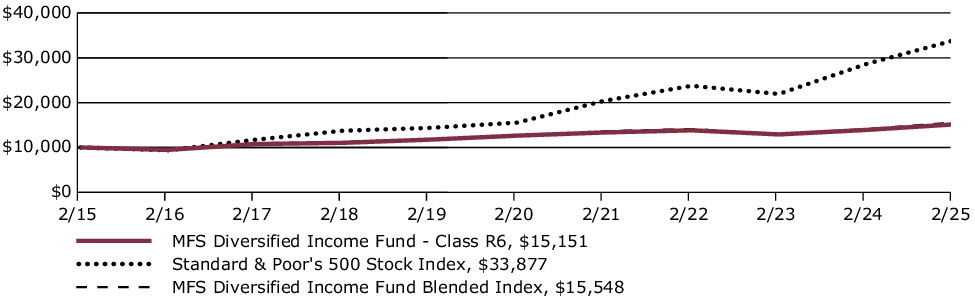
Average Annual Total Returns through 2/28/25
This table shows the average annual total returns of the class of shares noted for the periods shown, both with (if any) and without sales charges. It also shows the average annual total returns of (i) a broad measure of market performance and (ii) an additional index that MFS believes more closely reflects the market segments in which the fund invests, over the same periods.
| Share Class | 1-yr | 5-yr | 10-yr |
| R6 without sales charge | 8.88% | 3.69% | 4.24% |
| Comparative Benchmark(s) | |||
| Standard & Poor's 500 Stock Index ∆ | 18.41% | 16.85% | 12.98% |
| MFS Diversified Income Fund Blended Index ∆ | 10.36% | 4.21% | 4.51% |
|
∆ |
Source: FactSet Research Systems Inc. |
Visit mfs.com/perf/r6 for more recent performance information.
FUND STATISTICS AS OF 2/28/25
| Net Assets ($): | 2,013,925,358 | Total Management Fee ($)#: | 11,463,961 | |
| Total Number of Holdings: | 1,413 | Portfolio Turnover Rate (%): | 48 |
# Includes the effect of any management fee waivers, if applicable.
Where the fund holds derivatives, they are not included in the total number of portfolio holdings.
PORTFOLIO COMPOSITION (BASED ON TOTAL INVESTMENTS AS OF 2/28/25)
Portfolio structure
| Fixed Income ~ | 66.3% |
| Equities | 32.3% |
| Money Market Funds | 1.4% |
Equity sectors
| Real Estate | 12.6% |
| Consumer Staples | 3.6% |
| Financials | 3.6% |
| Health Care | 2.8% |
| Consumer Discretionary | 1.7% |
| Energy | 1.5% |
| Industrials | 1.5% |
| Information Technology | 1.5% |
| Materials | 1.2% |
| Communication Services | 1.1% |
| Utilities | 0.9% |
| Index Options | 0.3% |
| Equity Warrants | 0.0% |
Composition including fixed income credit quality
| AAA | 1.7% |
| AA | 1.8% |
| A | 7.4% |
| BBB | 11.4% |
| BB | 14.9% |
| B | 10.9% |
| CCC | 4.0% |
| CC | 0.2% |
| C | 0.2% |
| U.S. Governments | 3.7% |
| Federal Agencies | 9.8% |
| Not Rated | 0.3% |
| Non-Fixed Income | 32.3% |
| Money Market Funds | 1.4% |
MFS uses the Global Industry Classification Standard (GICS®) for sector/industry reporting. MFS has applied its own internal sector/industry classification methodology for equity securities and non-equity securities that are unclassified by GICS.
Ratings are assigned using Moody’s, Fitch, and Standard & Poor’s and applying a hierarchy: If all 3 agencies rate a security, the middle rating is assigned; if 2 agencies rate a security, the lower rating is assigned. If none of the 3 agencies rate a security, we use DBRS Morningstar. If none of the 4 agencies rate a security, we use Kroll Bond Rating Agency. Ratings are shown in the S&P and Fitch scale (e.g., AAA). All ratings are subject to change.
The fund invests a portion of its assets in the MFS High Yield Pooled Portfolio. Percentages include the indirect exposure to the underlying holdings of the MFS High Yield Pooled Portfolio and not the direct exposure from investing in the MFS High Yield Pooled Portfolio itself.
~ The fund invests a portion of its assets in Exchange-Traded Funds (ETFs) or Options on ETFs to gain fixed income exposure. Percentages include the direct exposure from investing in ETFs or Options on ETFs and not the indirect exposure to the underlying holdings.
Ratings are assigned using Moody’s, Fitch, and Standard & Poor’s and applying a hierarchy: If all 3 agencies rate a security, the middle rating is assigned; if 2 agencies rate a security, the lower rating is assigned. If none of the 3 agencies rate a security, we use DBRS Morningstar. If none of the 4 agencies rate a security, we use Kroll Bond Rating Agency. Ratings are shown in the S&P and Fitch scale (e.g., AAA). All ratings are subject to change.
FUND EXPENSES
What were the fund costs for the last year?
| (based on a hypothetical $10,000 investment) | ||
| Class Name | Costs of a $10,000 investment | Costs paid as a percentage of a $10,000 investment |
| A | $125 | 1.19% |
MANAGEMENT'S DISCUSSION OF FUND PERFORMANCE
-
For the twelve months ended February 28, 2025, Class A shares of the MFS New Discovery Value Fund (fund) provided a total return of 9.88%, at net asset value. This compares with a return of 17.53% for the fund’s benchmark, the Russell 3000® Index. The fund's other benchmark, the Russell 2000® Value Index, generated a return of 7.58%.
-
Moderating inflation pressures allowed many global central banks to ease monetary policy during the period. However, the pace of disinflation slowed toward the end of the period, particularly in the US.
-
Geopolitical strains remained high amid ongoing conflicts in Ukraine and in the Middle East, while relations between China and the US remained tense, especially regarding trade. At the end of the period, China unveiled a sizable stimulus package aimed at shoring up its property sector and the finances of highly indebted local governments while the Trump administration threatened to impose considerable tariffs on its trading partners.
-
Global equity markets reached record levels late in the period as they withstood the adversity of the unsettled geopolitical climate and a higher interest rate environment but eased back from those highs as policy uncertainty rose. Healthy earnings growth continued though advances in artificial intelligence called into question, at least temporarily, the need for extraordinary levels of infrastructure investment to support the technology.
-
Global bond yields climbed off mid-period lows on the back of the US election results, resilient economic growth, concerns that global disinflationary progress may have stalled and a rising term premium. Reflecting increased inflation uncertainty, market expectations for future Federal Reserve interest rate cuts in 2025 were largely pared back while other major global central banks, notably the ECB, Bank of Canada and Bank of England, continued their gradual easing cycles. Already compressed credit spreads tightened further as corporate fundamentals remained sound. Bond market volatility, as measured by the Merrill Lynch Option Volatility Estimate (MOVE) index, declined in the fourth quarter after peaking before the US election, but climbed late February amongst heightened tariff uncertainty.
-
Top contributors to performance relative to the Russell 2000® Value Index:
-
Security selection within the energy sector strengthened relative performance.
-
The combination of an underweight position and stock selection within the health care sector further supported relative returns.
-
-
Top detractors from performance relative to the Russell 2000® Value Index:
-
Stock selection within both the consumer discretionary and consumer staples sectors held back relative results.
-
The fund's underweight allocation to the financials sector also weakened relative performance.
-
FUND PERFORMANCE
The fund’s past performance is not a good predictor of the fund’s future performance. The graph and table below do not reflect the deduction of taxes that a shareholder would pay on fund distributions or the redemption of fund shares. The graph and table below assume reinvestment of dividends and capital gain distributions.
Growth of a Hypothetical $10,000 Investment
This graph shows the performance of a hypothetical $10,000 investment in Class A over a ten year period or since inception, if shorter, in comparison to (i) a broad measure of market performance and (ii) an additional index that MFS believes more closely reflects the market segments in which the fund invests. This graph includes the deduction of the maximum applicable sales charge.
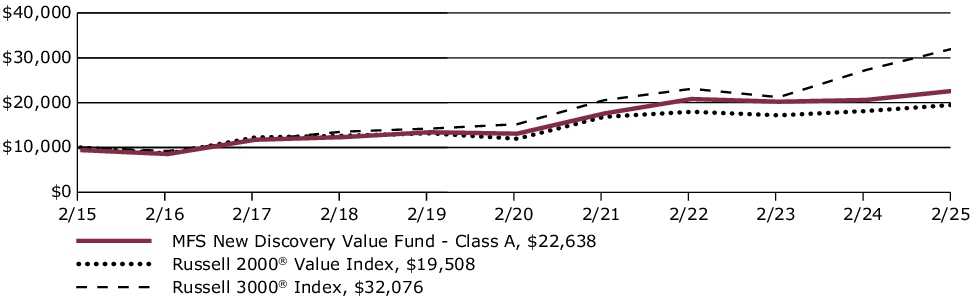
Average Annual Total Returns through 2/28/25
This table shows the average annual total returns of the class of shares noted for the periods shown, both with (if any) and without sales charges. It also shows the average annual total returns of (i) a broad measure of market performance and (ii) an additional index that MFS believes more closely reflects the market segments in which the fund invests, over the same periods.
| Share Class | 1-yr | 5-yr | 10-yr |
| A without sales charge | 9.88% | 11.60% | 9.16% |
| A with initial sales charge (5.75%) | 3.56% | 10.29% | 8.51% |
| Comparative Benchmark(s) | |||
| Russell 3000® Index +∆ | 17.53% | 16.12% | 12.36% |
| Russell 2000® Value Index +∆ | 7.58% | 10.32% | 6.91% |
|
+ |
Effective May 1, 2024, the Russell 3000® Index replaced the Russell 2000® Value Index as a broad measure of market performance in accordance with new regulatory disclosure requirements. The fund continues to use the Russell 2000® Value Index as an additional benchmark that MFS believes more closely reflects the market segments in which the fund invests. |
|
∆ |
Source: FactSet Research Systems Inc. |
Visit mfs.com/perf/a for more recent performance information.
FUND STATISTICS AS OF 2/28/25
| Net Assets ($): | 3,218,294,128 | Total Management Fee ($)#: | 27,425,701 | |
| Total Number of Holdings: | 129 | Portfolio Turnover Rate (%): | 34 |
# Includes the effect of any management fee waivers, if applicable.
Where the fund holds derivatives, they are not included in the total number of portfolio holdings.
PORTFOLIO COMPOSITION (BASED ON TOTAL INVESTMENTS AS OF 2/28/25)
Portfolio structure
| Equities | 97.7% |
| Money Market Funds | 2.3% |
Equity sectors
| Financials | 27.3% |
| Industrials | 14.6% |
| Consumer Discretionary | 10.2% |
| Real Estate | 9.0% |
| Materials | 8.4% |
| Information Technology | 6.8% |
| Energy | 6.5% |
| Utilities | 6.4% |
| Health Care | 5.4% |
| Consumer Staples | 2.2% |
| Communication Services | 0.9% |
Top ten holdings
| Prosperity Bancshares, Inc. | 1.5% |
| Portland General Electric Co. | 1.4% |
| SLM Corp. | 1.3% |
| Pacific Premier Bancorp, Inc. | 1.3% |
| Hanover Insurance Group, Inc. | 1.3% |
| Plains GP Holdings LP | 1.3% |
| Columbia Banking System, Inc. | 1.3% |
| First Hawaiian, Inc. | 1.2% |
| Popular, Inc. | 1.2% |
| Prestige Consumer Healthcare, Inc. | 1.2% |
MFS uses the Global Industry Classification Standard (GICS®) for sector/industry reporting. MFS has applied its own internal sector/industry classification methodology for equity securities and non-equity securities that are unclassified by GICS.
Top ten holdings
| Prosperity Bancshares, Inc. | 1.5% |
| Portland General Electric Co. | 1.4% |
| SLM Corp. | 1.3% |
| Pacific Premier Bancorp, Inc. | 1.3% |
| Hanover Insurance Group, Inc. | 1.3% |
| Plains GP Holdings LP | 1.3% |
| Columbia Banking System, Inc. | 1.3% |
| First Hawaiian, Inc. | 1.2% |
| Popular, Inc. | 1.2% |
| Prestige Consumer Healthcare, Inc. | 1.2% |
FUND EXPENSES
What were the fund costs for the last year?
| (based on a hypothetical $10,000 investment) | ||
| Class Name | Costs of a $10,000 investment | Costs paid as a percentage of a $10,000 investment |
| B | $203 | 1.94% |
MANAGEMENT'S DISCUSSION OF FUND PERFORMANCE
-
For the twelve months ended February 28, 2025, Class B shares of the MFS New Discovery Value Fund (fund) provided a total return of 9.04%, at net asset value. This compares with a return of 17.53% for the fund’s benchmark, the Russell 3000® Index. The fund's other benchmark, the Russell 2000® Value Index, generated a return of 7.58%.
-
Moderating inflation pressures allowed many global central banks to ease monetary policy during the period. However, the pace of disinflation slowed toward the end of the period, particularly in the US.
-
Geopolitical strains remained high amid ongoing conflicts in Ukraine and in the Middle East, while relations between China and the US remained tense, especially regarding trade. At the end of the period, China unveiled a sizable stimulus package aimed at shoring up its property sector and the finances of highly indebted local governments while the Trump administration threatened to impose considerable tariffs on its trading partners.
-
Global equity markets reached record levels late in the period as they withstood the adversity of the unsettled geopolitical climate and a higher interest rate environment but eased back from those highs as policy uncertainty rose. Healthy earnings growth continued though advances in artificial intelligence called into question, at least temporarily, the need for extraordinary levels of infrastructure investment to support the technology.
-
Global bond yields climbed off mid-period lows on the back of the US election results, resilient economic growth, concerns that global disinflationary progress may have stalled and a rising term premium. Reflecting increased inflation uncertainty, market expectations for future Federal Reserve interest rate cuts in 2025 were largely pared back while other major global central banks, notably the ECB, Bank of Canada and Bank of England, continued their gradual easing cycles. Already compressed credit spreads tightened further as corporate fundamentals remained sound. Bond market volatility, as measured by the Merrill Lynch Option Volatility Estimate (MOVE) index, declined in the fourth quarter after peaking before the US election, but climbed late February amongst heightened tariff uncertainty.
-
Top contributors to performance relative to the Russell 2000® Value Index:
-
Security selection within the energy sector strengthened relative performance.
-
The combination of an underweight position and stock selection within the health care sector further supported relative returns.
-
-
Top detractors from performance relative to the Russell 2000® Value Index:
-
Stock selection within both the consumer discretionary and consumer staples sectors held back relative results.
-
The fund's underweight allocation to the financials sector also weakened relative performance.
-
FUND PERFORMANCE
The fund’s past performance is not a good predictor of the fund’s future performance. The graph and table below do not reflect the deduction of taxes that a shareholder would pay on fund distributions or the redemption of fund shares. The graph and table below assume reinvestment of dividends and capital gain distributions.
Growth of a Hypothetical $10,000 Investment
This graph shows the performance of a hypothetical $10,000 investment in Class B over a ten year period or since inception, if shorter, in comparison to (i) a broad measure of market performance and (ii) an additional index that MFS believes more closely reflects the market segments in which the fund invests.

Average Annual Total Returns through 2/28/25
This table shows the average annual total returns of the class of shares noted for the periods shown, both with (if any) and without sales charges. It also shows the average annual total returns of (i) a broad measure of market performance and (ii) an additional index that MFS believes more closely reflects the market segments in which the fund invests, over the same periods.
| Share Class | 1-yr | 5-yr | 10-yr |
| B without sales charge | 9.04% | 10.77% | 8.34% |
| B with CDSC (declining over six years from 4% to 0%)× | 5.04% | 10.50% | 8.34% |
| Comparative Benchmark(s) | |||
| Russell 3000® Index +∆ | 17.53% | 16.12% | 12.36% |
| Russell 2000® Value Index +∆ | 7.58% | 10.32% | 6.91% |
|
+
|
Effective May 1, 2024, the Russell 3000® Index replaced the Russell 2000® Value Index as a broad measure of market performance in accordance with new regulatory disclosure requirements. The fund continues to use the Russell 2000® Value Index as an additional benchmark that MFS believes more closely reflects the market segments in which the fund invests.
|
|
∆
|
Source: FactSet Research Systems Inc.
|
|
×
|
Assuming redemption at the end of the applicable period.
|
Visit mfs.com/perf/b for more recent performance information.
FUND STATISTICS AS OF 2/28/25
| Net Assets ($): | 3,218,294,128 | Total Management Fee ($)#: | 27,425,701 | |
| Total Number of Holdings: | 129 | Portfolio Turnover Rate (%): | 34 |
# Includes the effect of any management fee waivers, if applicable.
Where the fund holds derivatives, they are not included in the total number of portfolio holdings.
PORTFOLIO COMPOSITION (BASED ON TOTAL INVESTMENTS AS OF 2/28/25)
Portfolio structure
| Equities | 97.7% |
| Money Market Funds | 2.3% |
Equity sectors
| Financials | 27.3% |
| Industrials | 14.6% |
| Consumer Discretionary | 10.2% |
| Real Estate | 9.0% |
| Materials | 8.4% |
| Information Technology | 6.8% |
| Energy | 6.5% |
| Utilities | 6.4% |
| Health Care | 5.4% |
| Consumer Staples | 2.2% |
| Communication Services | 0.9% |
Top ten holdings
| Prosperity Bancshares, Inc. | 1.5% |
| Portland General Electric Co. | 1.4% |
| SLM Corp. | 1.3% |
| Pacific Premier Bancorp, Inc. | 1.3% |
| Hanover Insurance Group, Inc. | 1.3% |
| Plains GP Holdings LP | 1.3% |
| Columbia Banking System, Inc. | 1.3% |
| First Hawaiian, Inc. | 1.2% |
| Popular, Inc. | 1.2% |
| Prestige Consumer Healthcare, Inc. | 1.2% |
MFS uses the Global Industry Classification Standard (GICS®) for sector/industry reporting. MFS has applied its own internal sector/industry classification methodology for equity securities and non-equity securities that are unclassified by GICS.
Top ten holdings
| Prosperity Bancshares, Inc. | 1.5% |
| Portland General Electric Co. | 1.4% |
| SLM Corp. | 1.3% |
| Pacific Premier Bancorp, Inc. | 1.3% |
| Hanover Insurance Group, Inc. | 1.3% |
| Plains GP Holdings LP | 1.3% |
| Columbia Banking System, Inc. | 1.3% |
| First Hawaiian, Inc. | 1.2% |
| Popular, Inc. | 1.2% |
| Prestige Consumer Healthcare, Inc. | 1.2% |
FUND EXPENSES
What were the fund costs for the last year?
| (based on a hypothetical $10,000 investment) | ||
| Class Name | Costs of a $10,000 investment | Costs paid as a percentage of a $10,000 investment |
| C | $203 | 1.94% |
MANAGEMENT'S DISCUSSION OF FUND PERFORMANCE
-
For the twelve months ended February 28, 2025, Class C shares of the MFS New Discovery Value Fund (fund) provided a total return of 9.06%, at net asset value. This compares with a return of 17.53% for the fund’s benchmark, the Russell 3000® Index. The fund's other benchmark, the Russell 2000® Value Index, generated a return of 7.58%.
-
Moderating inflation pressures allowed many global central banks to ease monetary policy during the period. However, the pace of disinflation slowed toward the end of the period, particularly in the US.
-
Geopolitical strains remained high amid ongoing conflicts in Ukraine and in the Middle East, while relations between China and the US remained tense, especially regarding trade. At the end of the period, China unveiled a sizable stimulus package aimed at shoring up its property sector and the finances of highly indebted local governments while the Trump administration threatened to impose considerable tariffs on its trading partners.
-
Global equity markets reached record levels late in the period as they withstood the adversity of the unsettled geopolitical climate and a higher interest rate environment but eased back from those highs as policy uncertainty rose. Healthy earnings growth continued though advances in artificial intelligence called into question, at least temporarily, the need for extraordinary levels of infrastructure investment to support the technology.
-
Global bond yields climbed off mid-period lows on the back of the US election results, resilient economic growth, concerns that global disinflationary progress may have stalled and a rising term premium. Reflecting increased inflation uncertainty, market expectations for future Federal Reserve interest rate cuts in 2025 were largely pared back while other major global central banks, notably the ECB, Bank of Canada and Bank of England, continued their gradual easing cycles. Already compressed credit spreads tightened further as corporate fundamentals remained sound. Bond market volatility, as measured by the Merrill Lynch Option Volatility Estimate (MOVE) index, declined in the fourth quarter after peaking before the US election, but climbed late February amongst heightened tariff uncertainty.
-
Top contributors to performance relative to the Russell 2000® Value Index:
-
Security selection within the energy sector strengthened relative performance.
-
The combination of an underweight position and stock selection within the health care sector further supported relative returns.
-
-
Top detractors from performance relative to the Russell 2000® Value Index:
-
Stock selection within both the consumer discretionary and consumer staples sectors held back relative results.
-
The fund's underweight allocation to the financials sector also weakened relative performance.
-
FUND PERFORMANCE
The fund’s past performance is not a good predictor of the fund’s future performance. The graph and table below do not reflect the deduction of taxes that a shareholder would pay on fund distributions or the redemption of fund shares. The graph and table below assume reinvestment of dividends and capital gain distributions.
Growth of a Hypothetical $10,000 Investment
This graph shows the performance of a hypothetical $10,000 investment in Class C over a ten year period or since inception, if shorter, in comparison to (i) a broad measure of market performance and (ii) an additional index that MFS believes more closely reflects the market segments in which the fund invests.
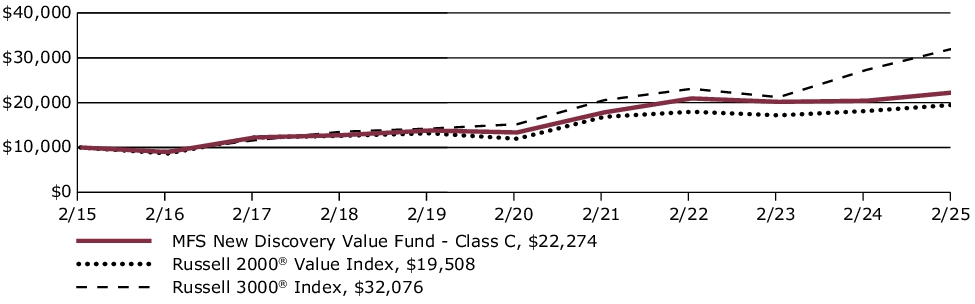
Average Annual Total Returns through 2/28/25
This table shows the average annual total returns of the class of shares noted for the periods shown, both with (if any) and without sales charges. It also shows the average annual total returns of (i) a broad measure of market performance and (ii) an additional index that MFS believes more closely reflects the market segments in which the fund invests, over the same periods.
| Share Class | 1-yr | 5-yr | 10-yr |
| C without sales charge | 9.06% | 10.77% | 8.34% |
| C with CDSC (1% for 12 months)× | 8.06% | 10.77% | 8.34% |
| Comparative Benchmark(s) | |||
| Russell 3000® Index +∆ | 17.53% | 16.12% | 12.36% |
| Russell 2000® Value Index +∆ | 7.58% | 10.32% | 6.91% |
|
+
|
Effective May 1, 2024, the Russell 3000® Index replaced the Russell 2000® Value Index as a broad measure of market performance in accordance with new regulatory disclosure requirements. The fund continues to use the Russell 2000® Value Index as an additional benchmark that MFS believes more closely reflects the market segments in which the fund invests.
|
|
∆
|
Source: FactSet Research Systems Inc.
|
|
×
|
Assuming redemption at the end of the applicable period.
|
Visit mfs.com/perf/c for more recent performance information.
FUND STATISTICS AS OF 2/28/25
| Net Assets ($): | 3,218,294,128 | Total Management Fee ($)#: | 27,425,701 | |
| Total Number of Holdings: | 129 | Portfolio Turnover Rate (%): | 34 |
# Includes the effect of any management fee waivers, if applicable.
Where the fund holds derivatives, they are not included in the total number of portfolio holdings.
PORTFOLIO COMPOSITION (BASED ON TOTAL INVESTMENTS AS OF 2/28/25)
Portfolio structure
| Equities | 97.7% |
| Money Market Funds | 2.3% |
Equity sectors
| Financials | 27.3% |
| Industrials | 14.6% |
| Consumer Discretionary | 10.2% |
| Real Estate | 9.0% |
| Materials | 8.4% |
| Information Technology | 6.8% |
| Energy | 6.5% |
| Utilities | 6.4% |
| Health Care | 5.4% |
| Consumer Staples | 2.2% |
| Communication Services | 0.9% |
Top ten holdings
| Prosperity Bancshares, Inc. | 1.5% |
| Portland General Electric Co. | 1.4% |
| SLM Corp. | 1.3% |
| Pacific Premier Bancorp, Inc. | 1.3% |
| Hanover Insurance Group, Inc. | 1.3% |
| Plains GP Holdings LP | 1.3% |
| Columbia Banking System, Inc. | 1.3% |
| First Hawaiian, Inc. | 1.2% |
| Popular, Inc. | 1.2% |
| Prestige Consumer Healthcare, Inc. | 1.2% |
MFS uses the Global Industry Classification Standard (GICS®) for sector/industry reporting. MFS has applied its own internal sector/industry classification methodology for equity securities and non-equity securities that are unclassified by GICS.
Top ten holdings
| Prosperity Bancshares, Inc. | 1.5% |
| Portland General Electric Co. | 1.4% |
| SLM Corp. | 1.3% |
| Pacific Premier Bancorp, Inc. | 1.3% |
| Hanover Insurance Group, Inc. | 1.3% |
| Plains GP Holdings LP | 1.3% |
| Columbia Banking System, Inc. | 1.3% |
| First Hawaiian, Inc. | 1.2% |
| Popular, Inc. | 1.2% |
| Prestige Consumer Healthcare, Inc. | 1.2% |
FUND EXPENSES
What were the fund costs for the last year?
| (based on a hypothetical $10,000 investment) | ||
| Class Name | Costs of a $10,000 investment | Costs paid as a percentage of a $10,000 investment |
| I | $99 | 0.94% |
MANAGEMENT'S DISCUSSION OF FUND PERFORMANCE
-
For the twelve months ended February 28, 2025, Class I shares of the MFS New Discovery Value Fund (fund) provided a total return of 10.15%, at net asset value. This compares with a return of 17.53% for the fund’s benchmark, the Russell 3000® Index. The fund's other benchmark, the Russell 2000® Value Index, generated a return of 7.58%.
-
Moderating inflation pressures allowed many global central banks to ease monetary policy during the period. However, the pace of disinflation slowed toward the end of the period, particularly in the US.
-
Geopolitical strains remained high amid ongoing conflicts in Ukraine and in the Middle East, while relations between China and the US remained tense, especially regarding trade. At the end of the period, China unveiled a sizable stimulus package aimed at shoring up its property sector and the finances of highly indebted local governments while the Trump administration threatened to impose considerable tariffs on its trading partners.
-
Global equity markets reached record levels late in the period as they withstood the adversity of the unsettled geopolitical climate and a higher interest rate environment but eased back from those highs as policy uncertainty rose. Healthy earnings growth continued though advances in artificial intelligence called into question, at least temporarily, the need for extraordinary levels of infrastructure investment to support the technology.
-
Global bond yields climbed off mid-period lows on the back of the US election results, resilient economic growth, concerns that global disinflationary progress may have stalled and a rising term premium. Reflecting increased inflation uncertainty, market expectations for future Federal Reserve interest rate cuts in 2025 were largely pared back while other major global central banks, notably the ECB, Bank of Canada and Bank of England, continued their gradual easing cycles. Already compressed credit spreads tightened further as corporate fundamentals remained sound. Bond market volatility, as measured by the Merrill Lynch Option Volatility Estimate (MOVE) index, declined in the fourth quarter after peaking before the US election, but climbed late February amongst heightened tariff uncertainty.
-
Top contributors to performance relative to the Russell 2000® Value Index:
-
Security selection within the energy sector strengthened relative performance.
-
The combination of an underweight position and stock selection within the health care sector further supported relative returns.
-
-
Top detractors from performance relative to the Russell 2000® Value Index:
-
Stock selection within both the consumer discretionary and consumer staples sectors held back relative results.
-
The fund's underweight allocation to the financials sector also weakened relative performance.
-
FUND PERFORMANCE
The fund’s past performance is not a good predictor of the fund’s future performance. The graph and table below do not reflect the deduction of taxes that a shareholder would pay on fund distributions or the redemption of fund shares. The graph and table below assume reinvestment of dividends and capital gain distributions.
Growth of a Hypothetical $10,000 Investment
This graph shows the performance of a hypothetical $10,000 investment in Class I over a ten year period or since inception, if shorter, in comparison to (i) a broad measure of market performance and (ii) an additional index that MFS believes more closely reflects the market segments in which the fund invests.
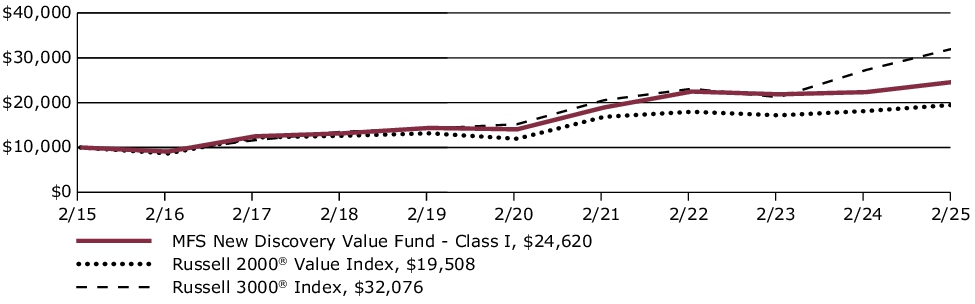
Average Annual Total Returns through 2/28/25
This table shows the average annual total returns of the class of shares noted for the periods shown, both with (if any) and without sales charges. It also shows the average annual total returns of (i) a broad measure of market performance and (ii) an additional index that MFS believes more closely reflects the market segments in which the fund invests, over the same periods.
| Share Class | 1-yr | 5-yr | 10-yr |
| I without sales charge | 10.15% | 11.88% | 9.43% |
| Comparative Benchmark(s) | |||
| Russell 3000® Index +∆ | 17.53% | 16.12% | 12.36% |
| Russell 2000® Value Index +∆ | 7.58% | 10.32% | 6.91% |
|
+ |
Effective May 1, 2024, the Russell 3000® Index replaced the Russell 2000® Value Index as a broad measure of market performance in accordance with new regulatory disclosure requirements. The fund continues to use the Russell 2000® Value Index as an additional benchmark that MFS believes more closely reflects the market segments in which the fund invests. |
|
∆ |
Source: FactSet Research Systems Inc. |
Visit mfs.com/perf/i for more recent performance information.
FUND STATISTICS AS OF 2/28/25
| Net Assets ($): | 3,218,294,128 | Total Management Fee ($)#: | 27,425,701 | |
| Total Number of Holdings: | 129 | Portfolio Turnover Rate (%): | 34 |
# Includes the effect of any management fee waivers, if applicable.
Where the fund holds derivatives, they are not included in the total number of portfolio holdings.
PORTFOLIO COMPOSITION (BASED ON TOTAL INVESTMENTS AS OF 2/28/25)
Portfolio structure
| Equities | 97.7% |
| Money Market Funds | 2.3% |
Equity sectors
| Financials | 27.3% |
| Industrials | 14.6% |
| Consumer Discretionary | 10.2% |
| Real Estate | 9.0% |
| Materials | 8.4% |
| Information Technology | 6.8% |
| Energy | 6.5% |
| Utilities | 6.4% |
| Health Care | 5.4% |
| Consumer Staples | 2.2% |
| Communication Services | 0.9% |
Top ten holdings
| Prosperity Bancshares, Inc. | 1.5% |
| Portland General Electric Co. | 1.4% |
| SLM Corp. | 1.3% |
| Pacific Premier Bancorp, Inc. | 1.3% |
| Hanover Insurance Group, Inc. | 1.3% |
| Plains GP Holdings LP | 1.3% |
| Columbia Banking System, Inc. | 1.3% |
| First Hawaiian, Inc. | 1.2% |
| Popular, Inc. | 1.2% |
| Prestige Consumer Healthcare, Inc. | 1.2% |
MFS uses the Global Industry Classification Standard (GICS®) for sector/industry reporting. MFS has applied its own internal sector/industry classification methodology for equity securities and non-equity securities that are unclassified by GICS.
Top ten holdings
| Prosperity Bancshares, Inc. | 1.5% |
| Portland General Electric Co. | 1.4% |
| SLM Corp. | 1.3% |
| Pacific Premier Bancorp, Inc. | 1.3% |
| Hanover Insurance Group, Inc. | 1.3% |
| Plains GP Holdings LP | 1.3% |
| Columbia Banking System, Inc. | 1.3% |
| First Hawaiian, Inc. | 1.2% |
| Popular, Inc. | 1.2% |
| Prestige Consumer Healthcare, Inc. | 1.2% |
FUND EXPENSES
What were the fund costs for the last year?
| (based on a hypothetical $10,000 investment) | ||
| Class Name | Costs of a $10,000 investment | Costs paid as a percentage of a $10,000 investment |
| R1 | $204 | 1.95% |
MANAGEMENT'S DISCUSSION OF FUND PERFORMANCE
-
For the twelve months ended February 28, 2025, Class R1 shares of the MFS New Discovery Value Fund (fund) provided a total return of 9.09%, at net asset value. This compares with a return of 17.53% for the fund’s benchmark, the Russell 3000® Index. The fund's other benchmark, the Russell 2000® Value Index, generated a return of 7.58%.
-
Moderating inflation pressures allowed many global central banks to ease monetary policy during the period. However, the pace of disinflation slowed toward the end of the period, particularly in the US.
-
Geopolitical strains remained high amid ongoing conflicts in Ukraine and in the Middle East, while relations between China and the US remained tense, especially regarding trade. At the end of the period, China unveiled a sizable stimulus package aimed at shoring up its property sector and the finances of highly indebted local governments while the Trump administration threatened to impose considerable tariffs on its trading partners.
-
Global equity markets reached record levels late in the period as they withstood the adversity of the unsettled geopolitical climate and a higher interest rate environment but eased back from those highs as policy uncertainty rose. Healthy earnings growth continued though advances in artificial intelligence called into question, at least temporarily, the need for extraordinary levels of infrastructure investment to support the technology.
-
Global bond yields climbed off mid-period lows on the back of the US election results, resilient economic growth, concerns that global disinflationary progress may have stalled and a rising term premium. Reflecting increased inflation uncertainty, market expectations for future Federal Reserve interest rate cuts in 2025 were largely pared back while other major global central banks, notably the ECB, Bank of Canada and Bank of England, continued their gradual easing cycles. Already compressed credit spreads tightened further as corporate fundamentals remained sound. Bond market volatility, as measured by the Merrill Lynch Option Volatility Estimate (MOVE) index, declined in the fourth quarter after peaking before the US election, but climbed late February amongst heightened tariff uncertainty.
-
Top contributors to performance relative to the Russell 2000® Value Index:
-
Security selection within the energy sector strengthened relative performance.
-
The combination of an underweight position and stock selection within the health care sector further supported relative returns.
-
-
Top detractors from performance relative to the Russell 2000® Value Index:
-
Stock selection within both the consumer discretionary and consumer staples sectors held back relative results.
-
The fund's underweight allocation to the financials sector also weakened relative performance.
-
FUND PERFORMANCE
The fund’s past performance is not a good predictor of the fund’s future performance. The graph and table below do not reflect the deduction of taxes that a shareholder would pay on fund distributions or the redemption of fund shares. The graph and table below assume reinvestment of dividends and capital gain distributions.
Growth of a Hypothetical $10,000 Investment
This graph shows the performance of a hypothetical $10,000 investment in Class R1 over a ten year period or since inception, if shorter, in comparison to (i) a broad measure of market performance and (ii) an additional index that MFS believes more closely reflects the market segments in which the fund invests.
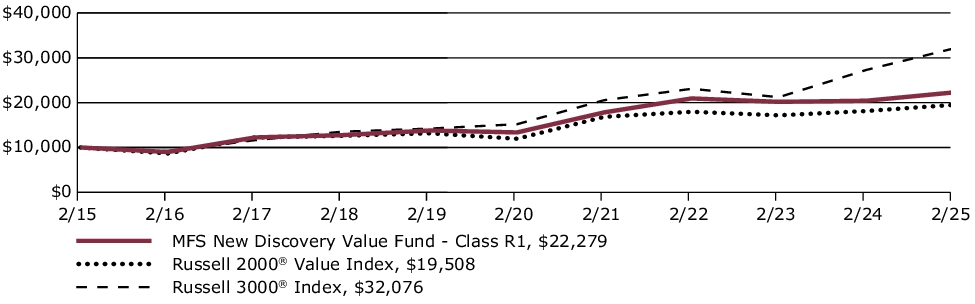
Average Annual Total Returns through 2/28/25
This table shows the average annual total returns of the class of shares noted for the periods shown, both with (if any) and without sales charges. It also shows the average annual total returns of (i) a broad measure of market performance and (ii) an additional index that MFS believes more closely reflects the market segments in which the fund invests, over the same periods.
| Share Class | 1-yr | 5-yr | 10-yr |
| R1 without sales charge | 9.09% | 10.77% | 8.34% |
| Comparative Benchmark(s) | |||
| Russell 3000® Index +∆ | 17.53% | 16.12% | 12.36% |
| Russell 2000® Value Index +∆ | 7.58% | 10.32% | 6.91% |
|
+ |
Effective May 1, 2024, the Russell 3000® Index replaced the Russell 2000® Value Index as a broad measure of market performance in accordance with new regulatory disclosure requirements. The fund continues to use the Russell 2000® Value Index as an additional benchmark that MFS believes more closely reflects the market segments in which the fund invests. |
|
∆ |
Source: FactSet Research Systems Inc. |
Visit mfs.com/perf/r1 for more recent performance information.
FUND STATISTICS AS OF 2/28/25
| Net Assets ($): | 3,218,294,128 | Total Management Fee ($)#: | 27,425,701 | |
| Total Number of Holdings: | 129 | Portfolio Turnover Rate (%): | 34 |
# Includes the effect of any management fee waivers, if applicable.
Where the fund holds derivatives, they are not included in the total number of portfolio holdings.
PORTFOLIO COMPOSITION (BASED ON TOTAL INVESTMENTS AS OF 2/28/25)
Portfolio structure
| Equities | 97.7% |
| Money Market Funds | 2.3% |
Equity sectors
| Financials | 27.3% |
| Industrials | 14.6% |
| Consumer Discretionary | 10.2% |
| Real Estate | 9.0% |
| Materials | 8.4% |
| Information Technology | 6.8% |
| Energy | 6.5% |
| Utilities | 6.4% |
| Health Care | 5.4% |
| Consumer Staples | 2.2% |
| Communication Services | 0.9% |
Top ten holdings
| Prosperity Bancshares, Inc. | 1.5% |
| Portland General Electric Co. | 1.4% |
| SLM Corp. | 1.3% |
| Pacific Premier Bancorp, Inc. | 1.3% |
| Hanover Insurance Group, Inc. | 1.3% |
| Plains GP Holdings LP | 1.3% |
| Columbia Banking System, Inc. | 1.3% |
| First Hawaiian, Inc. | 1.2% |
| Popular, Inc. | 1.2% |
| Prestige Consumer Healthcare, Inc. | 1.2% |
MFS uses the Global Industry Classification Standard (GICS®) for sector/industry reporting. MFS has applied its own internal sector/industry classification methodology for equity securities and non-equity securities that are unclassified by GICS.
Top ten holdings
| Prosperity Bancshares, Inc. | 1.5% |
| Portland General Electric Co. | 1.4% |
| SLM Corp. | 1.3% |
| Pacific Premier Bancorp, Inc. | 1.3% |
| Hanover Insurance Group, Inc. | 1.3% |
| Plains GP Holdings LP | 1.3% |
| Columbia Banking System, Inc. | 1.3% |
| First Hawaiian, Inc. | 1.2% |
| Popular, Inc. | 1.2% |
| Prestige Consumer Healthcare, Inc. | 1.2% |
FUND EXPENSES
What were the fund costs for the last year?
| (based on a hypothetical $10,000 investment) | ||
| Class Name | Costs of a $10,000 investment | Costs paid as a percentage of a $10,000 investment |
| R2 | $151 | 1.44% |
MANAGEMENT'S DISCUSSION OF FUND PERFORMANCE
-
For the twelve months ended February 28, 2025, Class R2 shares of the MFS New Discovery Value Fund (fund) provided a total return of 9.60%, at net asset value. This compares with a return of 17.53% for the fund’s benchmark, the Russell 3000® Index. The fund's other benchmark, the Russell 2000® Value Index, generated a return of 7.58%.
-
Moderating inflation pressures allowed many global central banks to ease monetary policy during the period. However, the pace of disinflation slowed toward the end of the period, particularly in the US.
-
Geopolitical strains remained high amid ongoing conflicts in Ukraine and in the Middle East, while relations between China and the US remained tense, especially regarding trade. At the end of the period, China unveiled a sizable stimulus package aimed at shoring up its property sector and the finances of highly indebted local governments while the Trump administration threatened to impose considerable tariffs on its trading partners.
-
Global equity markets reached record levels late in the period as they withstood the adversity of the unsettled geopolitical climate and a higher interest rate environment but eased back from those highs as policy uncertainty rose. Healthy earnings growth continued though advances in artificial intelligence called into question, at least temporarily, the need for extraordinary levels of infrastructure investment to support the technology.
-
Global bond yields climbed off mid-period lows on the back of the US election results, resilient economic growth, concerns that global disinflationary progress may have stalled and a rising term premium. Reflecting increased inflation uncertainty, market expectations for future Federal Reserve interest rate cuts in 2025 were largely pared back while other major global central banks, notably the ECB, Bank of Canada and Bank of England, continued their gradual easing cycles. Already compressed credit spreads tightened further as corporate fundamentals remained sound. Bond market volatility, as measured by the Merrill Lynch Option Volatility Estimate (MOVE) index, declined in the fourth quarter after peaking before the US election, but climbed late February amongst heightened tariff uncertainty.
-
Top contributors to performance relative to the Russell 2000® Value Index:
-
Security selection within the energy sector strengthened relative performance.
-
The combination of an underweight position and stock selection within the health care sector further supported relative returns.
-
-
Top detractors from performance relative to the Russell 2000® Value Index:
-
Stock selection within both the consumer discretionary and consumer staples sectors held back relative results.
-
The fund's underweight allocation to the financials sector also weakened relative performance.
-
FUND PERFORMANCE
The fund’s past performance is not a good predictor of the fund’s future performance. The graph and table below do not reflect the deduction of taxes that a shareholder would pay on fund distributions or the redemption of fund shares. The graph and table below assume reinvestment of dividends and capital gain distributions.
Growth of a Hypothetical $10,000 Investment
This graph shows the performance of a hypothetical $10,000 investment in Class R2 over a ten year period or since inception, if shorter, in comparison to (i) a broad measure of market performance and (ii) an additional index that MFS believes more closely reflects the market segments in which the fund invests.
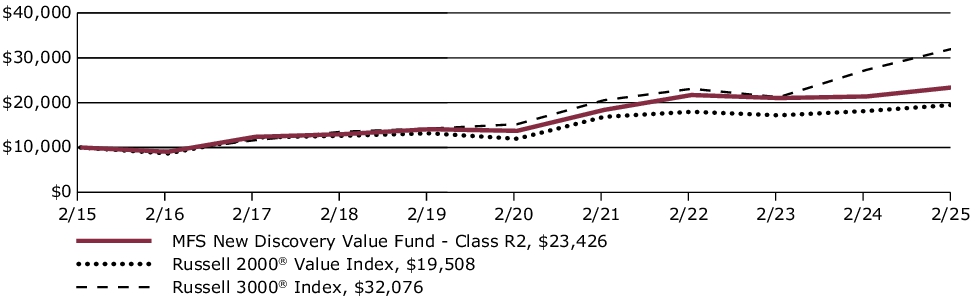
Average Annual Total Returns through 2/28/25
This table shows the average annual total returns of the class of shares noted for the periods shown, both with (if any) and without sales charges. It also shows the average annual total returns of (i) a broad measure of market performance and (ii) an additional index that MFS believes more closely reflects the market segments in which the fund invests, over the same periods.
| Share Class | 1-yr | 5-yr | 10-yr |
| R2 without sales charge | 9.60% | 11.32% | 8.89% |
| Comparative Benchmark(s) | |||
| Russell 3000® Index +∆ | 17.53% | 16.12% | 12.36% |
| Russell 2000® Value Index +∆ | 7.58% | 10.32% | 6.91% |
|
+ |
Effective May 1, 2024, the Russell 3000® Index replaced the Russell 2000® Value Index as a broad measure of market performance in accordance with new regulatory disclosure requirements. The fund continues to use the Russell 2000® Value Index as an additional benchmark that MFS believes more closely reflects the market segments in which the fund invests. |
|
∆ |
Source: FactSet Research Systems Inc. |
Visit mfs.com/perf/r2 for more recent performance information.
FUND STATISTICS AS OF 2/28/25
| Net Assets ($): | 3,218,294,128 | Total Management Fee ($)#: | 27,425,701 | |
| Total Number of Holdings: | 129 | Portfolio Turnover Rate (%): | 34 |
# Includes the effect of any management fee waivers, if applicable.
Where the fund holds derivatives, they are not included in the total number of portfolio holdings.
PORTFOLIO COMPOSITION (BASED ON TOTAL INVESTMENTS AS OF 2/28/25)
Portfolio structure
| Equities | 97.7% |
| Money Market Funds | 2.3% |
Equity sectors
| Financials | 27.3% |
| Industrials | 14.6% |
| Consumer Discretionary | 10.2% |
| Real Estate | 9.0% |
| Materials | 8.4% |
| Information Technology | 6.8% |
| Energy | 6.5% |
| Utilities | 6.4% |
| Health Care | 5.4% |
| Consumer Staples | 2.2% |
| Communication Services | 0.9% |
Top ten holdings
| Prosperity Bancshares, Inc. | 1.5% |
| Portland General Electric Co. | 1.4% |
| SLM Corp. | 1.3% |
| Pacific Premier Bancorp, Inc. | 1.3% |
| Hanover Insurance Group, Inc. | 1.3% |
| Plains GP Holdings LP | 1.3% |
| Columbia Banking System, Inc. | 1.3% |
| First Hawaiian, Inc. | 1.2% |
| Popular, Inc. | 1.2% |
| Prestige Consumer Healthcare, Inc. | 1.2% |
MFS uses the Global Industry Classification Standard (GICS®) for sector/industry reporting. MFS has applied its own internal sector/industry classification methodology for equity securities and non-equity securities that are unclassified by GICS.
Top ten holdings
| Prosperity Bancshares, Inc. | 1.5% |
| Portland General Electric Co. | 1.4% |
| SLM Corp. | 1.3% |
| Pacific Premier Bancorp, Inc. | 1.3% |
| Hanover Insurance Group, Inc. | 1.3% |
| Plains GP Holdings LP | 1.3% |
| Columbia Banking System, Inc. | 1.3% |
| First Hawaiian, Inc. | 1.2% |
| Popular, Inc. | 1.2% |
| Prestige Consumer Healthcare, Inc. | 1.2% |
FUND EXPENSES
What were the fund costs for the last year?
| (based on a hypothetical $10,000 investment) | ||
| Class Name | Costs of a $10,000 investment | Costs paid as a percentage of a $10,000 investment |
| R3 | $125 | 1.19% |
MANAGEMENT'S DISCUSSION OF FUND PERFORMANCE
-
For the twelve months ended February 28, 2025, Class R3 shares of the MFS New Discovery Value Fund (fund) provided a total return of 9.86%, at net asset value. This compares with a return of 17.53% for the fund’s benchmark, the Russell 3000® Index. The fund's other benchmark, the Russell 2000® Value Index, generated a return of 7.58%.
-
Moderating inflation pressures allowed many global central banks to ease monetary policy during the period. However, the pace of disinflation slowed toward the end of the period, particularly in the US.
-
Geopolitical strains remained high amid ongoing conflicts in Ukraine and in the Middle East, while relations between China and the US remained tense, especially regarding trade. At the end of the period, China unveiled a sizable stimulus package aimed at shoring up its property sector and the finances of highly indebted local governments while the Trump administration threatened to impose considerable tariffs on its trading partners.
-
Global equity markets reached record levels late in the period as they withstood the adversity of the unsettled geopolitical climate and a higher interest rate environment but eased back from those highs as policy uncertainty rose. Healthy earnings growth continued though advances in artificial intelligence called into question, at least temporarily, the need for extraordinary levels of infrastructure investment to support the technology.
-
Global bond yields climbed off mid-period lows on the back of the US election results, resilient economic growth, concerns that global disinflationary progress may have stalled and a rising term premium. Reflecting increased inflation uncertainty, market expectations for future Federal Reserve interest rate cuts in 2025 were largely pared back while other major global central banks, notably the ECB, Bank of Canada and Bank of England, continued their gradual easing cycles. Already compressed credit spreads tightened further as corporate fundamentals remained sound. Bond market volatility, as measured by the Merrill Lynch Option Volatility Estimate (MOVE) index, declined in the fourth quarter after peaking before the US election, but climbed late February amongst heightened tariff uncertainty.
-
Top contributors to performance relative to the Russell 2000® Value Index:
-
Security selection within the energy sector strengthened relative performance.
-
The combination of an underweight position and stock selection within the health care sector further supported relative returns.
-
-
Top detractors from performance relative to the Russell 2000® Value Index:
-
Stock selection within both the consumer discretionary and consumer staples sectors held back relative results.
-
The fund's underweight allocation to the financials sector also weakened relative performance.
-
FUND PERFORMANCE
The fund’s past performance is not a good predictor of the fund’s future performance. The graph and table below do not reflect the deduction of taxes that a shareholder would pay on fund distributions or the redemption of fund shares. The graph and table below assume reinvestment of dividends and capital gain distributions.
Growth of a Hypothetical $10,000 Investment
This graph shows the performance of a hypothetical $10,000 investment in Class R3 over a ten year period or since inception, if shorter, in comparison to (i) a broad measure of market performance and (ii) an additional index that MFS believes more closely reflects the market segments in which the fund invests.
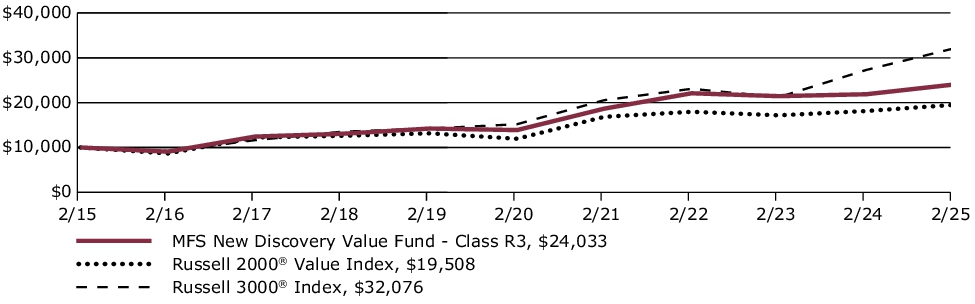
Average Annual Total Returns through 2/28/25
This table shows the average annual total returns of the class of shares noted for the periods shown, both with (if any) and without sales charges. It also shows the average annual total returns of (i) a broad measure of market performance and (ii) an additional index that MFS believes more closely reflects the market segments in which the fund invests, over the same periods.
| Share Class | 1-yr | 5-yr | 10-yr |
| R3 without sales charge | 9.86% | 11.61% | 9.16% |
| Comparative Benchmark(s) | |||
| Russell 3000® Index +∆ | 17.53% | 16.12% | 12.36% |
| Russell 2000® Value Index +∆ | 7.58% | 10.32% | 6.91% |
|
+ |
Effective May 1, 2024, the Russell 3000® Index replaced the Russell 2000® Value Index as a broad measure of market performance in accordance with new regulatory disclosure requirements. The fund continues to use the Russell 2000® Value Index as an additional benchmark that MFS believes more closely reflects the market segments in which the fund invests. |
|
∆ |
Source: FactSet Research Systems Inc. |
Visit mfs.com/perf/r3 for more recent performance information.
FUND STATISTICS AS OF 2/28/25
| Net Assets ($): | 3,218,294,128 | Total Management Fee ($)#: | 27,425,701 | |
| Total Number of Holdings: | 129 | Portfolio Turnover Rate (%): | 34 |
# Includes the effect of any management fee waivers, if applicable.
Where the fund holds derivatives, they are not included in the total number of portfolio holdings.
PORTFOLIO COMPOSITION (BASED ON TOTAL INVESTMENTS AS OF 2/28/25)
Portfolio structure
| Equities | 97.7% |
| Money Market Funds | 2.3% |
Equity sectors
| Financials | 27.3% |
| Industrials | 14.6% |
| Consumer Discretionary | 10.2% |
| Real Estate | 9.0% |
| Materials | 8.4% |
| Information Technology | 6.8% |
| Energy | 6.5% |
| Utilities | 6.4% |
| Health Care | 5.4% |
| Consumer Staples | 2.2% |
| Communication Services | 0.9% |
Top ten holdings
| Prosperity Bancshares, Inc. | 1.5% |
| Portland General Electric Co. | 1.4% |
| SLM Corp. | 1.3% |
| Pacific Premier Bancorp, Inc. | 1.3% |
| Hanover Insurance Group, Inc. | 1.3% |
| Plains GP Holdings LP | 1.3% |
| Columbia Banking System, Inc. | 1.3% |
| First Hawaiian, Inc. | 1.2% |
| Popular, Inc. | 1.2% |
| Prestige Consumer Healthcare, Inc. | 1.2% |
MFS uses the Global Industry Classification Standard (GICS®) for sector/industry reporting. MFS has applied its own internal sector/industry classification methodology for equity securities and non-equity securities that are unclassified by GICS.
Top ten holdings
| Prosperity Bancshares, Inc. | 1.5% |
| Portland General Electric Co. | 1.4% |
| SLM Corp. | 1.3% |
| Pacific Premier Bancorp, Inc. | 1.3% |
| Hanover Insurance Group, Inc. | 1.3% |
| Plains GP Holdings LP | 1.3% |
| Columbia Banking System, Inc. | 1.3% |
| First Hawaiian, Inc. | 1.2% |
| Popular, Inc. | 1.2% |
| Prestige Consumer Healthcare, Inc. | 1.2% |
FUND EXPENSES
What were the fund costs for the last year?
| (based on a hypothetical $10,000 investment) | ||
| Class Name | Costs of a $10,000 investment | Costs paid as a percentage of a $10,000 investment |
| R4 | $99 | 0.94% |
MANAGEMENT'S DISCUSSION OF FUND PERFORMANCE
-
For the twelve months ended February 28, 2025, Class R4 shares of the MFS New Discovery Value Fund (fund) provided a total return of 10.12%, at net asset value. This compares with a return of 17.53% for the fund’s benchmark, the Russell 3000® Index. The fund's other benchmark, the Russell 2000® Value Index, generated a return of 7.58%.
-
Moderating inflation pressures allowed many global central banks to ease monetary policy during the period. However, the pace of disinflation slowed toward the end of the period, particularly in the US.
-
Geopolitical strains remained high amid ongoing conflicts in Ukraine and in the Middle East, while relations between China and the US remained tense, especially regarding trade. At the end of the period, China unveiled a sizable stimulus package aimed at shoring up its property sector and the finances of highly indebted local governments while the Trump administration threatened to impose considerable tariffs on its trading partners.
-
Global equity markets reached record levels late in the period as they withstood the adversity of the unsettled geopolitical climate and a higher interest rate environment but eased back from those highs as policy uncertainty rose. Healthy earnings growth continued though advances in artificial intelligence called into question, at least temporarily, the need for extraordinary levels of infrastructure investment to support the technology.
-
Global bond yields climbed off mid-period lows on the back of the US election results, resilient economic growth, concerns that global disinflationary progress may have stalled and a rising term premium. Reflecting increased inflation uncertainty, market expectations for future Federal Reserve interest rate cuts in 2025 were largely pared back while other major global central banks, notably the ECB, Bank of Canada and Bank of England, continued their gradual easing cycles. Already compressed credit spreads tightened further as corporate fundamentals remained sound. Bond market volatility, as measured by the Merrill Lynch Option Volatility Estimate (MOVE) index, declined in the fourth quarter after peaking before the US election, but climbed late February amongst heightened tariff uncertainty.
-
Top contributors to performance relative to the Russell 2000® Value Index:
-
Security selection within the energy sector strengthened relative performance.
-
The combination of an underweight position and stock selection within the health care sector further supported relative returns.
-
-
Top detractors from performance relative to the Russell 2000® Value Index:
-
Stock selection within both the consumer discretionary and consumer staples sectors held back relative results.
-
The fund's underweight allocation to the financials sector also weakened relative performance.
-
FUND PERFORMANCE
The fund’s past performance is not a good predictor of the fund’s future performance. The graph and table below do not reflect the deduction of taxes that a shareholder would pay on fund distributions or the redemption of fund shares. The graph and table below assume reinvestment of dividends and capital gain distributions.
Growth of a Hypothetical $10,000 Investment
This graph shows the performance of a hypothetical $10,000 investment in Class R4 over a ten year period or since inception, if shorter, in comparison to (i) a broad measure of market performance and (ii) an additional index that MFS believes more closely reflects the market segments in which the fund invests.

Average Annual Total Returns through 2/28/25
This table shows the average annual total returns of the class of shares noted for the periods shown, both with (if any) and without sales charges. It also shows the average annual total returns of (i) a broad measure of market performance and (ii) an additional index that MFS believes more closely reflects the market segments in which the fund invests, over the same periods.
| Share Class | 1-yr | 5-yr | 10-yr |
| R4 without sales charge | 10.12% | 11.88% | 9.43% |
| Comparative Benchmark(s) | |||
| Russell 3000® Index +∆ | 17.53% | 16.12% | 12.36% |
| Russell 2000® Value Index +∆ | 7.58% | 10.32% | 6.91% |
|
+ |
Effective May 1, 2024, the Russell 3000® Index replaced the Russell 2000® Value Index as a broad measure of market performance in accordance with new regulatory disclosure requirements. The fund continues to use the Russell 2000® Value Index as an additional benchmark that MFS believes more closely reflects the market segments in which the fund invests. |
|
∆ |
Source: FactSet Research Systems Inc. |
Visit mfs.com/perf/r4 for more recent performance information.
FUND STATISTICS AS OF 2/28/25
| Net Assets ($): | 3,218,294,128 | Total Management Fee ($)#: | 27,425,701 | |
| Total Number of Holdings: | 129 | Portfolio Turnover Rate (%): | 34 |
# Includes the effect of any management fee waivers, if applicable.
Where the fund holds derivatives, they are not included in the total number of portfolio holdings.
PORTFOLIO COMPOSITION (BASED ON TOTAL INVESTMENTS AS OF 2/28/25)
Portfolio structure
| Equities | 97.7% |
| Money Market Funds | 2.3% |
Equity sectors
| Financials | 27.3% |
| Industrials | 14.6% |
| Consumer Discretionary | 10.2% |
| Real Estate | 9.0% |
| Materials | 8.4% |
| Information Technology | 6.8% |
| Energy | 6.5% |
| Utilities | 6.4% |
| Health Care | 5.4% |
| Consumer Staples | 2.2% |
| Communication Services | 0.9% |
Top ten holdings
| Prosperity Bancshares, Inc. | 1.5% |
| Portland General Electric Co. | 1.4% |
| SLM Corp. | 1.3% |
| Pacific Premier Bancorp, Inc. | 1.3% |
| Hanover Insurance Group, Inc. | 1.3% |
| Plains GP Holdings LP | 1.3% |
| Columbia Banking System, Inc. | 1.3% |
| First Hawaiian, Inc. | 1.2% |
| Popular, Inc. | 1.2% |
| Prestige Consumer Healthcare, Inc. | 1.2% |
MFS uses the Global Industry Classification Standard (GICS®) for sector/industry reporting. MFS has applied its own internal sector/industry classification methodology for equity securities and non-equity securities that are unclassified by GICS.
Top ten holdings
| Prosperity Bancshares, Inc. | 1.5% |
| Portland General Electric Co. | 1.4% |
| SLM Corp. | 1.3% |
| Pacific Premier Bancorp, Inc. | 1.3% |
| Hanover Insurance Group, Inc. | 1.3% |
| Plains GP Holdings LP | 1.3% |
| Columbia Banking System, Inc. | 1.3% |
| First Hawaiian, Inc. | 1.2% |
| Popular, Inc. | 1.2% |
| Prestige Consumer Healthcare, Inc. | 1.2% |
FUND EXPENSES
What were the fund costs for the last year?
| (based on a hypothetical $10,000 investment) | ||
| Class Name | Costs of a $10,000 investment | Costs paid as a percentage of a $10,000 investment |
| R6 | $89 | 0.85% |
MANAGEMENT'S DISCUSSION OF FUND PERFORMANCE
-
For the twelve months ended February 28, 2025, Class R6 shares of the MFS New Discovery Value Fund (fund) provided a total return of 10.20%, at net asset value. This compares with a return of 17.53% for the fund’s benchmark, the Russell 3000® Index. The fund's other benchmark, the Russell 2000® Value Index, generated a return of 7.58%.
-
Moderating inflation pressures allowed many global central banks to ease monetary policy during the period. However, the pace of disinflation slowed toward the end of the period, particularly in the US.
-
Geopolitical strains remained high amid ongoing conflicts in Ukraine and in the Middle East, while relations between China and the US remained tense, especially regarding trade. At the end of the period, China unveiled a sizable stimulus package aimed at shoring up its property sector and the finances of highly indebted local governments while the Trump administration threatened to impose considerable tariffs on its trading partners.
-
Global equity markets reached record levels late in the period as they withstood the adversity of the unsettled geopolitical climate and a higher interest rate environment but eased back from those highs as policy uncertainty rose. Healthy earnings growth continued though advances in artificial intelligence called into question, at least temporarily, the need for extraordinary levels of infrastructure investment to support the technology.
-
Global bond yields climbed off mid-period lows on the back of the US election results, resilient economic growth, concerns that global disinflationary progress may have stalled and a rising term premium. Reflecting increased inflation uncertainty, market expectations for future Federal Reserve interest rate cuts in 2025 were largely pared back while other major global central banks, notably the ECB, Bank of Canada and Bank of England, continued their gradual easing cycles. Already compressed credit spreads tightened further as corporate fundamentals remained sound. Bond market volatility, as measured by the Merrill Lynch Option Volatility Estimate (MOVE) index, declined in the fourth quarter after peaking before the US election, but climbed late February amongst heightened tariff uncertainty.
-
Top contributors to performance relative to the Russell 2000® Value Index:
-
Security selection within the energy sector strengthened relative performance.
-
The combination of an underweight position and stock selection within the health care sector further supported relative returns.
-
-
Top detractors from performance relative to the Russell 2000® Value Index:
-
Stock selection within both the consumer discretionary and consumer staples sectors held back relative results.
-
The fund's underweight allocation to the financials sector also weakened relative performance.
-
FUND PERFORMANCE
The fund’s past performance is not a good predictor of the fund’s future performance. The graph and table below do not reflect the deduction of taxes that a shareholder would pay on fund distributions or the redemption of fund shares. The graph and table below assume reinvestment of dividends and capital gain distributions.
Growth of a Hypothetical $10,000 Investment
This graph shows the performance of a hypothetical $10,000 investment in Class R6 over a ten year period or since inception, if shorter, in comparison to (i) a broad measure of market performance and (ii) an additional index that MFS believes more closely reflects the market segments in which the fund invests.
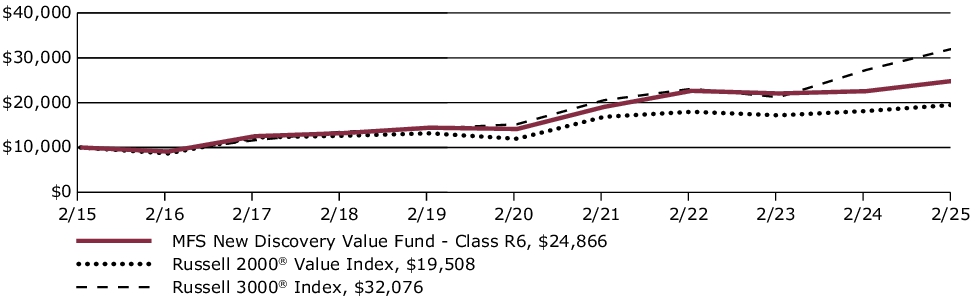
Average Annual Total Returns through 2/28/25
This table shows the average annual total returns of the class of shares noted for the periods shown, both with (if any) and without sales charges. It also shows the average annual total returns of (i) a broad measure of market performance and (ii) an additional index that MFS believes more closely reflects the market segments in which the fund invests, over the same periods.
| Share Class | 1-yr | 5-yr | 10-yr |
| R6 without sales charge | 10.20% | 11.98% | 9.54% |
| Comparative Benchmark(s) | |||
| Russell 3000® Index +∆ | 17.53% | 16.12% | 12.36% |
| Russell 2000® Value Index +∆ | 7.58% | 10.32% | 6.91% |
|
+ |
Effective May 1, 2024, the Russell 3000® Index replaced the Russell 2000® Value Index as a broad measure of market performance in accordance with new regulatory disclosure requirements. The fund continues to use the Russell 2000® Value Index as an additional benchmark that MFS believes more closely reflects the market segments in which the fund invests. |
|
∆ |
Source: FactSet Research Systems Inc. |
Visit mfs.com/perf/r6 for more recent performance information.
FUND STATISTICS AS OF 2/28/25
| Net Assets ($): | 3,218,294,128 | Total Management Fee ($)#: | 27,425,701 | |
| Total Number of Holdings: | 129 | Portfolio Turnover Rate (%): | 34 |
# Includes the effect of any management fee waivers, if applicable.
Where the fund holds derivatives, they are not included in the total number of portfolio holdings.
PORTFOLIO COMPOSITION (BASED ON TOTAL INVESTMENTS AS OF 2/28/25)
Portfolio structure
| Equities | 97.7% |
| Money Market Funds | 2.3% |
Equity sectors
| Financials | 27.3% |
| Industrials | 14.6% |
| Consumer Discretionary | 10.2% |
| Real Estate | 9.0% |
| Materials | 8.4% |
| Information Technology | 6.8% |
| Energy | 6.5% |
| Utilities | 6.4% |
| Health Care | 5.4% |
| Consumer Staples | 2.2% |
| Communication Services | 0.9% |
Top ten holdings
| Prosperity Bancshares, Inc. | 1.5% |
| Portland General Electric Co. | 1.4% |
| SLM Corp. | 1.3% |
| Pacific Premier Bancorp, Inc. | 1.3% |
| Hanover Insurance Group, Inc. | 1.3% |
| Plains GP Holdings LP | 1.3% |
| Columbia Banking System, Inc. | 1.3% |
| First Hawaiian, Inc. | 1.2% |
| Popular, Inc. | 1.2% |
| Prestige Consumer Healthcare, Inc. | 1.2% |
MFS uses the Global Industry Classification Standard (GICS®) for sector/industry reporting. MFS has applied its own internal sector/industry classification methodology for equity securities and non-equity securities that are unclassified by GICS.
Top ten holdings
| Prosperity Bancshares, Inc. | 1.5% |
| Portland General Electric Co. | 1.4% |
| SLM Corp. | 1.3% |
| Pacific Premier Bancorp, Inc. | 1.3% |
| Hanover Insurance Group, Inc. | 1.3% |
| Plains GP Holdings LP | 1.3% |
| Columbia Banking System, Inc. | 1.3% |
| First Hawaiian, Inc. | 1.2% |
| Popular, Inc. | 1.2% |
| Prestige Consumer Healthcare, Inc. | 1.2% |
| [1] | Includes the effect of any management fee waivers, if applicable. |
| [2] | Includes the effect of any management fee waivers, if applicable. |
| [3] | Includes the effect of any management fee waivers, if applicable. |
| [4] | Includes the effect of any management fee waivers, if applicable. |
| [5] | Includes the effect of any management fee waivers, if applicable. |
| [6] | Includes the effect of any management fee waivers, if applicable. |
| [7] | Includes the effect of any management fee waivers, if applicable. |
| [8] | Includes the effect of any management fee waivers, if applicable. |
| [9] | Includes the effect of any management fee waivers, if applicable. |
| [10] | Expenses are direct expenses and do not include underlying fund fees and expenses. |
| [11] | Includes the effect of any management fee waivers, if applicable. |
| [12] | Expenses are direct expenses and do not include underlying fund fees and expenses. |
| [13] | Includes the effect of any management fee waivers, if applicable. |
| [14] | Expenses are direct expenses and do not include underlying fund fees and expenses. |
| [15] | Includes the effect of any management fee waivers, if applicable. |
| [16] | Expenses are direct expenses and do not include underlying fund fees and expenses. |
| [17] | Includes the effect of any management fee waivers, if applicable. |
| [18] | Expenses are direct expenses and do not include underlying fund fees and expenses. |
| [19] | Includes the effect of any management fee waivers, if applicable. |
| [20] | Expenses are direct expenses and do not include underlying fund fees and expenses. |
| [21] | Includes the effect of any management fee waivers, if applicable. |
| [22] | Expenses are direct expenses and do not include underlying fund fees and expenses. |
| [23] | Includes the effect of any management fee waivers, if applicable. |
| [24] | Expenses are direct expenses and do not include underlying fund fees and expenses. |
| [25] | Includes the effect of any management fee waivers, if applicable. |
| [26] | Includes the effect of any management fee waivers, if applicable. |
| [27] | Includes the effect of any management fee waivers, if applicable. |
| [28] | Includes the effect of any management fee waivers, if applicable. |
| [29] | Includes the effect of any management fee waivers, if applicable. |
| [30] | Includes the effect of any management fee waivers, if applicable. |
| [31] | Includes the effect of any management fee waivers, if applicable. |
| [32] | Includes the effect of any management fee waivers, if applicable. |
| [33] | Includes the effect of any management fee waivers, if applicable. |
| [34] | Includes the effect of any management fee waivers, if applicable. |