Pay Versus Performance Table
| Average Summary Compensation Table Total for Other NEOs(1)(2) ($) (d) |
Value of Initial Fixed $100 Investment on December 31, 2019 Based On: |
|||||||||||||||
| Year (a) |
Summary Compensation Table Total for PEO(1) ($) (b) |
Compensation Actually Paid to PEO(2) ($) (c) |
Average Compensation Actually Paid to Other NEOs(1)(2) ($) (e) |
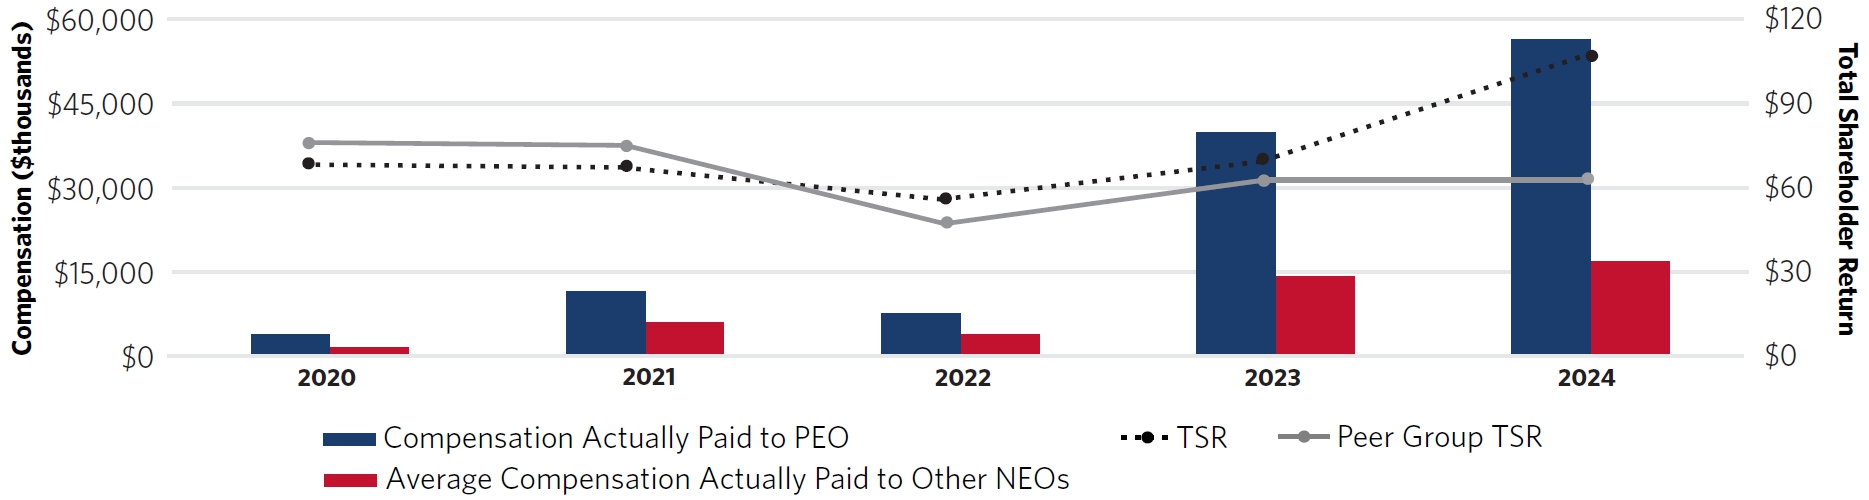
Total Shareholder Return(3) ($) (f) |
Peer Group Total Shareholder Return(3) ($) (g) |
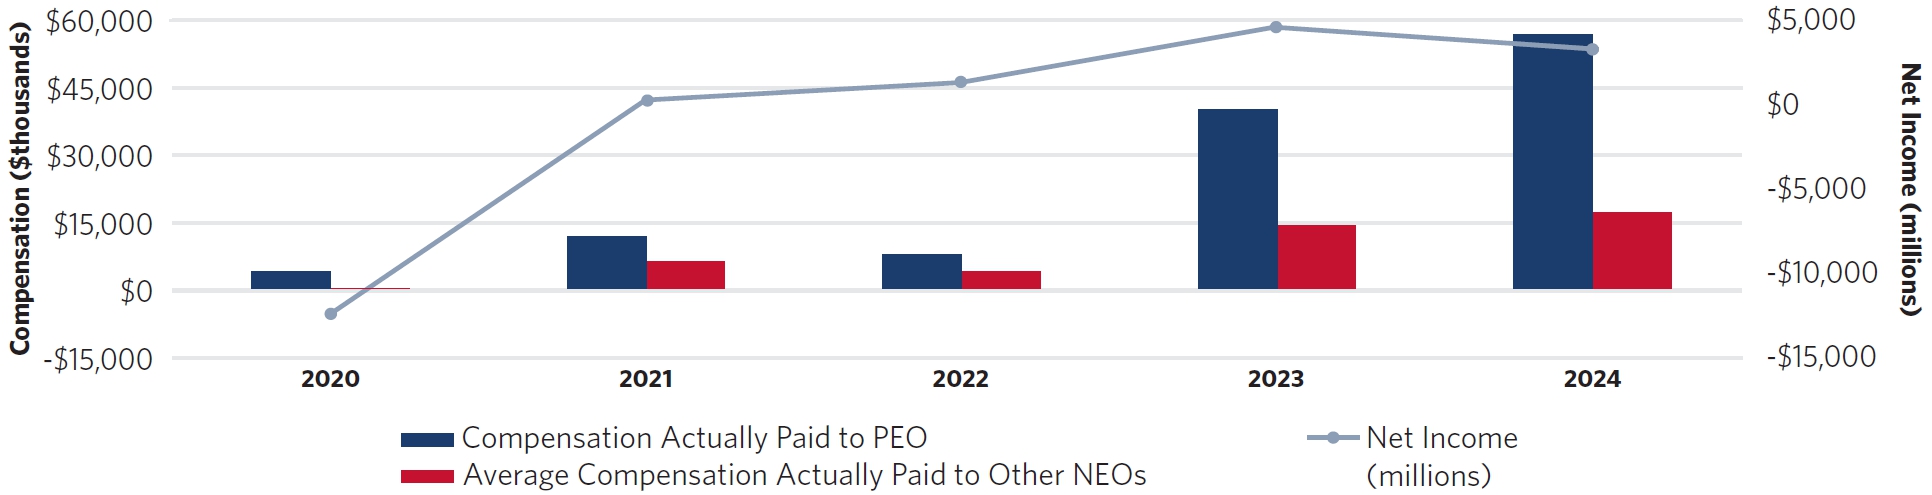
Net Income(4) ($) (millions) (h) |
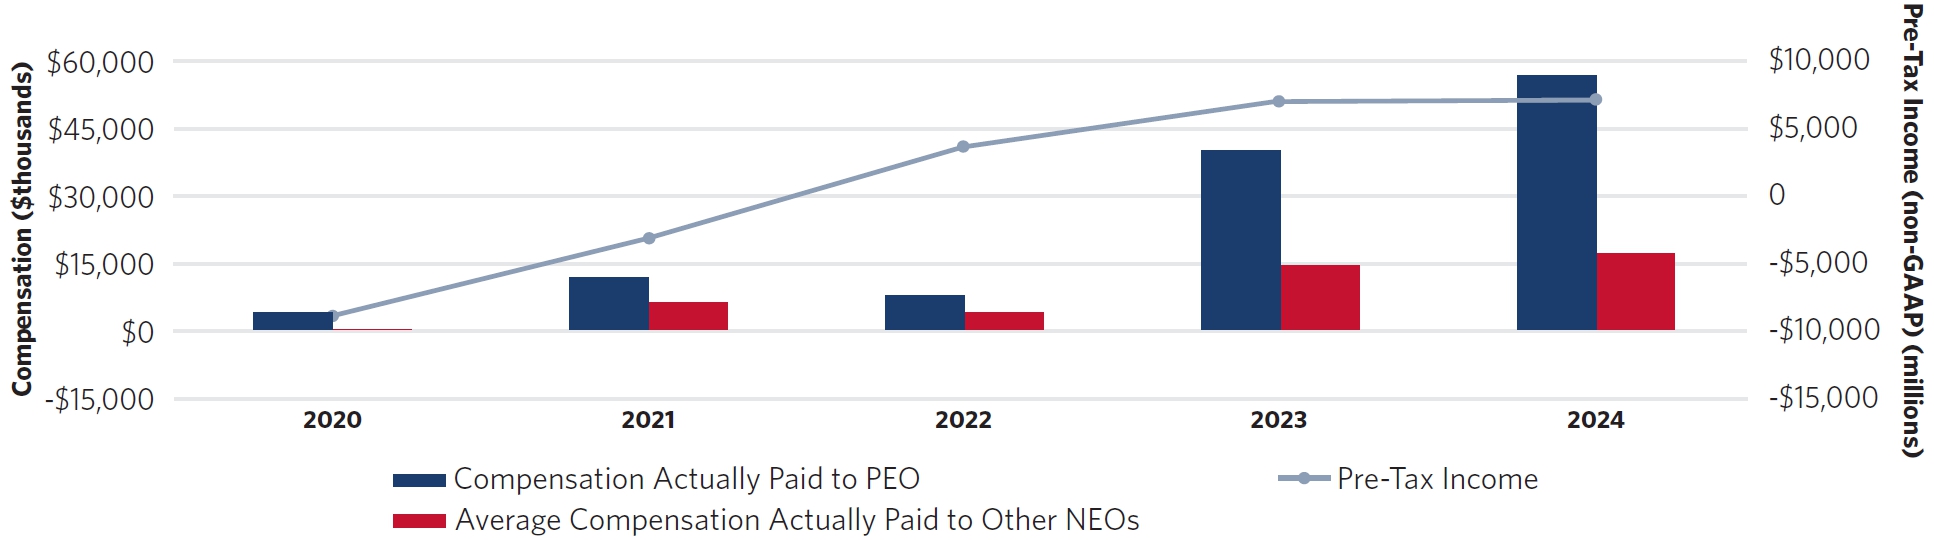
Pre-Tax Income(5) ($) (millions) (i) | |||||||||
| 2024 | 27,117,069 | 56,429,052 | 8,919,676 | 16,901,490 | 106 | 63 | 3,457 | 7,052 | ||||||||
| 2023 | 34,214,328 | 39,811,315 | 12,332,605 | 14,136,612 | 70 | 63 | 4,609 | 7,021 | ||||||||
| 2022 | 9,606,387 | 7,613,922 | 5,087,831 | 3,861,941 | 57 | 48 | 1,318 | 3,619 | ||||||||
| 2021 | 12,360,420 | 11,616,466 | 6,115,487 | 6,028,546 | 68 | 74 | 280 | (3,144) | ||||||||
| 2020 | 13,134,012 | 3,817,481 | 4,254,247 | 1,507,079 | 69 | 76 | (12,385) | (8,881) | ||||||||
| (1) | The PEO reflected in columns (b) and (c) is Edward H. Bastian for all years shown and the Other NEOs reflected in columns (d) and (e) represent the following individuals for each of the years shown: 2024: Glen W. Hauenstein, Alain Bellemare, Peter W. Carter, Daniel C. Janki and Michael L. Spanos 2023: Glen W. Hauenstein, Peter W. Carter, Daniel C. Janki and Michael L. Spanos 2022: Glen W. Hauenstein, Alain Bellemare, Peter W. Carter and Daniel C. Janki 2021: Glen W. Hauenstein, Alain Bellemare, Peter W. Carter, Daniel C. Janki, William C. Carroll and Garrett L. Chase 2020: Glen W. Hauenstein, Peter W. Carter, Rahul D. Samant, William C. Carroll, Garrett L. Chase, Paul A. Jacobson and W. Gil West |
| (3) | Amounts rounded to nearest whole dollar amount. The peer group used in this disclosure is the NYSE ARCA Airline Index, which is the same peer group used in Item 5 of our Form 10-K. |
| (2) | The table below describes the adjustments, each of which is required by SEC rules, to calculate the CAP amounts from the SCT Totals of our PEO (columns (b) and (c)) and the average CAP amounts from the average SCT Totals of the Other NEOs (columns (d) and (e)). The SCT Totals and CAP amounts do not reflect the actual amount of compensation earned by or paid to our named executive officers during the applicable years. In accordance with SEC rules, values for awards that vested on December 31, 2024 and awards that were outstanding and unvested as of December 31, 2024 were based on the $60.50 closing price of Delta common stock on the NYSE on December 31, 2024. If the values of the awards were based on average closing price of Delta common stock on the NYSE from March 5, 2025 to April 15, 2025 (i.e., $45.06), then the CAP amount for the PEO would have been $39,739,925. |
| 2024 ($) | ||||
| Adjustments | PEO | Other NEOs Average | ||
| SCT Total | 27,117,069 | 8,919,676 | ||
| › (Deduct) aggregate change in actuarial present value included in SCT Total for covered fiscal year | - | - | ||
| › Add pension value attributable to covered fiscal year’s service and any change in pension value attributable to plan amendments made in covered fiscal year(a) | - | - | ||
| › (Deduct) aggregate value of stock awards and option awards included in SCT Total for covered fiscal year | (10,961,648) | (4,193,018) | ||
| › Add fair value at year-end of awards granted during covered fiscal year that are outstanding and unvested as of end of covered fiscal year | 16,492,905 | 5,711,200 | ||
| › Add/(Deduct) change in fair value as of end of covered fiscal year (from end of prior fiscal year) for awards granted in any prior fiscal year that are outstanding and unvested at end of covered fiscal year | 9,590,751 | 2,606,029 | ||
| › Add fair value at vesting date for awards that are granted and vested in the same year | - | 103,616 | ||
| › Add/(Deduct) change in fair value as of vesting date (from end of prior fiscal year) of awards granted in prior fiscal years that vested at end of or during covered fiscal year | 13,694,959 | 4,056,615 | ||
| › (Deduct) fair value at end of prior fiscal year of awards granted in any prior fiscal year that failed to meet the applicable vesting conditions during covered fiscal year | - | (441,251) | ||
| › Add dividends or other earnings paid on awards in covered fiscal year if not otherwise included in SCT Total for covered fiscal year | 495,016 | 138,624 | ||
| CAP Amount | 56,429,052 | 16,901,490 | ||
| (a) | There is no added pension service cost for any of the years shown, as the benefits were frozen in 2005. None of the Other NEOs are eligible for pension benefits. |
CAP vs. Company/Peer Group Total Shareholder Return
CAP vs. Company/Peer Group Total Shareholder Return
CAP vs. GAAP Net Income
CAP vs. GAAP Net Income
CAP vs. Pre-Tax Income (non-GAAP)
CAP vs. Pre-Tax Income (non-GAAP)
Most Important Financial Performance Measures
The list below represents, in Delta’s assessment, the most important performance measures used to link CAP for the named executive officers to company performance for 2024. For further information regarding these financial performance measures and their function in Delta’s executive compensation program, see “Compensation Discussion and Analysis—Elements of Compensation—Performance Measure Selection” beginning on page 33.
| Financial Performance Measures |
| Cumulative Free Cash Flow (non-GAAP) |
| Pre-Tax Income (non-GAAP) (Company-Selected Measure) |
| Total Revenue Per Available Seat Mile (TRASM) (non-GAAP) |