Pay Versus Performance
As required by Section 952(a) of the Dodd-Frank Wall Street Reform and Consumer Protection Act and Item 402(v) of Regulation S-K, we are providing the following information about the relationship between executive compensation actually paid and our financial performance for each of the last three completed fiscal years. For further information concerning our variable pay-for-performance philosophy and how we align executive compensation with our performance, refer to “Executive Compensation - Compensation Discussion and Analysis.”
| Year(1) | Summary Compensation Table Total for PEO | Compensation Actually Paid to PEO (2) | Average Summary Compensation Table Total for Non-PEO NEOs | Average Compensation Actually Paid to Non-PEO NEOs (2) | Value of Initial Fixed $100 Investment Based on: | Net Income ($Millions) | CSM: Adjusted EBITDA ($Millions) (4) | |
| Total Shareholder Return | Peer Group Total Shareholder Return (3) | |||||||
| (a) | (b) | (c) | (d) | (e) | (f) | (g) | (h) | (i) |
| 2024 | $4,711,525 | $5,262,248 | $1,657,745 | $1,622,464 | $12.77 | $158.48 | ($42) | $104 |
| 2023 | $1,230,808 | $1,515,920 | $1,157,554 | $1,210,715 | $9.99 | $118.93 | ($122) | $78 |
| 2022 | $986,490 | ($19,820,499) | $2,669,569 | ($122,097) | $7.03 | $81.50 | ($188) | $84 |
| 2021 | $1,369,813 | ($148,452,518) | $2,444,037 | $191,542 | $40.40 | $134.41 | $69 | $135 |
| 2020 | $52,023,140 | $30,876,980 | $2,052,741 | $1,416,532 | $90.23 | $137.32 | ($48) | $124 |
| (1) | Our PEO for each year reported is Douglas Lebda, our Chief Executive Officer. The individuals comprising the Non-PEO NEOs for each reported year are listed below. |
| 2020 | 2021 | 2022 | 2023 | 2024 |
|
Neil Salvage J.D. Moriarty Jill Olmstead Sushil Sharma |
Trent Ziegler J.D. Moriarty Jill Olmstead Scott Peyree Neil Salvage |
Trent Ziegler J.D. Moriarty Scott Peyree Scott Totman |
Trent Ziegler Scott Peyree Scott Totman Jill Olmstead J.D. Moriarty |
Jason Bengel Scott Peyree Scott Totman Jill Olmstead Trent Ziegler |
| (2) | “Compensation Actually Paid” (CAP) is calculated by taking Summary Compensation Table total compensation: a) less the stock award and stock option grant values; b) plus the year over year change in the fair value of stock and option awards that are unvested as of the end of the year, or vested or were forfeited during the year. The Company has not paid dividends historically and does not sponsor any pension arrangements; thus no adjustments are made for these items. Reconciliation of the Summary Compensation Table total compensation and CAP is summarized in the following table: |
| PEO(i)(ii) | ||||||||||
| Fiscal Year | 2020 | 2021 | 2022 | 2023 | 2024 | |||||
| SCT Total Compensation | $ | 52,023,140 | $ | 1,369,813 | $ | 986,490 | $ | 1,230,808 | $ | 4,711,525 |
| - Stock and Option Award Values Reported in SCT for the Covered Year | $ | (51,173,410) | $ | (609,893) | $ | 0 | $ | 0 | $ | (3,011,650) |
| + Fair Value of Outstanding Unvested Stock and Option Awards Granted in Covered Year | $ | 63,447,076 | $ | 226,810 | $ | 114,755 | $ | 0 | $ | 2,402,706 |
| + Change in Fair Value of Outstanding Unvested Stock and Option Awards from Prior Years | $ | (32,561,596) | $ | (144,913,228) | $ | (3,222,417) | $ | 141,967 | $ | 234,109 |
| + Fair Value of Stock and Option Awards Granted in Covered Year that Vested | $ | 0 | $ | 0 | $ | 0 | $ | 0 | $ | 779,925 |
| + Change in Fair Value of Stock and Option Awards from Prior Years that Vested in Covered Year | $ | (858,230) | $ | (4,526,020) | $ | (15,867,193) | $ | 143,145 | $ | 145,633 |
| - Fair Value of Stock and Option Awards Forfeited during the Covered Year | $ | 0 | $ | 0 | $ | (1,832,134) | $ | 0 | $ | 0 |
| Compensation Actually Paid | $ | 30,876,980 | $ | (148,452,518) | $ | (19,820,499) | $ | 1,515,920 | $ | 5,262,248 |
| Average Non-PEO NEO(i)(ii) | ||||||||||
| Fiscal Year | 2020 | 2021 | 2022 | 2023 | 2024 | |||||
| SCT Total Compensation | $ | 2,052,741 | $ | 2,444,037 | $ | 2,669,569 | $ | 1,157,554 | $ | 1,657,745 |
| - Stock and Option Award Values Reported in SCT for the Covered Year | $ | (1,669,445) | $ | (1,678,067) | $ | (2,244,210) | $ | (590,700) | $ | (1,060,241) |
| + Fair Value of Outstanding Unvested Stock and Option Awards Granted in Covered Year | $ | 1,505,983 | $ | 958,366 | $ | 283,037 | $ | 409,320 | $ | 731,622 |
| + Change in Fair Value of Outstanding Unvested Stock and Option Awards from Prior Years | $ | (556,249) | $ | (789,088) | $ | (652,021) | $ | 92,326 | $ | 93,850 |
| + Fair Value of Stock and Option Awards Granted in Covered Year that Vested | $ | 0 | $ | 0 | $ | 0 | $ | 53,680 | $ | 83,192 |
| + Change in Fair Value of Stock and Option Awards from Prior Years that Vested in Covered Year | $ | 83,503 | $ | (743,706) | $ | (178,472) | $ | 109,885 | $ | 167,926 |
| - Fair Value of Stock and Option Awards Forfeited during the Covered Year | $ | 0 | $ | 0 | $ | 0 | $ | (21,350) | $ | (51,630) |
| Compensation Actually Paid | $ | 1,416,532 | $ | 191,542 | $ | (122,097) | $ | 1,210,715 | $ | 1,622,464 |
| i. | The fair value of performance share units used to calculate CAP was determined using a Monte Carlo simulation valuation model, in accordance with FASB ASC 718. |
| ii. | The fair value of option awards used to calculate CAP was determined using the Black-Scholes option pricing model, in accordance with FASB 718. |
| (3) | The peer group index is comprised of the Research Development Group (“RDG”) Internet Index, which is the industry line peer group reported in our 2024 Form 10-K. |
| (4) | The Company Selected Measure (CSM) is Adjusted EBITDA. |
| (1) | Our PEO for each year reported is Douglas Lebda, our Chief Executive Officer. The individuals comprising the Non-PEO NEOs for each reported year are listed below. |
| 2020 | 2021 | 2022 | 2023 | 2024 |
|
Neil Salvage J.D. Moriarty Jill Olmstead Sushil Sharma |
Trent Ziegler J.D. Moriarty Jill Olmstead Scott Peyree Neil Salvage |
Trent Ziegler J.D. Moriarty Scott Peyree Scott Totman |
Trent Ziegler Scott Peyree Scott Totman Jill Olmstead J.D. Moriarty |
Jason Bengel Scott Peyree Scott Totman Jill Olmstead Trent Ziegler |
| (3) | The peer group index is comprised of the Research Development Group (“RDG”) Internet Index, which is the industry line peer group reported in our 2024 Form 10-K. |
| (2) | “Compensation Actually Paid” (CAP) is calculated by taking Summary Compensation Table total compensation: a) less the stock award and stock option grant values; b) plus the year over year change in the fair value of stock and option awards that are unvested as of the end of the year, or vested or were forfeited during the year. The Company has not paid dividends historically and does not sponsor any pension arrangements; thus no adjustments are made for these items. Reconciliation of the Summary Compensation Table total compensation and CAP is summarized in the following table: |
| PEO(i)(ii) | ||||||||||
| Fiscal Year | 2020 | 2021 | 2022 | 2023 | 2024 | |||||
| SCT Total Compensation | $ | 52,023,140 | $ | 1,369,813 | $ | 986,490 | $ | 1,230,808 | $ | 4,711,525 |
| - Stock and Option Award Values Reported in SCT for the Covered Year | $ | (51,173,410) | $ | (609,893) | $ | 0 | $ | 0 | $ | (3,011,650) |
| + Fair Value of Outstanding Unvested Stock and Option Awards Granted in Covered Year | $ | 63,447,076 | $ | 226,810 | $ | 114,755 | $ | 0 | $ | 2,402,706 |
| + Change in Fair Value of Outstanding Unvested Stock and Option Awards from Prior Years | $ | (32,561,596) | $ | (144,913,228) | $ | (3,222,417) | $ | 141,967 | $ | 234,109 |
| + Fair Value of Stock and Option Awards Granted in Covered Year that Vested | $ | 0 | $ | 0 | $ | 0 | $ | 0 | $ | 779,925 |
| + Change in Fair Value of Stock and Option Awards from Prior Years that Vested in Covered Year | $ | (858,230) | $ | (4,526,020) | $ | (15,867,193) | $ | 143,145 | $ | 145,633 |
| - Fair Value of Stock and Option Awards Forfeited during the Covered Year | $ | 0 | $ | 0 | $ | (1,832,134) | $ | 0 | $ | 0 |
| Compensation Actually Paid | $ | 30,876,980 | $ | (148,452,518) | $ | (19,820,499) | $ | 1,515,920 | $ | 5,262,248 |
| i. | The fair value of performance share units used to calculate CAP was determined using a Monte Carlo simulation valuation model, in accordance with FASB ASC 718. |
| ii. | The fair value of option awards used to calculate CAP was determined using the Black-Scholes option pricing model, in accordance with FASB 718. |
| (2) | “Compensation Actually Paid” (CAP) is calculated by taking Summary Compensation Table total compensation: a) less the stock award and stock option grant values; b) plus the year over year change in the fair value of stock and option awards that are unvested as of the end of the year, or vested or were forfeited during the year. The Company has not paid dividends historically and does not sponsor any pension arrangements; thus no adjustments are made for these items. Reconciliation of the Summary Compensation Table total compensation and CAP is summarized in the following table: |
| Average Non-PEO NEO(i)(ii) | ||||||||||
| Fiscal Year | 2020 | 2021 | 2022 | 2023 | 2024 | |||||
| SCT Total Compensation | $ | 2,052,741 | $ | 2,444,037 | $ | 2,669,569 | $ | 1,157,554 | $ | 1,657,745 |
| - Stock and Option Award Values Reported in SCT for the Covered Year | $ | (1,669,445) | $ | (1,678,067) | $ | (2,244,210) | $ | (590,700) | $ | (1,060,241) |
| + Fair Value of Outstanding Unvested Stock and Option Awards Granted in Covered Year | $ | 1,505,983 | $ | 958,366 | $ | 283,037 | $ | 409,320 | $ | 731,622 |
| + Change in Fair Value of Outstanding Unvested Stock and Option Awards from Prior Years | $ | (556,249) | $ | (789,088) | $ | (652,021) | $ | 92,326 | $ | 93,850 |
| + Fair Value of Stock and Option Awards Granted in Covered Year that Vested | $ | 0 | $ | 0 | $ | 0 | $ | 53,680 | $ | 83,192 |
| + Change in Fair Value of Stock and Option Awards from Prior Years that Vested in Covered Year | $ | 83,503 | $ | (743,706) | $ | (178,472) | $ | 109,885 | $ | 167,926 |
| - Fair Value of Stock and Option Awards Forfeited during the Covered Year | $ | 0 | $ | 0 | $ | 0 | $ | (21,350) | $ | (51,630) |
| Compensation Actually Paid | $ | 1,416,532 | $ | 191,542 | $ | (122,097) | $ | 1,210,715 | $ | 1,622,464 |
| i. | The fair value of performance share units used to calculate CAP was determined using a Monte Carlo simulation valuation model, in accordance with FASB ASC 718. |
| ii. | The fair value of option awards used to calculate CAP was determined using the Black-Scholes option pricing model, in accordance with FASB 718. |
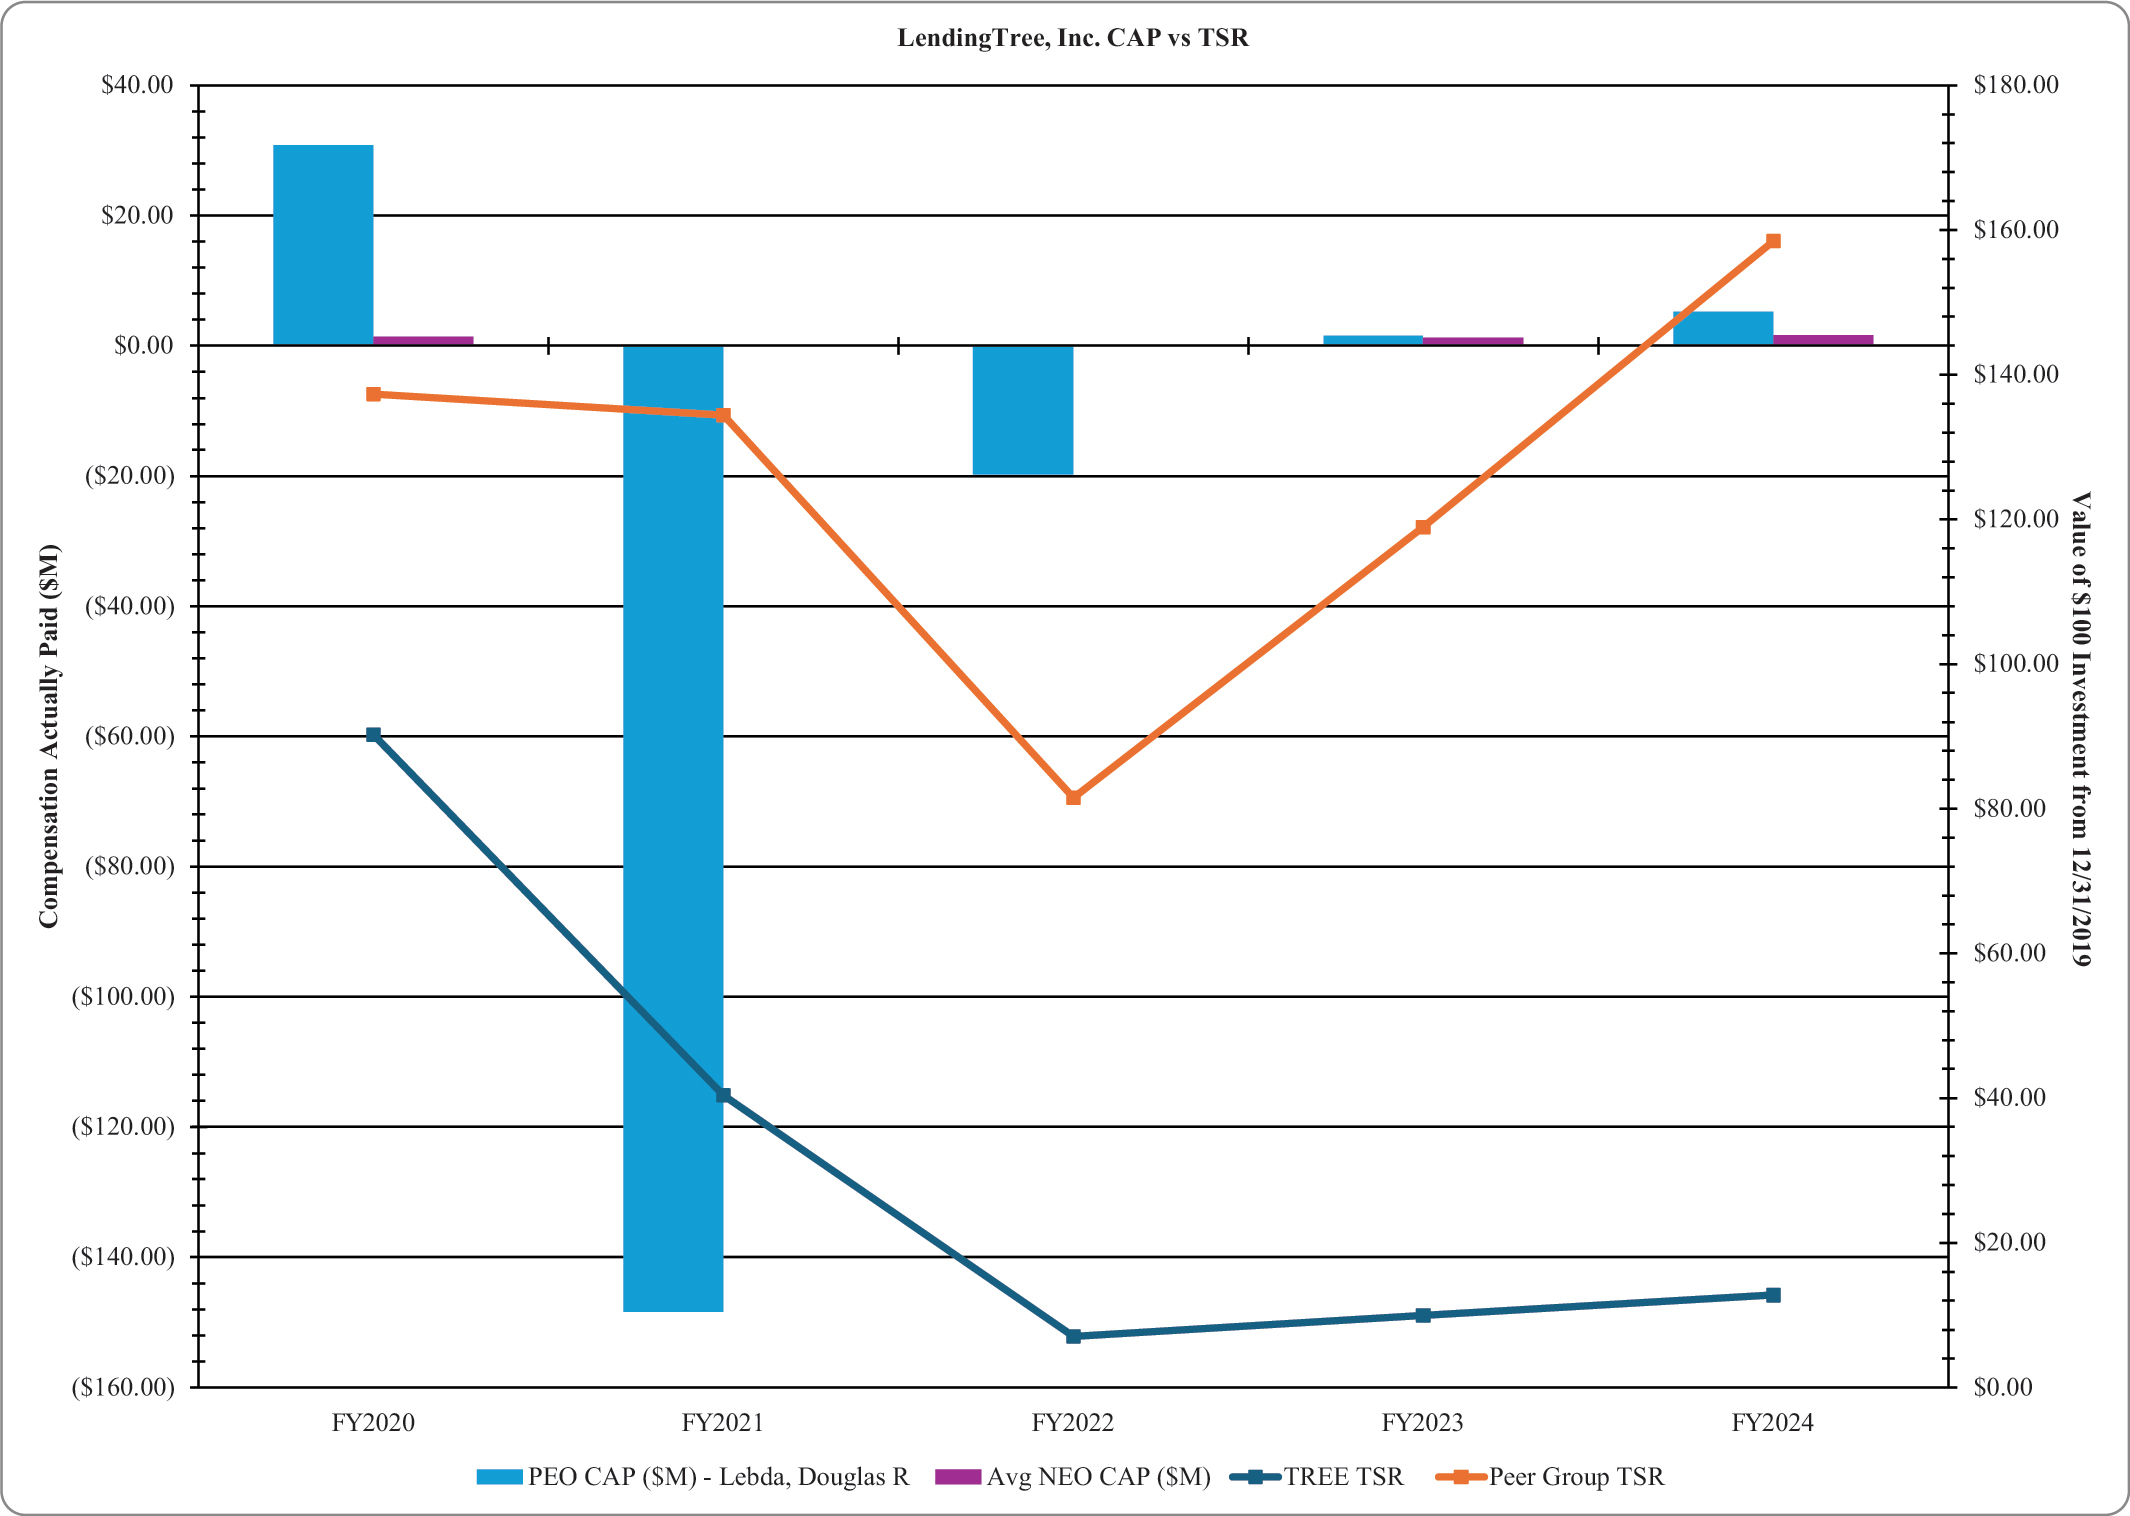
Relationship between CAP and TSR
The graphs below reflect the relationship between the PEO and Average Non-PEO NEO CAP, the Company’s cumulative indexed TSR and RDG Internet Composite Index:
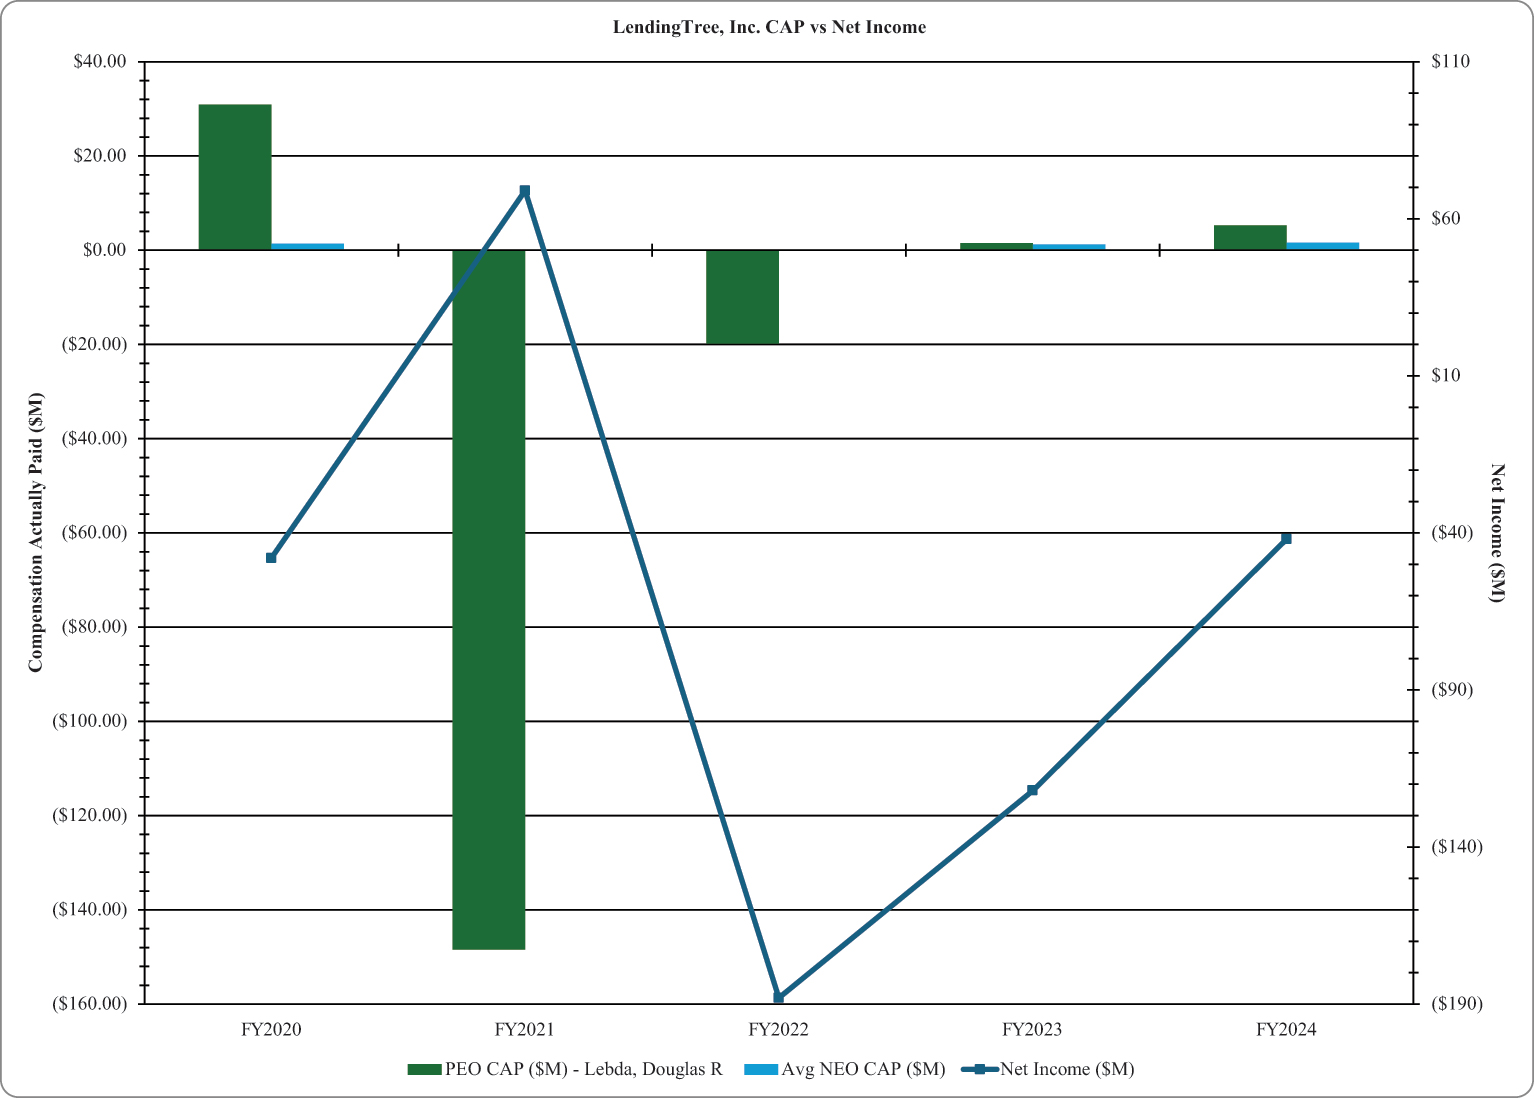
Relationship between CAP and Net Income (GAAP)
The graphs below reflect the relationship between the PEO and Average Non-PEO NEO CAP and the Company’s GAAP Net Income for each applicable reporting year. While we are required by SEC rules to disclose the relationship between our net income and compensation “actually paid” to our NEOs, this is not a metric our Compensation Committee currently uses in evaluating our NEOs’ compensation.
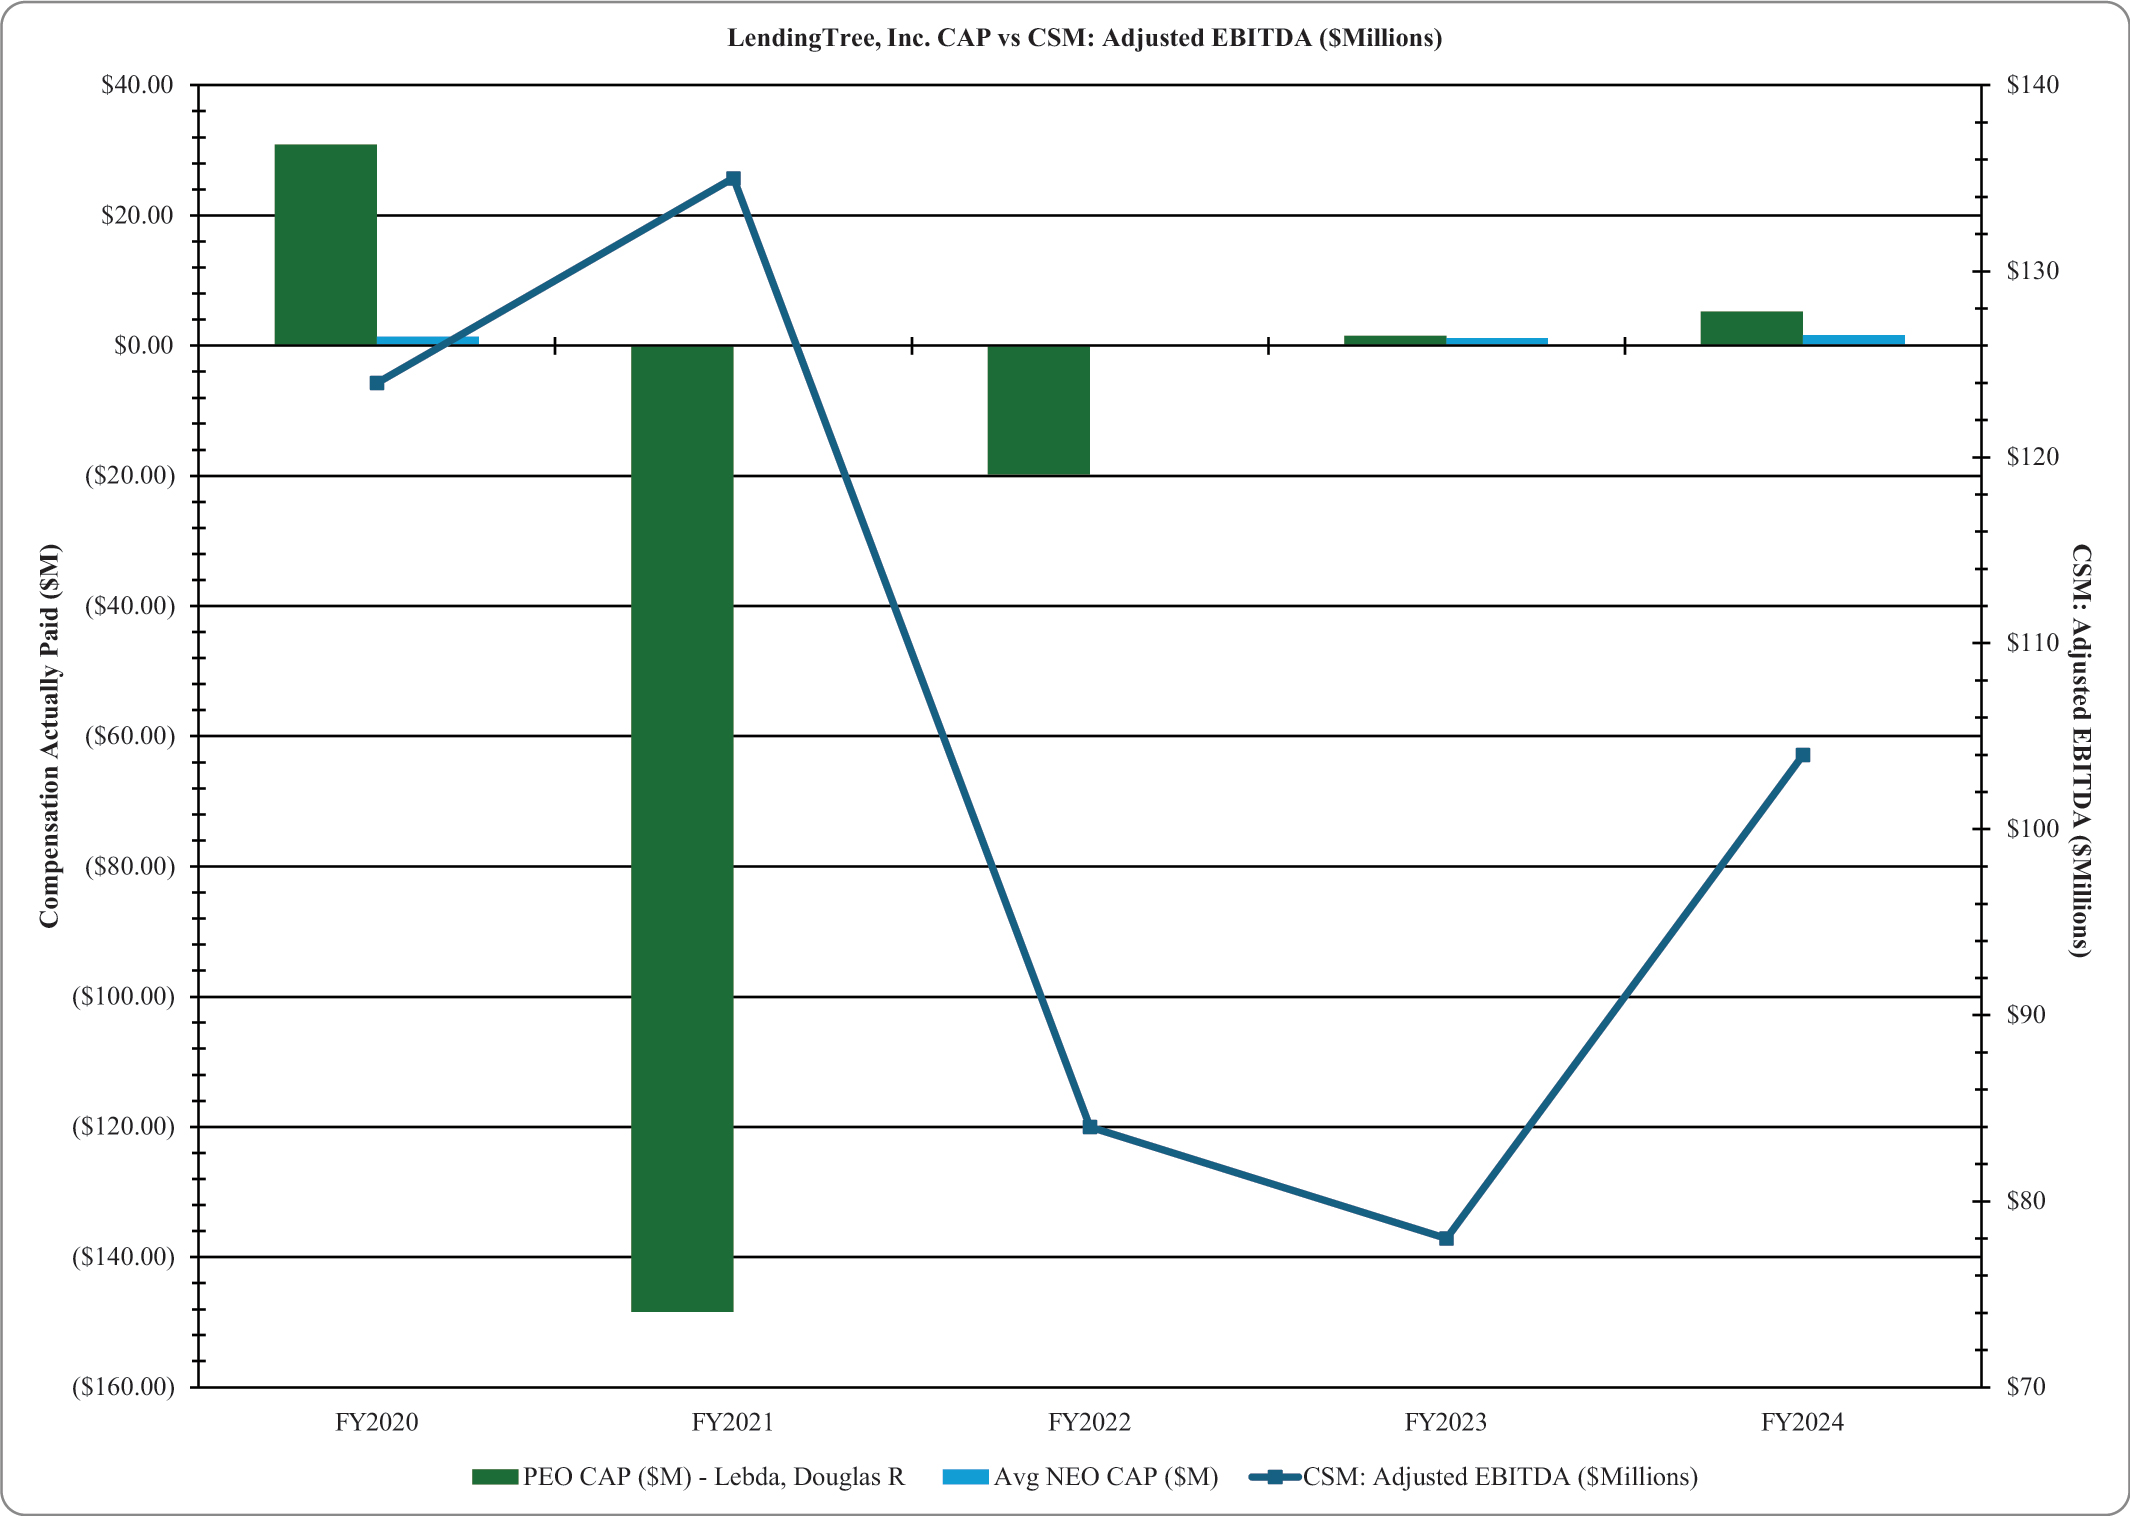
Relationship between CAP and EBITDA
The graphs below reflect the relationship between the PEO and Average Non-PEO NEO CAP and the Company’s EBITDA for each applicable reporting year.
Relationship between CAP and TSR
The graphs below reflect the relationship between the PEO and Average Non-PEO NEO CAP, the Company’s cumulative indexed TSR and RDG Internet Composite Index:
Most Important Metrics Used for Linking Pay and Performance:
The most important metrics the Compensation Committee used to link executive compensation to performance in 2024 are listed below. These measures, along with others, impact compensation outcomes for the NEOs.
| Most Important Performance Measures |
| Stock Price Adjusted EBITDA Revenue |
Compensation decisions are made each year taking into account a number of other factors, in addition to the metrics detailed above. Target pay levels are set based on individual performance, scope of responsibility, and an annual assessment of pay competitiveness within the market.