Pay vs Performance Disclosure - USD ($)
Sep. 12, 2023
Dec. 31, 2024
Dec. 31, 2023
Pay Versus Performance Table
The following table sets forth information concerning the compensation provided to our NEOs and certain measures of Company performance in the years ended December 31, 2024 and 2023, for services to the Company in all capacities.
Summary Compensation Table Total for PEO ($) |
Compensation Actually Paid to PEO ($) (1)(2)(3) |
Average Summary Compensation Table Total for Non-PEO NEOs ($) |
Average Compensation Actually Paid to Non-PEO NEOs ($) (1)(2)(3) |
Value of Initial Fixed $100 Investment Based on: |
Net Income ($) |
Adjusted EBITDA ($) (5) |
||||||||||||||||||||||||||
Fiscal Year |
Total Shareholder Return ($) (4) |
Peer Group Index Total Shareholder Return ($) (4) |
||||||||||||||||||||||||||||||
2024 |
18,129,271 | 40,619,413 | 16,534,551 | 21,399,404 | 143.18 | 150.64 | 6,377,088 | 1,251,238,529 | ||||||||||||||||||||||||
| 2023 | 64,912,560 | 56,578,222 | 8,435,228 | 7,963,553 | 82.19 | 107.00 | 175,722,864 | 809,087,712 | ||||||||||||||||||||||||
| (1) | Amounts represent compensation actually paid (“CAP”) to our CEO, who was our Principal Executive Officer or “PEO” for fiscal years 2023 and 2024, and the average CAP to our remaining NEOs or “Non-PEO NEOs” for fiscal years 2023 and 2024, as determined under SEC rules, which includes the individuals indicated below for fiscal years 2023 and 2024: |
Year |
PEO |
Non-PEO NEOs | ||||||||||
2024 |
Ariel Emanuel | Mark Shapiro, Andrew Schleimer and Seth Krauss | ||||||||||
2023 |
Ariel Emanuel |
Mark Shapiro, Andrew Schleimer and Seth Krauss | ||||||||||
| (2) | Amounts represent the Summary Compensation Table Total Compensation for the applicable fiscal year adjusted as follows: |
Applicable Fiscal Year (“FY”) |
2023 |
2024 |
||||||||||||||
PEO |
Average non-PEO NEOs |
PEO |
Average non-PEO NEOs |
|||||||||||||
| Deduction for Amounts Reported under the “Stock Awards” and “Option Awards” Columns in the Summary Compensation Table for Applicable FY | (40,000,094 | ) | (3,133,767 | ) | (2,502,864 | ) | (8,429,236 | ) | ||||||||
| Increase based on ASC 718 Fair Value of Awards Granted during Applicable FY that Remain Unvested as of Applicable FY End, determined as of Applicable FY End | 31,666,256 | 2,662,091 | 4,130,285 | 11,867,180 | ||||||||||||
| Increase/deduction for Awards Granted during Prior FY that were Outstanding and Unvested as of Applicable FY End, determined based on change in ASC 718 Fair Value from Prior FY End to Applicable FY End | — | — | 17,621,615 | 500,987 | ||||||||||||
| Increase/deduction for Awards Granted during Prior FY that Vested During Applicable FY, determined based on change in ASC 718 Fair Value from Prior FY End to Vesting Date | — | — | 3,242,106 | 925,923 | ||||||||||||
Total Adjustments |
(8,333,838 | ) | (471,675 | ) | 22,490,143 | 4,864,853 | ||||||||||
| (3) | The fair values of restricted stock units included in the CAP to our PEO and the Average CAP to our Non-PEO NEOs are calculated at the required measurement dates, consistent with the approach used to value the awards at the grant date as described in our Annual Report. Any changes to the fair values of our restricted stock units from the grant date are based on our updated stock price at the applicable measurement date. For the year presented, the increases or decreases in the year-end restricted stock unit fair value from the fair value on the grant date were affected by changes in the stock price. For additional information on the assumptions used to calculate the valuation of the awards, see Note 13 to our audited consolidated financial statements included in our Annual Report. |
| (4) | Reflects the period from September 12, 2023, the date of consummation of the TKO Transactions, through the end of the applicable fiscal year. |
| (5) | Adjusted EBITDA is a non-GAAP measure and is calculated from our audited financial statements as follows: net income, excluding income taxes, net interest expense, depreciation and amortization, equity-based compensation, merger and acquisition costs, certain legal costs, restructuring, severance and impairment charges, and certain other items when applicable. For a reconciliation of the differences between Adjusted EBITDA and the most directly comparable financial measure calculated and presented in accordance with GAAP, see Part II, Item 7. “Management’s Discussion and Analysis of Financial Condition and Results of Operation—Non-GAAP Financial Measures” on page 54 and 55 of our Annual Report. |
| (1) | Amounts represent compensation actually paid (“CAP”) to our CEO, who was our Principal Executive Officer or “PEO” for fiscal years 2023 and 2024, and the average CAP to our remaining NEOs or “Non-PEO NEOs” for fiscal years 2023 and 2024, as determined under SEC rules, which includes the individuals indicated below for fiscal years 2023 and 2024: |
Year |
PEO |
Non-PEO NEOs | ||||||||||
2024 |
Ariel Emanuel | Mark Shapiro, Andrew Schleimer and Seth Krauss | ||||||||||
2023 |
Ariel Emanuel |
Mark Shapiro, Andrew Schleimer and Seth Krauss | ||||||||||
| (2) | Amounts represent the Summary Compensation Table Total Compensation for the applicable fiscal year adjusted as follows: |
Applicable Fiscal Year (“FY”) |
2023 |
2024 |
||||||||||||||
PEO |
Average non-PEO NEOs |
PEO |
Average non-PEO NEOs |
|||||||||||||
| Deduction for Amounts Reported under the “Stock Awards” and “Option Awards” Columns in the Summary Compensation Table for Applicable FY | (40,000,094 | ) | (3,133,767 | ) | (2,502,864 | ) | (8,429,236 | ) | ||||||||
| Increase based on ASC 718 Fair Value of Awards Granted during Applicable FY that Remain Unvested as of Applicable FY End, determined as of Applicable FY End | 31,666,256 | 2,662,091 | 4,130,285 | 11,867,180 | ||||||||||||
| Increase/deduction for Awards Granted during Prior FY that were Outstanding and Unvested as of Applicable FY End, determined based on change in ASC 718 Fair Value from Prior FY End to Applicable FY End | — | — | 17,621,615 | 500,987 | ||||||||||||
| Increase/deduction for Awards Granted during Prior FY that Vested During Applicable FY, determined based on change in ASC 718 Fair Value from Prior FY End to Vesting Date | — | — | 3,242,106 | 925,923 | ||||||||||||
Total Adjustments |
(8,333,838 | ) | (471,675 | ) | 22,490,143 | 4,864,853 | ||||||||||
The chart below provides a comparison between (i) the total stockholder return of the Company and of the S&P 1500 Media and Entertainment Industry Group Index assuming a fixed $100 initial investment on September 12, 2023 (the date our Class A common stock began trading on NYSE) and reinvestment of dividends, and (ii) the compensation actually paid to our PEO and the average compensation actually paid to our
non-PEO
named executive officers for the years ended December 31, 2023 and 2024. 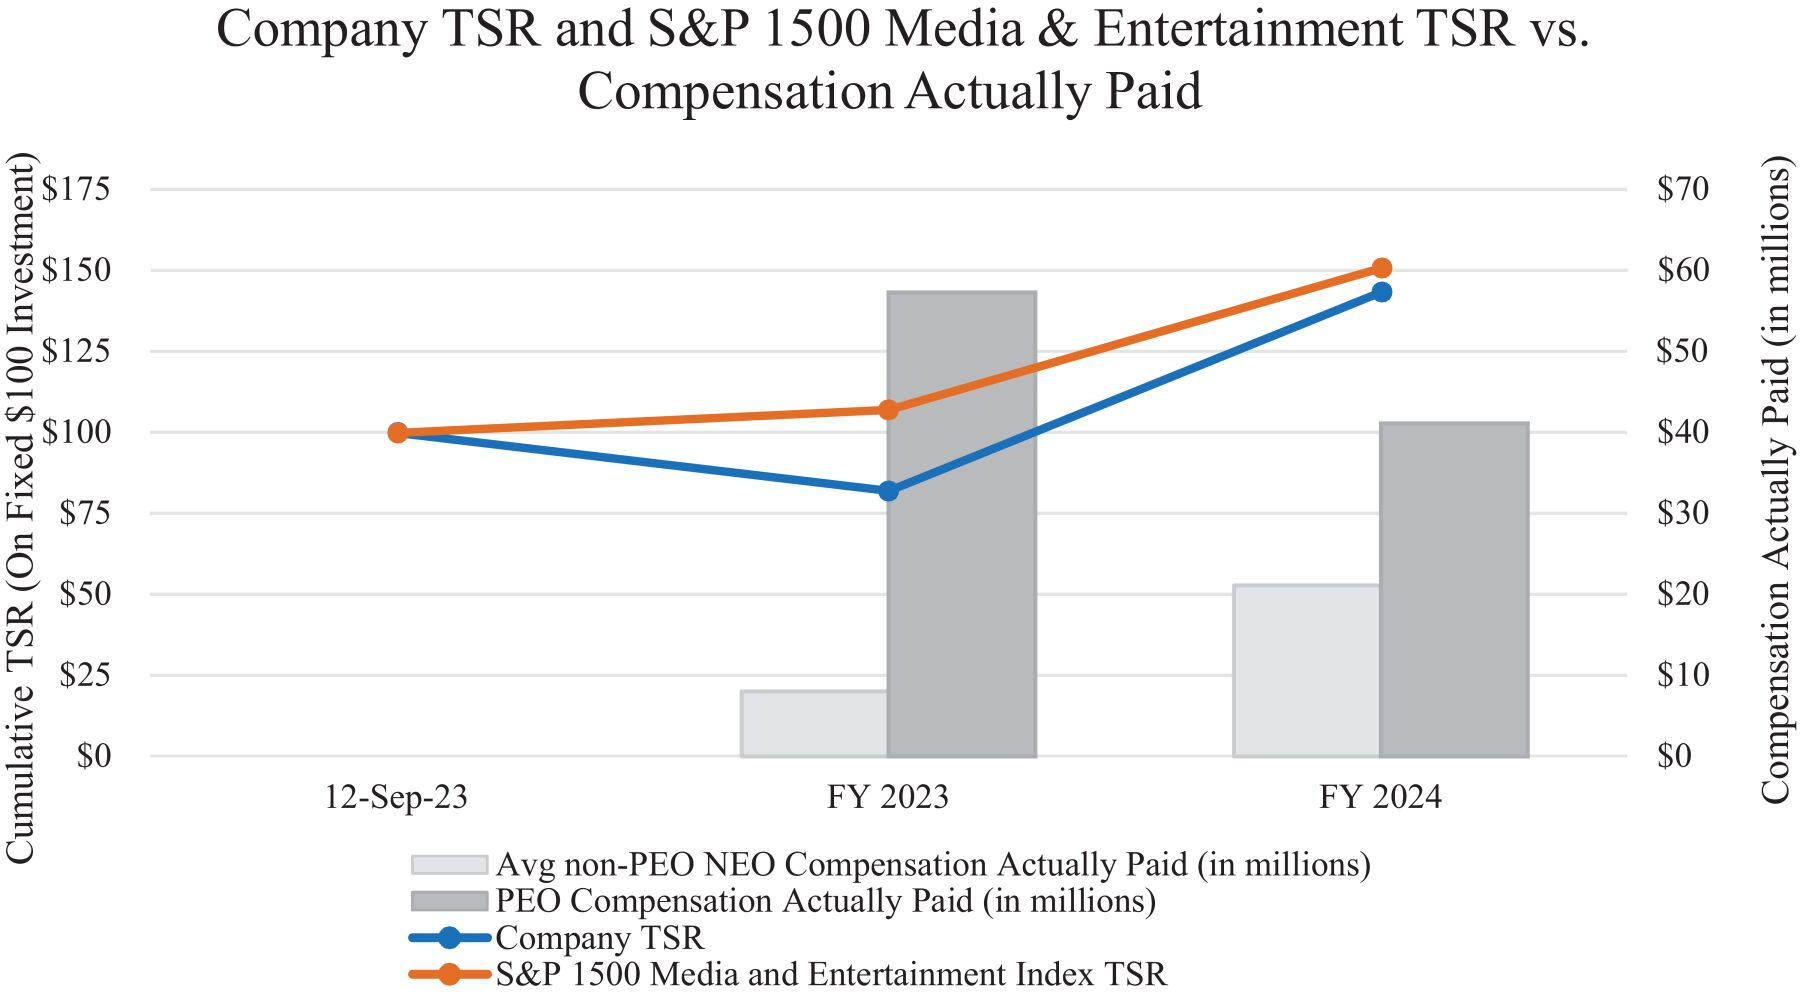
September 12, 2023 |
FY 2023 |
FY 2024 |
||||||||||
Company TSR |
$ | 100 | $ | 82.19 | $ | 143.18 | ||||||
S&P 1500 Media and Entertainment Index TSR |
$ | 100 | $ | 107.00 | $ | 150.64 | ||||||
PEO Compensation Actually Paid (in millions) |
— | $ | 57 | $ | 41 | |||||||
Avg. non-PEO NEO Compensation Actually Paid (in millions) |
$ | 8 | $ | 21 | ||||||||
The chart below provides a comparison between (i) the Company’s Net Income and (ii) compensation actually paid to our PEO and average compensation actually paid to our
non-PEO
named executive officers for the fiscal years ended December 31, 2023 and 2024. 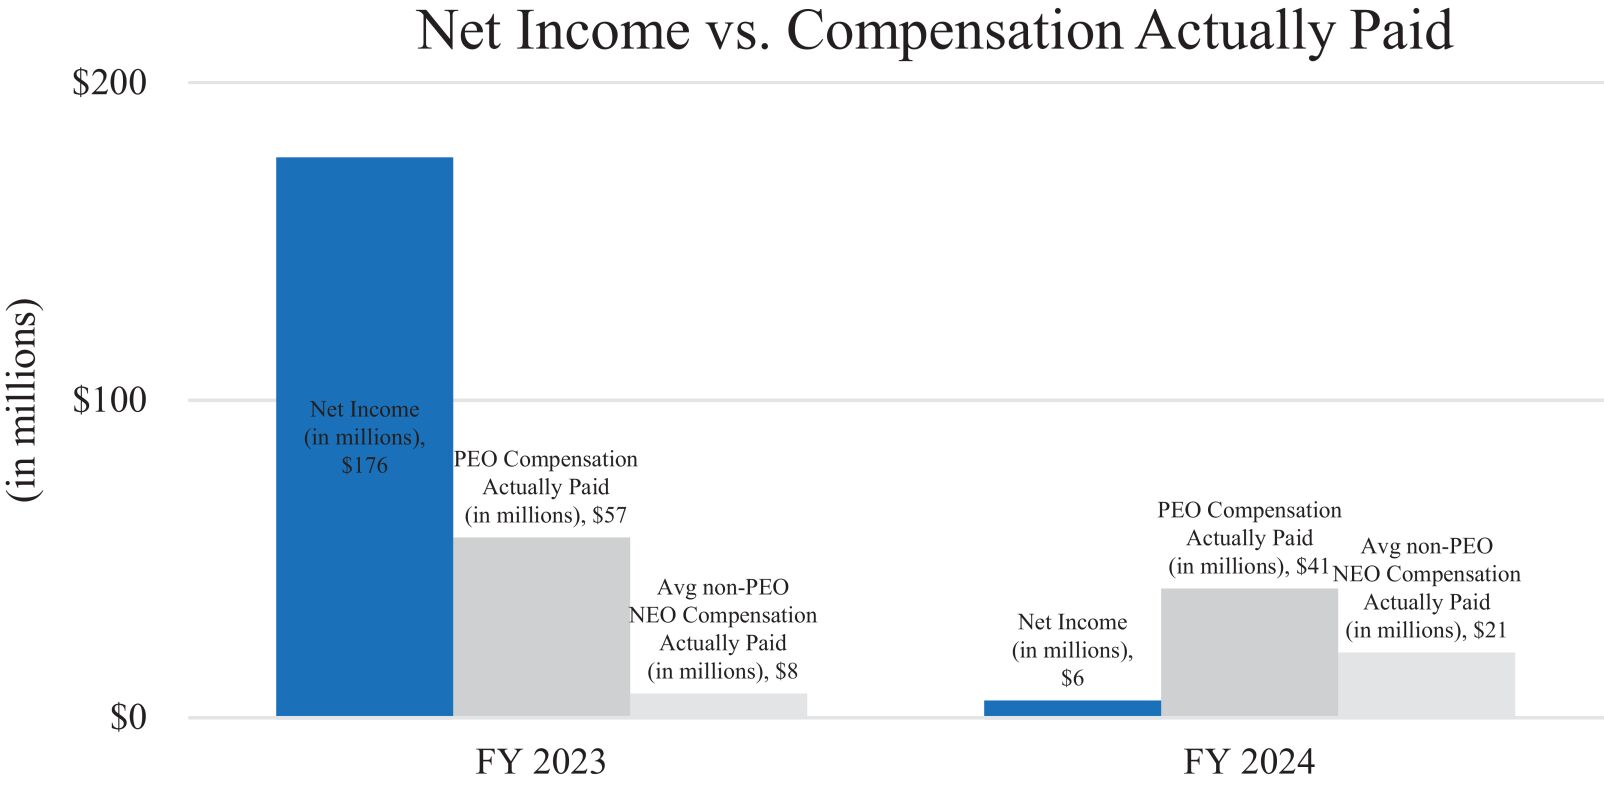
FY 2023 |
FY 2024 |
|||||||
Net Income (in millions) |
$ | 176 | $ | 6 | ||||
PEO Compensation Actually Paid (in millions) |
$ | 57 | $ | 41 | ||||
Avg. non-PEO NEO Compensation Actually Paid (in millions) |
$ | 8 | $ | 21 | ||||
The chart below provides a comparison between (i) the Company’s Adjusted EBITDA and (ii) compensation actually paid to our PEO and average compensation actually paid to our
non-PEO
named executive officers for the fiscal years ended December 31, 2023 and 2024. 
FY 2023 |
FY 2024 |
|||||||
Adjusted EBITDA (in millions) (1) |
$ | 809 | $ | 1,251 | ||||
PEO Compensation Actually Paid (in millions) |
$ | 57 | $ | 41 | ||||
Avg. non-PEO NEO Compensation Actually Paid (in millions) |
$ | 8 | $ | 21 | ||||
| (1) | Adjusted EBITDA is a non-GAAP measure and is calculated from our audited financial statements as follows: net income, excluding income taxes, net interest expense, depreciation and amortization, equity-based compensation, merger and acquisition costs, certain legal |
costs, restructuring, severance and impairment charges, and certain other items when applicable. For a reconciliation of the differences between Adjusted EBITDA and the most directly comparable financial measure calculated and presented in accordance with GAAP, see Part II, Item 7. “Management’s Discussion and Analysis of Financial Condition and Results of Operation—Non -GAAP Financial Measures” on page 54 and 55 of our Annual Report. |
The chart below provides a comparison between (i) the total stockholder return of the Company and of the S&P 1500 Media and Entertainment Industry Group Index assuming a fixed $100 initial investment on September 12, 2023 (the date our Class A common stock began trading on NYSE) and reinvestment of dividends, and (ii) the compensation actually paid to our PEO and the average compensation actually paid to our
non-PEO
named executive officers for the years ended December 31, 2023 and 2024. September 12, 2023 |
FY 2023 |
FY 2024 |
||||||||||
Company TSR |
$ | 100 | $ | 82.19 | $ | 143.18 | ||||||
S&P 1500 Media and Entertainment Index TSR |
$ | 100 | $ | 107.00 | $ | 150.64 | ||||||
PEO Compensation Actually Paid (in millions) |
— | $ | 57 | $ | 41 | |||||||
Avg. non-PEO NEO Compensation Actually Paid (in millions) |
$ | 8 | $ | 21 | ||||||||
2024 Pay Versus Performance Tabular List
As required by Item 402(v) of
Regulation S-K, we
are providing the following information regarding the performance measure that we believe represents the most important financial performance measure used by us to link compensation actually paid to our named executive officers for the fiscal year 2024. Such performance measure represented the only financial performance measure that was used by the Company to link compensation actually paid to our named executive officers for fiscal year 2024 to Company performance. Performance Measure
Adjusted EBITDA
non-GAAP
measure and is calculated from our audited financial statements as follows: net income, excluding income taxes, net interest expense, depreciation and amortization, equity-based compensation, merger and acquisition costs, certain legal costs, restructuring, severance and impairment charges, and certain other items when applicable. For a reconciliation of the differences between Adjusted EBITDA and the most directly comparable financial measure calculated and presented in accordance with GAAP, see Part II, Item 7. “Management’s Discussion and Analysis of Financial Condition and Results of Operation—Non-GAAP
Financial Measures” on page 54 and 55 of our Annual Report.